If you are trading on Binance or any crypto exchange, the 'candlestick chart' is your most important tool.
Each candle indicates the market situation for a specific time – but the real understanding lies in bullish or bearish signals.
---
1. Bullish Candle (Green or White):
When a coin's closing price is higher than its opening price.
Meaning, buyers have gained control over the market.
The body of the candle is green or white in color.
The lower line (wick) shows the lowest price at that time.
The upper line (wick) shows the highest price at that time.
This candle indicates a rise in price.
Example: If BTC opened at 60,000 and closed at 62,000, it would be a bullish candle.
---
2. Bearish Candle (Red or Black):
When a coin's closing price is lower than its opening price.
Meaning, sellers have exerted pressure on the market.
The body of the candle is red or black in color.
The upper wick shows the highest rate of that day.
The lower wick indicates the lowest rate of that day.
This candle indicates a drop in price.
Example: If BTC opened at 62,000 and closed at 60,000, it would be a bearish candle.
---
Advice for new learners:
Candles should not be viewed in isolation.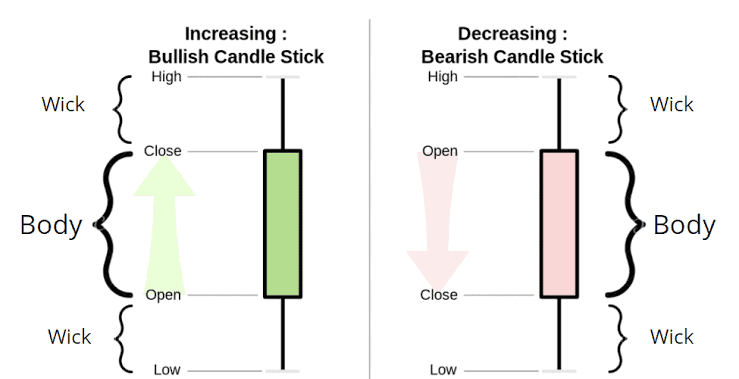 Always analyze the trend, volume, and previous candles as well.
#BullNBearFight #LearnFromKhurram #CandlestickChart #BullishCandle #BearishCandle #BinanceUrdu #CryptoTips #CryptoLearning