In this article, I will explain what a pin bar is and how you can correctly identify it on your chart.
A pin bar is an individual candlestick pattern characterized by its long tail and small body.
In fact, there are two types of pin bars:
• Bullish pin bar characterized by a long tail downwards.
The tail means the market has rejected lower prices, indicating that buyers are in control at that time.
• Bearish pin bar characterized by a long tail upwards, indicating that sellers are in control of the market.
---
Now the question is how to recognize a standard pin bar?
To determine whether to trade on a pin bar or not, you need to keep in mind some rules:
• Rule number 1: Do not trade pin bars on smaller time frames.
Pin bars often form on smaller time frames, but they are not reliable.
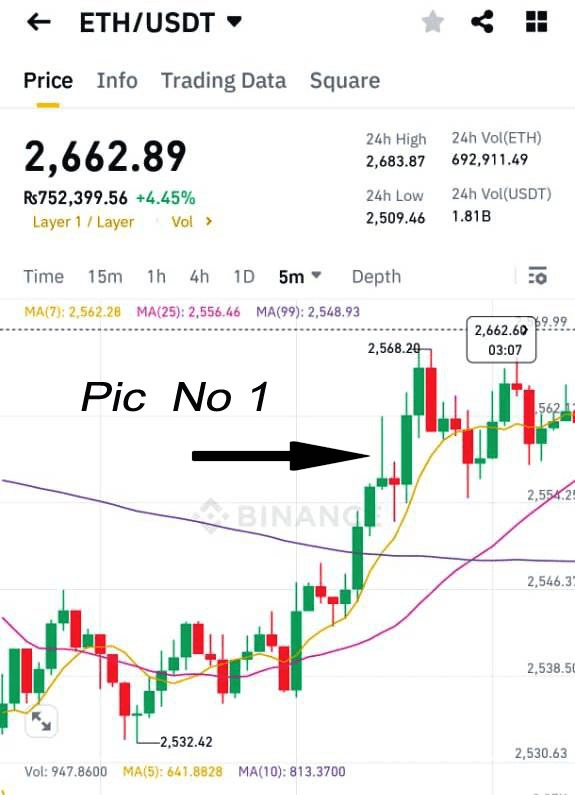
For example: this is a 5-minute chart of Ethereum.
Here the market is going up, and we see a nice bearish pin bar. See number 1 in the image.
This bearish pin bar indicates that sellers are in control of the market and a potential reversal is coming.
Unfortunately, that did not happen, and the market continued to rise.
Another bearish pin bar formed at the top, but the market came down a bit and then started to rise again. See number 2 in the image.
That didn't work either.
This proves that pin bars are less reliable on smaller time frames.
The key point is that pin bars provide more accurate signals on larger time frames.
Trades may be fewer, but if done correctly, the profit can be substantial.
---
• Rule number 2: Do not rely solely on pin bars.
This pattern works well on larger time frames, but if you keep trading solely based on pin bars, it will prove to be detrimental.
---
Now the question is how to recognize a good pin bar setup?
For this, we use the TLS method, which consists of three key elements:
1. Trend
2. Level (support or resistance level)
3. Signal (clear pin bar)
Let's test the TLS method.
• First element: Trend — the market is clearly going down
So we should only be interested in bearish pin bars.
• Second element: Level — a support level that becomes resistance after breaking.
• Third element: Pin bar — a bearish pin bar formed at this resistance level.
Which indicates that the retracement is ending and a new downward movement is about to begin.
---
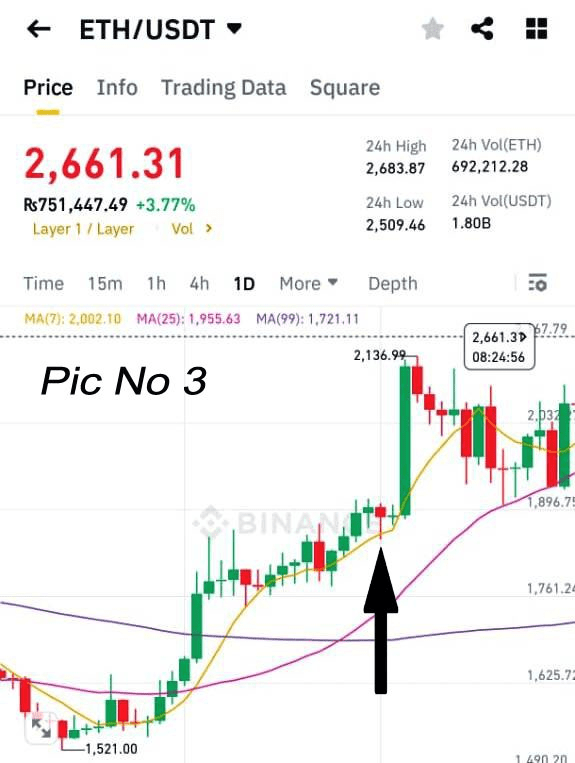
For example: this is a daily chart of Ethereum.
• The market is going up (buyers are strong)
• We only need to look at bullish pin bars.
• There was a resistance here that later became support.
• A bullish pin bar formed at this support — this is a standard setup.
• The market actually started to rise afterwards. See image 3.
Important point:
The market only trends 30% of the time and is in a range 70% of the time.
---
Now the question is how to identify a standard pin bar in a ranging market?
A ranging market is one where the price moves between a specific high and low.
• High price = resistance
• Low price = support
In such a market, only those pin bars are reliable that form at support or resistance.
Ignore pin bars that form in between.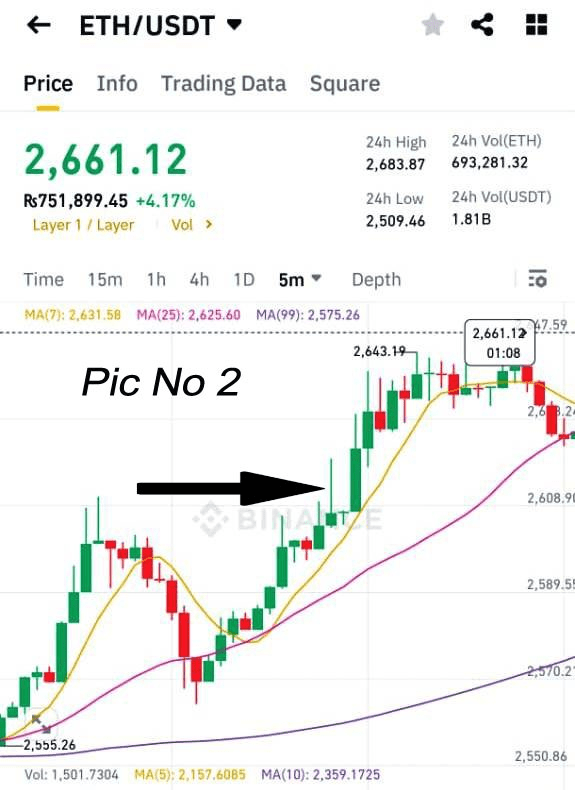
#BullNBearFight #LearnFromKhurram #CandlestickChart #BullishCandle #BearishCandle #BinanceUrdu #CryptoTips #BullNBearFight #KhurramSeSeekho #CandlestickChart #BullishCandle #BearishCandle #BinanceUrdu #CryptoTips #CryptoLearning