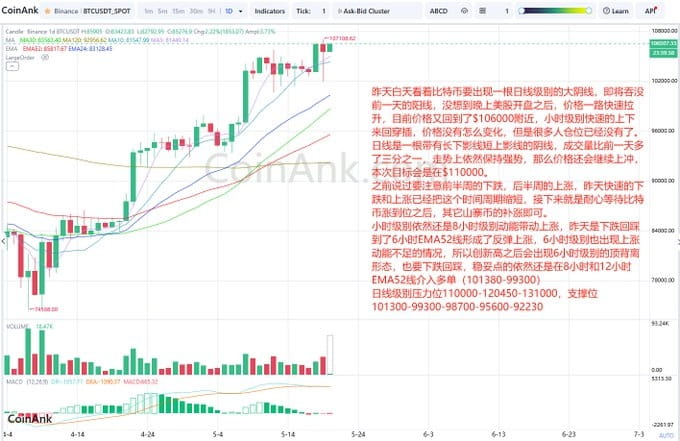
Yesterday during the day, I saw that Bitcoin was about to show a large bearish daily candle, which would engulf the previous day's bullish candle. I didn't expect that after the US stock market opened in the evening, the price rapidly surged. Currently, the price has returned to around $106,000, with quick movements back and forth on the hourly level. The price hasn't changed much, but many people's positions are already gone.
The daily candle is a bearish candle with a long lower shadow and a short upper shadow, and the trading volume is one-third more than the previous day. The trend remains strong, so the price will continue to rise. The target this time will be at $110,000.
I previously mentioned to pay attention to the decline in the first half of the week and the rise in the second half. The quick drop and rise yesterday have shortened this time cycle. Next, we just need to patiently wait for Bitcoin to rise to its target before the altcoins can catch up.
The hourly level is still driven by the 8-hour momentum to rise. Yesterday, the price dropped and touched the 6-hour EMA 52 line, forming a rebound. There is also a situation of insufficient upward momentum at the 6-hour level, so after new highs, there will be a top divergence pattern at the 6-hour level, and it will need to drop back to test. The safer approach is still to enter long positions at the 8-hour and 12-hour EMA 52 lines (101380-99300).
Resistance levels at the daily level are 110000-120450-131000, and support levels are 101300-99300-98700-95600-92230.
From Bitcoin's liquidation heatmap, we can see
The price is rising, and there are a large number of significant short positions waiting to be liquidated in the 106050-109250 area.
The price is falling, and there are a large number of significant and extra-large long positions waiting to be liquidated in the 101950-99000 area.


