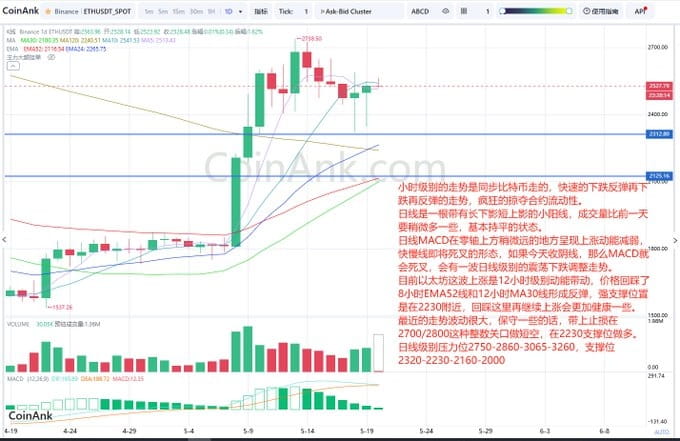
The hourly trend is synchronized with Bitcoin, showing a rapid decline followed by a rebound, then another decline and rebound, crazily plundering contract liquidity.
The daily line shows a small bullish candle with a long lower shadow and a short upper shadow, with trading volume slightly higher than the previous day, indicating a basically stable state.
The daily MACD is showing weakening upward momentum slightly above the zero axis, with the fast and slow lines about to cross negatively. If today closes with a bearish candle, the MACD will cross negatively, leading to a wave of daily-level oscillating downward adjustment.
Currently, this wave of Ethereum's rise is driven by 12-hour level momentum, with the price retracing to the 8-hour EMA52 line and the 12-hour MA30 line forming a rebound. The strong support level is around 2230, and continuing to rise after retracing here would be healthier.
The recent price fluctuations have been quite large. Being more conservative, set a stop loss and short near the 2700/2800 whole number points, and go long at the 2230 support level.
Daily level resistance levels are 2750-2860-3065-3260, and support levels are 2320-2230-2160-2000.
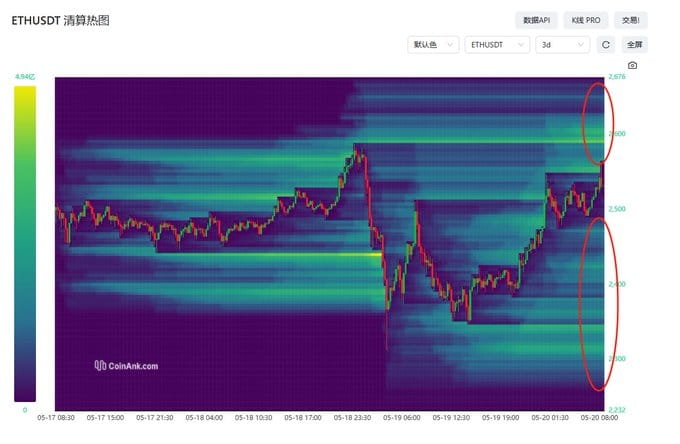
From Ethereum's liquidation heatmap,
the price is rising, with a large number of significant short positions waiting to be liquidated in the 2568-2632 area.
the price is falling, with a large number of significant long positions waiting to be liquidated in the 2488-2284 area.