I. Core assessment of short-term trend
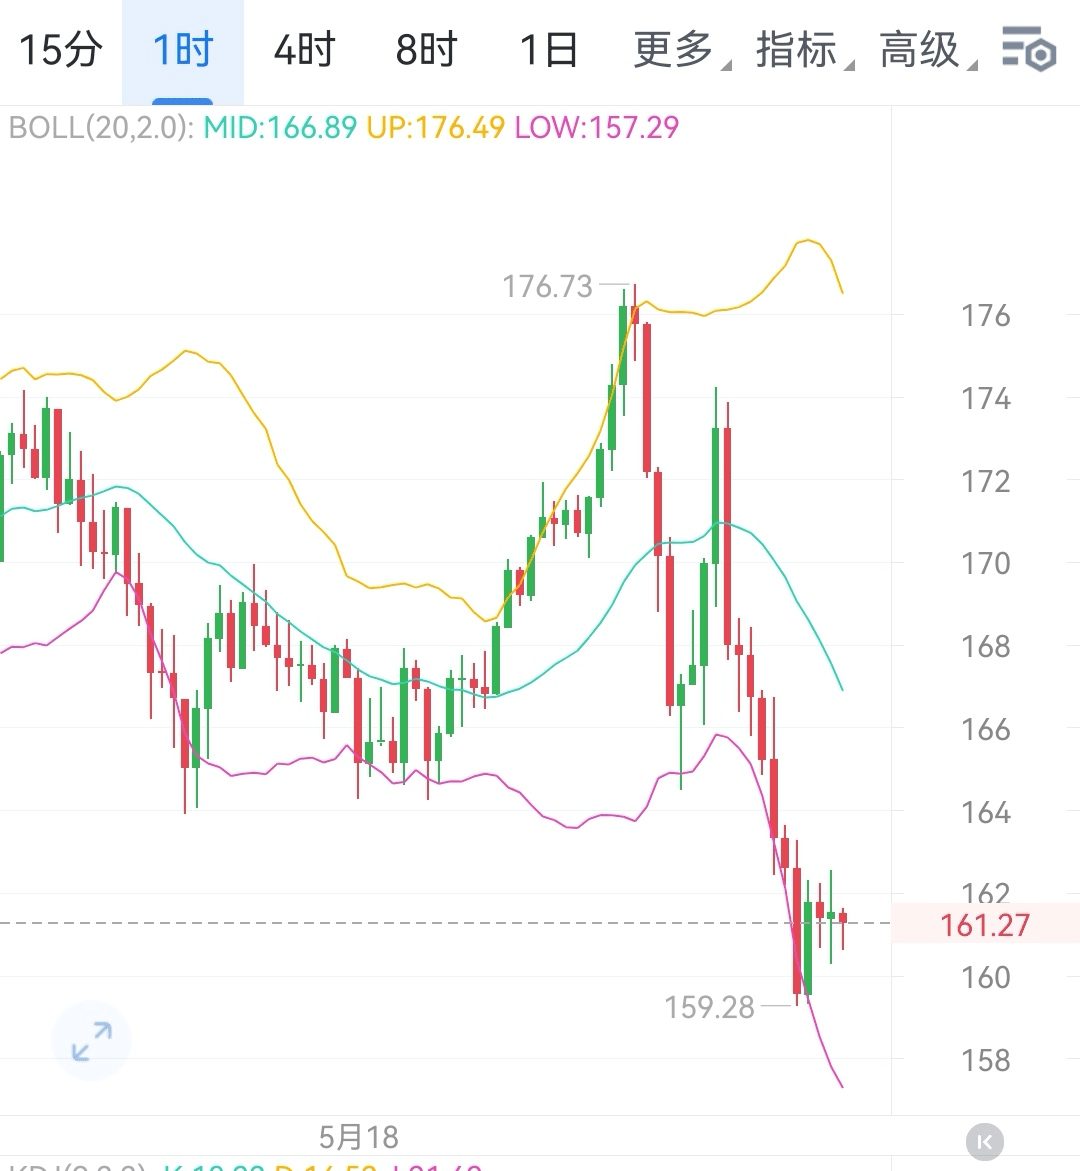
Today's market trend focuses on the key node of 164, an important price level. The performance of the 1-hour K-line at this price will become the core basis for judging whether a short-term rebound can be initiated.
Bullish activation signal
If the 1-hour K-line can effectively hold above 164 and subsequently close above this price for two consecutive periods, it indicates the end of a small-level correction, with bullish strength beginning to dominate, and a new round of rebound is expected to start, with prices likely to gradually test the resistance level upwards.
Bearish continuation signal
Conversely, if the price cannot consistently stay above 164 on the 1-hour level, it indicates insufficient momentum for a small-level rebound, and the bears still hold the market's initiative, with a high probability that the market will continue its downward trend, entering a new round of retracement phase.
II. Distribution of key points and strategy reference
(I) Upward resistance level
1. First resistance level: 168.8
- Technical features: This position is the upper edge of the recent price fluctuation range, gathering a large number of trapped positions and profit-taking positions. When the price rises to this point, dual selling pressure will directly hinder short-term upward movements, becoming the primary barrier that the bulls need to overcome.
2. Mid-term resistance level: 174
- Technical features: Located in the overlapping zone of key moving average resistance areas and significant Fibonacci resistance levels, it exerts strong pressure on price upward movements. To achieve effective breakthroughs, not only sufficient buying capital is needed, but also a warming market sentiment is required.
3. Trend breakout level: 178.3
- Technical features: Once the price successfully stabilizes at this point, it will confirm its entry into a new upward channel, with subsequent upward space likely to be significantly opened, indicating that a new round of strong upward momentum is about to arrive.
(II) Downward support level
If the 1-hour level fails to hold above 164, it is expected to trigger a new round of retracement, with the following support levels in order:
1. Primary support level: 159.2
- Technical features: Formed by the convergence of short-term moving averages, it also serves as an important psychological defense line tested multiple times previously, which can buffer the impact of bearish downward pressure to a certain extent.
2. Secondary support level: 155.8
- Technical features: As a strong support level formed by previous price lows, if this level is breached, market panic may spread quickly, triggering larger-scale selling behavior, leading to accelerated price decline.
3. Strong support level: 150.8
- Technical features: This point is located in a support area where multiple time-frame moving averages converge, making it a key strategic position for both bulls and bears, with its gains or losses directly affecting the subsequent medium to long-term trend. Once broken, it may trigger a deep correction.
III. Summary
The core of today's market trend lies in the long-short game at the key point of 164. If the price can effectively stabilize above this position, the bulls are expected to challenge the resistance range of 168.8 - 178.3; if it cannot hold, one must be wary of the risk of price retracing to the 159.2 - 150.8 area. The volatility is intense and full of uncertainty, so it is recommended to closely monitor the changes in the 1-hour K-line pattern, strictly implement stop-loss and take-profit strategies, and reasonably control positions.$SOL #SOL走势