

Source: Talk Li Talk Outside
Today is May 19, and many people may be familiar with the number 519. On May 19, 2021, a major crash occurred in the crypto market, with Bitcoin's price plummeting sharply from around 44,000 dollars to 29,000 dollars (a drop of over 34%), Ethereum halving directly, and other altcoins like Dogecoin also experiencing significant declines, leading to many investors being liquidated and the market falling into extreme panic.
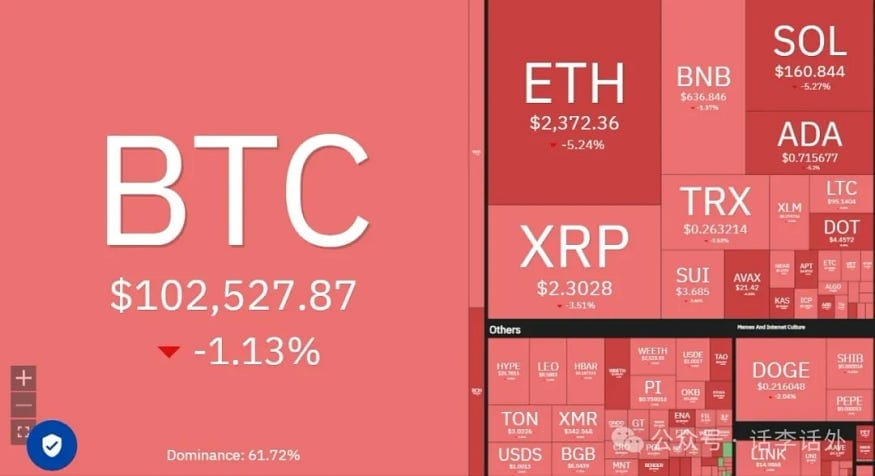
Yesterday (May 18), Bitcoin briefly broke through the 107,000 dollar mark, just a hair's breadth away from its historical peak. Perhaps it is still because people cannot forget the shadow of 519 from a few years ago. Today, Bitcoin continued to experience a slight pullback, and as of the time of writing this article, the price is around 102,500 dollars. As shown in the chart below.
Just yesterday, a friend messaged me asking: Will Bitcoin rise to 150,000 dollars this year?
I said: It's not impossible, but you also need to consider your holding cost and target. If the risk isn't too high and you have a cash flow (U) need, then starting to consider gradually selling around 100,000 is indeed an option. Of course, if you are holding long-term, it doesn't matter; even if this bull market doesn't reach 150,000, the next bull market is likely to see it.
A friend continues to ask: My Bitcoin cost is around 60,000. I want to wait until Bitcoin rises to 120,000 this year to double my investment and sell half, then gradually dollar-cost average during the bear market. What do you think?
I asked again: Do you have a plan B now? For example, if this year it doesn't reach 120,000, do you have a backup plan? Will it affect your future dollar-cost averaging plan?
A friend continues to respond: There is no plan B, and now the main concern is that there won't be enough funds for bottom fishing.
I said: Since your priority is to have enough funds for bottom fishing, why not consider starting to sell in batches slowly now (around 100,000 dollars), rather than continue to risk being uncertain while waiting for greater potential profits, unless you are willing to bear this risk (i.e., during a bear market you may face the problem of not having enough funds to bottom fish).
1. How to judge possible market trends based on data/indicators
In the previous article (May 14), we have sorted and shared some reference dimensions for long-term and medium-short-term price trends. By judging from different dimensional data, we can try to respond to the upcoming market trends as rationally as possible to avoid excessive emotional influences.
After the article was published, a few friends left messages in the background asking: Do I need to learn and understand all the indicators you listed?
Actually, there is no standard answer to such questions, whether to understand those indicators, or which indicators you need to understand... This does not seem to be decided by me, but by each individual. I merely share what I know and have seen regarding some indicators. As we mentioned in the article: different investment cycle plans and different risk preferences correspond to different investment styles, and different investment styles require various information or indicator dimensions as auxiliary references.
Here, we continue to take the open interest (Open Interest) data mentioned in the article as an example. This is one of the better medium-short term reference data, as it can help us analyze the potential next steps of whales (including institutional investors) to a certain extent. As shown in the chart below (from alphractal).
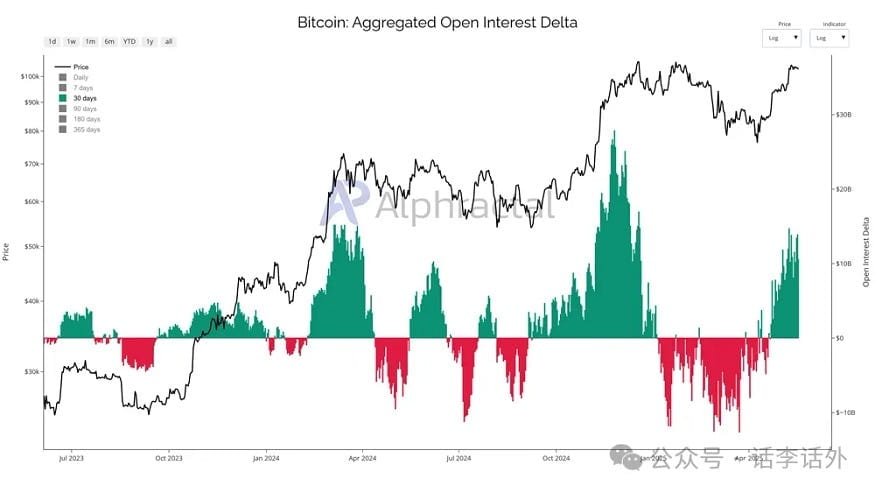
From the above chart, we can see that the accumulated open interest Delta value for the past 30 days (i.e., the overall sensitivity of all open options contracts in the market to changes in the underlying asset price) has now returned to the level of 2024, when Bitcoin set a historical high of $73,000.
If we continue to analyze according to historical patterns, we are currently in a relatively strong growth phase (i.e., positive Delta value), but we may then experience a nearly inversely proportional decline phase (i.e., negative Delta value), thus forming a periodic cycle pattern with certain rules.
Let's expand the time scale and compare the accumulated open interest Delta value over 180 days, as shown in the chart below (from alphractal).
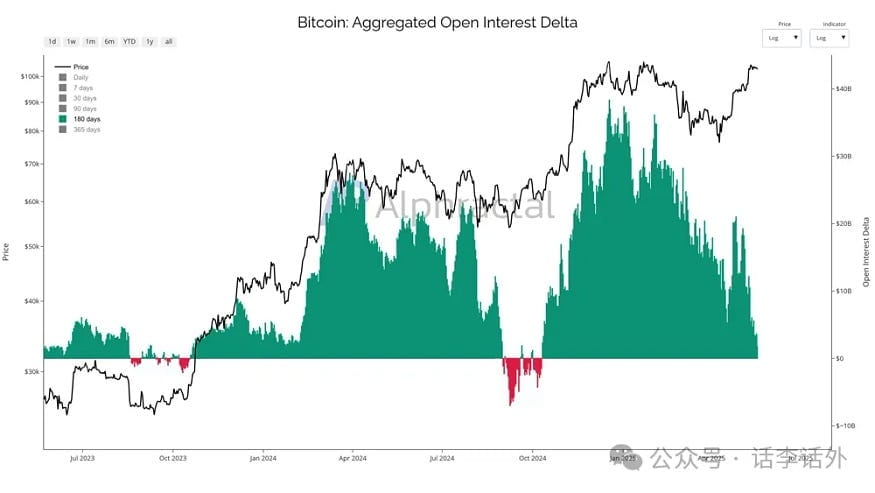
Through further comparison of the above chart, we will find a new interesting point: we are currently experiencing a new downward 'curve', which usually indicates that excessive leveraged positions seem to be undergoing large-scale liquidation. In simpler terms, those highly leveraged positions seem to be suffering significant losses or even being forcibly liquidated due to market fluctuations, and once the Delta here turns negative again, the market may re-enter a new bottoming range or a new accumulation area.
In summary, we can briefly conclude that, based on the recent 30 days of Open Interest data, we should continue to see an upward trend in the market, and this trend may continue for another 1-2 months. However, looking at a longer time dimension, such as starting from the third quarter of this year, we may experience a new decline or consolidation phase. After the decline or consolidation phase ends, we may see another wave of new opportunities before the end of the year.
This seems to confirm the two previous opinions online:
Some believe that the market will usher in new phased opportunities in the second quarter of this year, and Bitcoin may once again touch or break its historical high. From the current market situation, this outcome seems to be very close.
Some believe that by the end of this year, the market will usher in new phased opportunities, and Bitcoin will once again break its historical high.
As for whether Bitcoin will successfully break its historical high in the next 1-2 months, or whether it will really rise to 150,000 dollars by the end of this year, we do not know. We cannot accurately predict it, nor will we provide specific trading guidance. Here, we still say the old saying: You can combine some indicators you think are useful for comprehensive auxiliary judgment, and then make the choice that feels most comfortable for your own position allocation and risk preference.
2. Data/indicators need to be combined with project fundamentals and macro factors
Currently, there are many indicators on-chain, for example, we have organized more than 35 types in the (Bitcoin Indicator Template Table), and various indicators are mostly an intuitive reflection or inference based on historical data, especially for medium-short term market trends. If you want your judgment to be more reasonable or meaningful, then in addition to some necessary indicators, you may also need to combine project fundamentals and macro factors with more comprehensive considerations.
For example, regarding the market since last month (April), BTC's price has approached its historical high again, ETH's price has also made some people take notice, and some other altcoins have performed quite well in terms of price.
However, from the perspective of the development of the cryptocurrency market itself, we do not seem to have seen any new innovations or disruptive changes within the crypto market recently (perhaps we just haven't seen them yet). Therefore, the recent increase in the phased market seems to benefit more from improved macro conditions, including:
- On April 9, Trump announced a suspension of new tariff policies for most countries for a period of 90 days.
- The U.S. and the UK reached a new trade agreement in early May and stated that more agreements would be announced soon.
- On May 12, China and the U.S. announced a new agreement and decided to suspend reciprocal tariffs for 90 days.
Of course, such news we see is actually already the last to know, but capital is often very sensitive and usually quite averse to macro uncertainties. Therefore, whether you like it or not, in terms of the current cryptocurrency market, it seems to be very dependent on changes in macro conditions.
If the improvement in macro conditions can be combined with some positive changes in the project's fundamentals, then the reasons for 'pulling the market' may be more sufficient. For example, ETH's significant rise this month, in addition to benefiting from the improvement in macro conditions, may also be due to the Pectra upgrade event (May 7) and the further review expectations for spot ETF pledges (news emerged in early May that BlackRock and the SEC had discussed issues such as ETH pledging), and ETH is flowing out of exchanges in large amounts (outflows usually indicate that investors are increasing their holdings and have more confidence in the asset, as shown in the chart below).

Note: The above chart shows the heatmap of altcoins flowing out from Binance, with red indicating altcoins with large outflows. It can be seen that currently, the top outflowing altcoins include ETH, ENJ, SLP, FET, etc.
Although there are improving aspects in the current macro conditions, we continue to face some areas that need improvement or unknown issues, including: the Russia-Ukraine conflict seems to remain in negotiation stages, small-scale conflicts between India and Pakistan may re-emerge, the Federal Reserve's interest rate cut issue remains unresolved, and the possibility of a recession in the U.S. economy still appears relatively high... and so on.
At the same time, the overall sentiment of retail investors in the cryptocurrency market currently gives me the feeling that it does not seem to have the same frenzied atmosphere as seen in previous bull markets. Although during the time when Trump launched the token (TRUMP token) at the beginning of this year, it seemed to have that familiar flavor, but it still feels a bit lacking.
In short, the current overall market has shown new signs of improvement, but it seems to rely more on the temporary improvement of macro conditions and the driving force of large funds (or the overflow of traditional funds). Although the current cryptocurrency market looks indeed happy compared to the market in February and March this year, we still need to pay attention to potential changes in macro conditions, while also not ruling out the possibility of new black swan events.
What we need to continue thinking about is, under the existing conditions, how long can Bitcoin's bullish trend be maintained? Will this round of bull market really last until the end of the year?
Of course, if your target plan is for the next 5-10 years, and you believe that Bitcoin will rise to 200,000, 300,000, or even 500,000 dollars in the future, then all you need is to continue to be patient. You can continue to buy Bitcoin in batches at any time, and you don't have to pay too much attention to current short-term price fluctuations. Although many people say that in the next bear market Bitcoin will drop to 50,000 or even 30,000 dollars, that is not the most important thing. What matters is whether you will still buy Bitcoin at that time (whether you dare) and whether you will have enough funds to buy Bitcoin.