25/05/18 BTC has been in high-level oscillation for 9 days, the weekly chart basically shows a doji star, and the 4-hour chart shows another bottom divergence.
Emergency update: Bitcoin has shown some abnormal short-term signals. The probability of a doji star on the weekly chart is quite high. The daily chart shows a top divergence, but it has maintained a high-level oscillation for 9 days. However, the 4-hour bottom divergence can still lead to a rise. This wave of rise is mainly led by large institutional funds, and not many retail investors have actually entered the market; many who are afraid of heights have exited early.
The view on the US markets will not change. Completing the bat pattern is also close to the previous high, indicating a high probability of pullback. The large shorts and the reduction or liquidation of shares by figures like Buffett, along with Moody's downgrade of the US sovereign credit rating, means the US has completely bid farewell to the top AAA credit rating club. Also, there are significant sell-offs of US Treasury bonds by the Eastern Rabbit and others. Therefore, while there are risks at key positions in the US markets, there are no short signals yet, and with gold also pulling back recently, whether Bitcoin will serve as a safe haven is worth looking forward to. The probability of a price change next week is very high.
Bitcoin
Bitcoin has been in a narrow range for 9 days at a high position. The daily chart shows a top divergence, but the downward movement is limited while the 4-hour chart shows a bottom divergence with still some upward momentum. Therefore, I remind friends who want to short to wait. A significant upward spike and pullback must occur. Secondly, for those holding physical assets, they should still aim for a short-term upward push before taking positions at the 78000 long position. Short-term traders can take quick profits, and although it hasn’t fallen, there might still be a pullback, but it’s best to wait for a better entry point.
The pullback on the weekly and monthly charts is undoubtedly bullish. The daily MACD shows a top divergence, with the fast and slow lines crossing. If the histogram continues to turn red, attention should be paid to the rebound. The EMA has been directly rebounding between EMA7 and EMA13, which is still quite strong as seen from the volume contraction.
Support: 95800—97800—100000
Pressure: 110000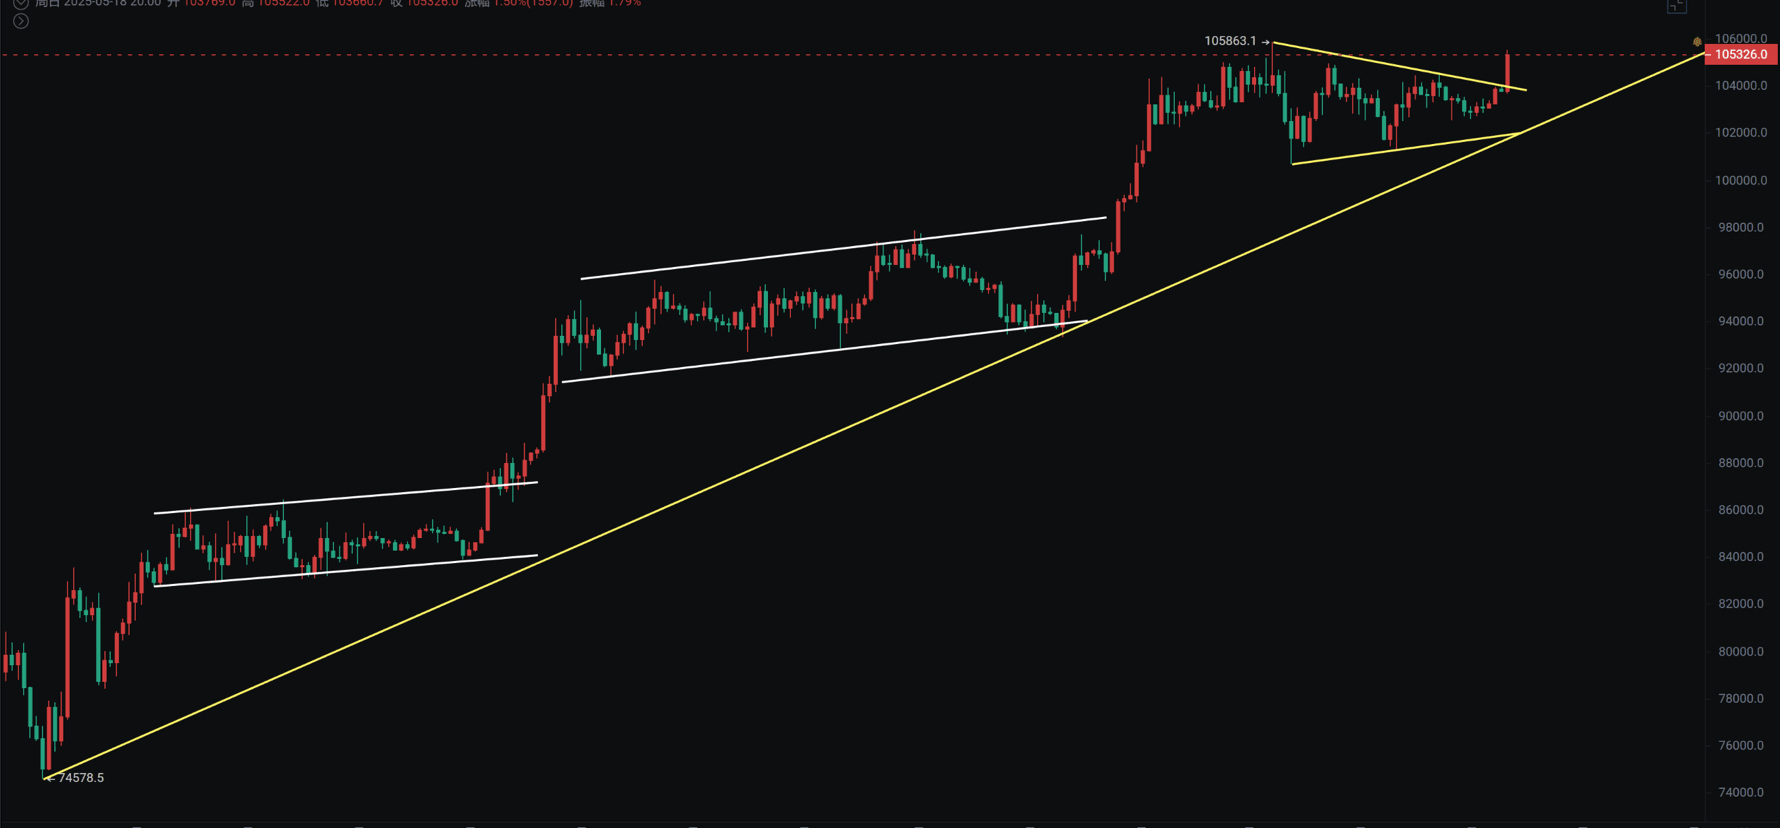
Ethereum
The 4-hour ascending channel has broken down and is currently testing the channel resistance for a rebound. If it can return to the channel, the upward trend will continue.
In terms of knockoffs: SOL, STX, DOGE, FLOKI, SUSHI can be focused on
Support: 2000—2268—2445
Pressure: 2856—3200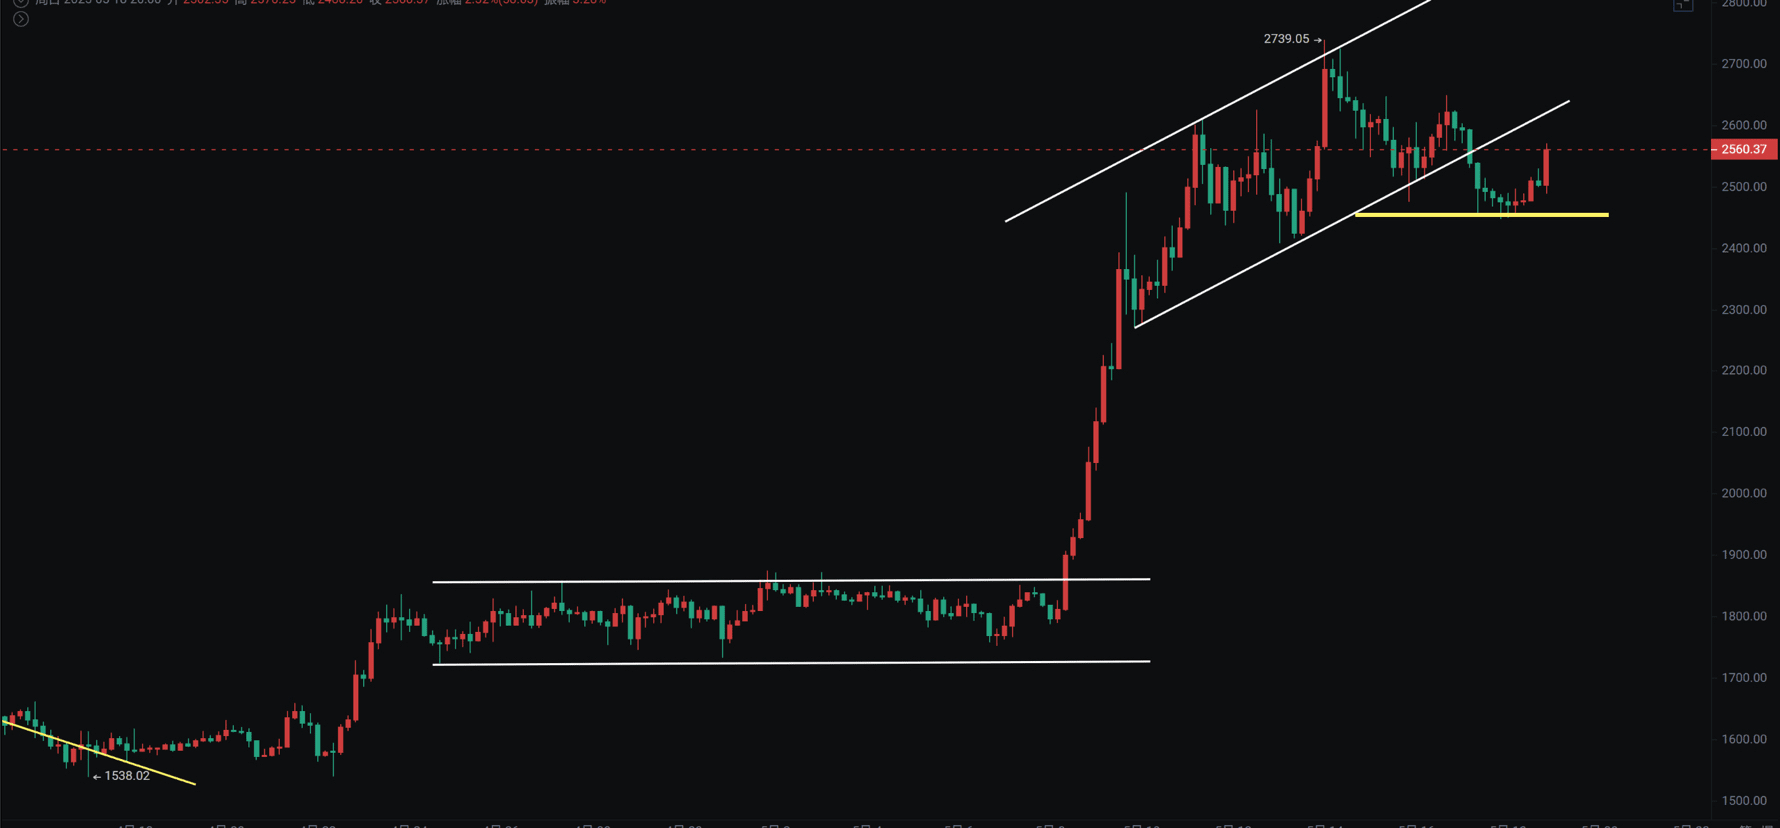
$BTC $ETH $SOL #MichaelSaylor暗示增持BTC #山寨季何时到来? #币安AlphaSUI生态交易竞赛


