
Bitcoin has returned to the lead position. After reaching $74,652 earlier this year, BTC has recovered in a V-shape and is now above $104,000 and heading towards $109,427. This technical pattern – a sharp decline followed by a strong recovery – is a sign of strong confidence in the market and often precedes major bull runs.
Since crossing the 50-day EMA line ($94,870), Bitcoin has been on a strong upward trend with higher lows and accumulation. Although there are some warnings from momentum indicators, particularly the MACD showing diminishing bullish volume, the price structure remains good. This recovery is also accompanied by institutional inflows and broader optimism about the cryptocurrency market.
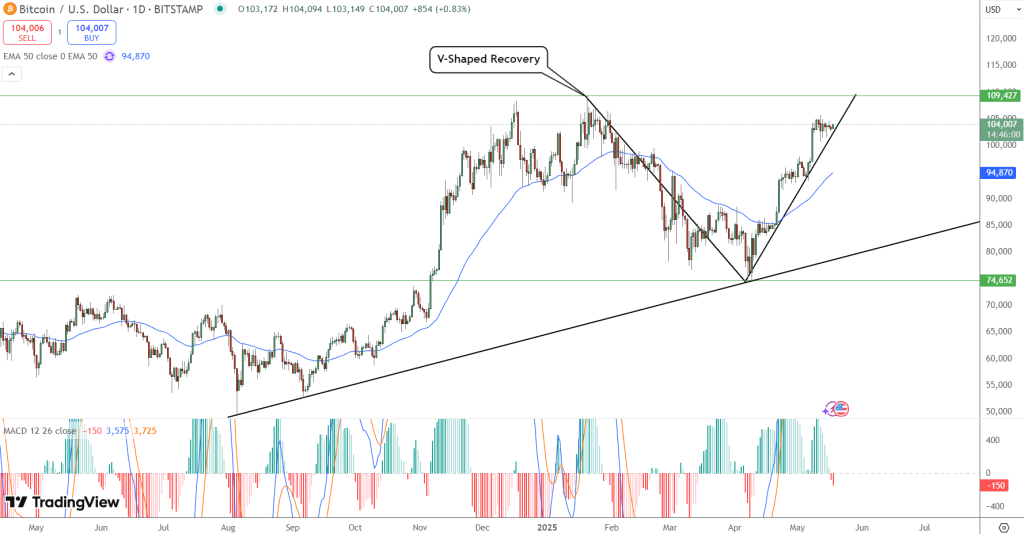
Highlights of V-Recovery:
Recovery from $74,652 to over $104,000
Has reclaimed the 50-day EMA at $94,870
The target is $109,427
Bitcoin Analysis – The Breakout of the Symmetrical Triangle
Bitcoin price predictions seem optimistic in the long run, although short-term analysis shows hesitation. On the 1-hour chart, BTC is coiling in a symmetrical triangle – a hesitation area often preceding major breakouts. At $104,007, the price is pressing against the upper resistance and the horizontal barrier of the triangle at $104,550.
Technically, Bitcoin looks good beneath the surface. The MACD has turned green, the 50-period EMA ($103,421) is acting as support, and recent candles show increasing buying pressure and higher lows.
If the bulls can confirm the breakout with a strong 1-hour candle above $104,550, BTC could quickly rise to $105,668 and possibly $106,685. However, if there is no clear breakout, the price may revert to $103,000 or $102,700 before the next attempt.
Is Bitcoin About to Reach $120,000? Macro Momentum is Building
With Bitcoin's V-recovery and increasing technical pressure, all attention is now focused on $120,000 – a psychological target and Fibonacci extension if BTC cleanly surpasses $109,000. Short-term resistance must be respected, but long-term sentiment is becoming optimistic.
The broader setup is also optimistic:
According to on-chain data, whale accumulation is increasing
ETF inflows are strong
Institutional sentiment is shifting from caution to opportunity
Conclusion
Bitcoin looks good on both the daily and 1-hour charts. Technical factors have come into play and sentiment is improving. $120K is not an unreachable target if the buyers can surpass $104,550.