1 What are Banner cycles?
Banner cycles are a chart of market cycles from 1872 to 2059, predicting business development and changes in raw material prices. It is based on periods of greatest activity in the metal markets (cast iron) and yield (corn, pork, cotton). The principle is simple: the better the situation in metallurgy and agriculture, the more confident business feels overall.
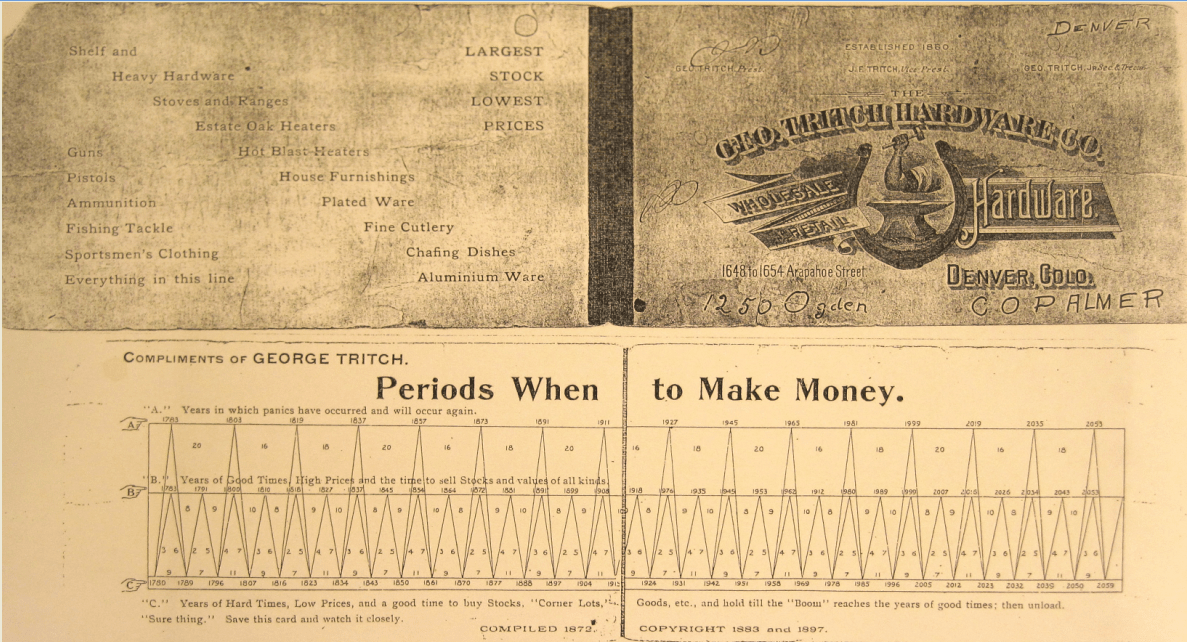
The chart 'Periods When to Make Money' was created back in 1872 by businessman George Tritch. However, this hypothesis gained widespread recognition thanks to an Ohio farmer, Samuel Banner, who published the book 'Banner's Prophecies of Future Ups and Downs in Prices' in 1875.
2 How to use Banner cycles?
The Banner-Tritch cycle chart consists of three horizontal divisions: A, B, C.
Level A. Periods of greatest panic and uncertainty in the markets with alternating peaks every 16–20 years. It is recommended to stay out of the market or take conscious risks here.
Level B. Years characterized by economic activity and high prices for raw materials and assets. Banner indicated that it is best to sell during this time. Cycles alternate every 8–10 years.
Level C. A good time to buy assets and goods. During this period, it is recommended to hold the asset until the years at level B. Level C cycles occur every 7–11 years.

According to Charles Edwards, founder of the investment company Capriole Investments, testing the model showed a 91% success rate in trades. The strategy also accurately identified the peaks of major crises, including 1929, 1999, 2007, and 2020. The data was verified on the Dow Jones index.
Edwards, known for developing the indicator for determining the global price bottom of Bitcoin, Hash Ribbons, came to the following conclusion:
"Market cycles repeat. Even though times, technologies, markets, and regulations have changed significantly over 150 years, market cycles have remained the same."
3 How to apply cycles to cryptocurrencies?
The crypto market is still very young, and its price data is insufficient for testing on such global models as the Banner-Tritch cycles. But considering that Bitcoin has gained worldwide recognition in financial markets, one can consider digital gold as a raw material, like cast iron.
In this case, the model showed that the first cryptocurrency should have been bought in 2012, holding it until 2016 with a peak of panic and uncertainty in the global market in 2019. Even this historical data showed similarities with the price movements of Bitcoin.
The next conditional signal to buy the first cryptocurrency is given for the year 2023 with a plan to hold the coins $BTC until 2026.
Another 'good' year for buying is set for 2032 with the goal of holding the asset until 2034 and with overall panic in the markets in 2035.
Interestingly, some analysts arrive at the assessment of Bitcoin's price growth prospects using completely different data and metrics. For example, CMCC Crest co-founder Willy Woo noted that by 2035 the 'fair price' of Bitcoin will reach $1 million. He used the user growth curve as data for assessment.
CEO of ARK Invest Cathy Wood, although she did not 'hit' the Banner-Tritch model, also predicts a strong growth cycle for Bitcoin. According to her scenario, the first cryptocurrency could reach a price of $258,500 to $1.5 million by 2030.
Thus, many analysts expect a strong momentum in the cryptocurrency market in the next decade for various reasons, as suggested by the above-described model of cycles from a century and a half ago.
