One, Core Trend Judgment
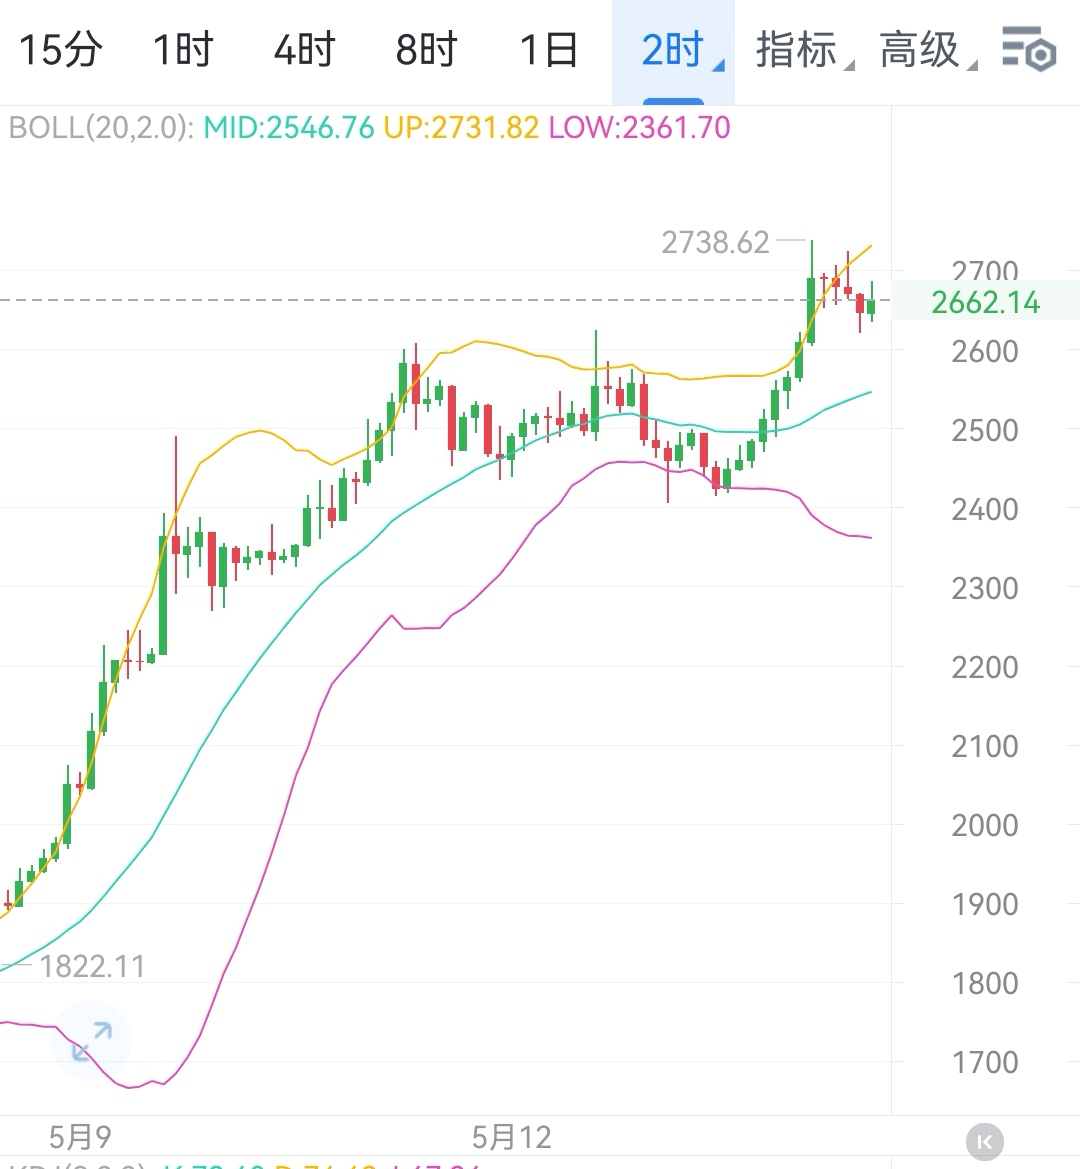
Currently, Ethereum is in a 1-hour corrective phase, with 2612 becoming a key watershed for intra-day bullish and bearish trends. This level will determine the subsequent trend through the 2-hour candlestick formation: if the 2-hour closing price firmly stands above 2612, it indicates that bullish forces dominate, and after the correction ends, an upward trend is likely to continue; if it breaks this price level, bearish momentum will strengthen, and the market will enter a 2-hour corrective cycle.
Two, Key Price Level Analysis
Resistance Level
- Short-Term Resistance (2691): This is the first barrier for bullish counterattacks; once broken, the price will explore higher ranges.
- Medium-Term Strong Resistance (2737): As a strategic point fiercely contested by bulls and bears, if successfully breached, it will further confirm bullish advantages.
- Important Threshold (2768): This price level is a key turning point for market sentiment; a breakout may lead to accelerated price increases.
Support Level
- First Defense Line (2555): An important buffer zone during bearish pullbacks; if effective support is formed, it will temporarily alleviate downward pressure.
- Key Support (2490): Once lost, market bearish sentiment may intensify, expanding the pullback range.
- Ultimate Support (2420): The last support level in extreme market conditions; if breached, it may trigger a deep adjustment.
Three, Trading Strategy
Bullish Strategy
When the 2-hour candlestick closes above 2612 effectively, one may enter a long position. To prevent the risk of false breakouts, set the stop-loss below 2600. The take-profit targets are as follows: first target 2691; if broken successfully, look towards 2737; if the price continues to break strongly above 2737, it may challenge 2768.
Bearish Strategy
If the 2-hour closing price falls below 2612, it is recommended to try shorting. To avoid short-term rebound risks, set the stop-loss above 2625. The take-profit targets are as follows: first target 2555; if it continues to break down, look towards 2490; in extreme cases, one may consider looking towards 2420.
Four, Summary and Risk Warning
The 2612 level is the core indicator for today's Ethereum market, and the closing situation at the 2-hour level directly determines the trend direction. Everyone must formulate a trading plan around this key price level, strictly implement stop-loss and take-profit strategies, and avoid blindly chasing highs and lows or emotional trading. Near support and resistance levels, one should flexibly adjust positions based on real-time market fluctuations, changes in trading volume, and sudden news, being alert to the risks brought by the main funds' wash trading actions and unexpected market movements to ensure that trading risks remain within a controllable range.$ETH #ETH走势分析