For traders who rely on technical indicators, the Relative Strength Index (RSI) is a powerful ally. But scanning RSI values across hundreds of coins can be time-consuming—until now.
Introducing RSI-Crypto.com: a 100% free RSI heatmap, scanner, and dashboard designed to help you track market momentum across 500+ cryptocurrencies listed on Binance—all in real time.
🚀 Key Features:
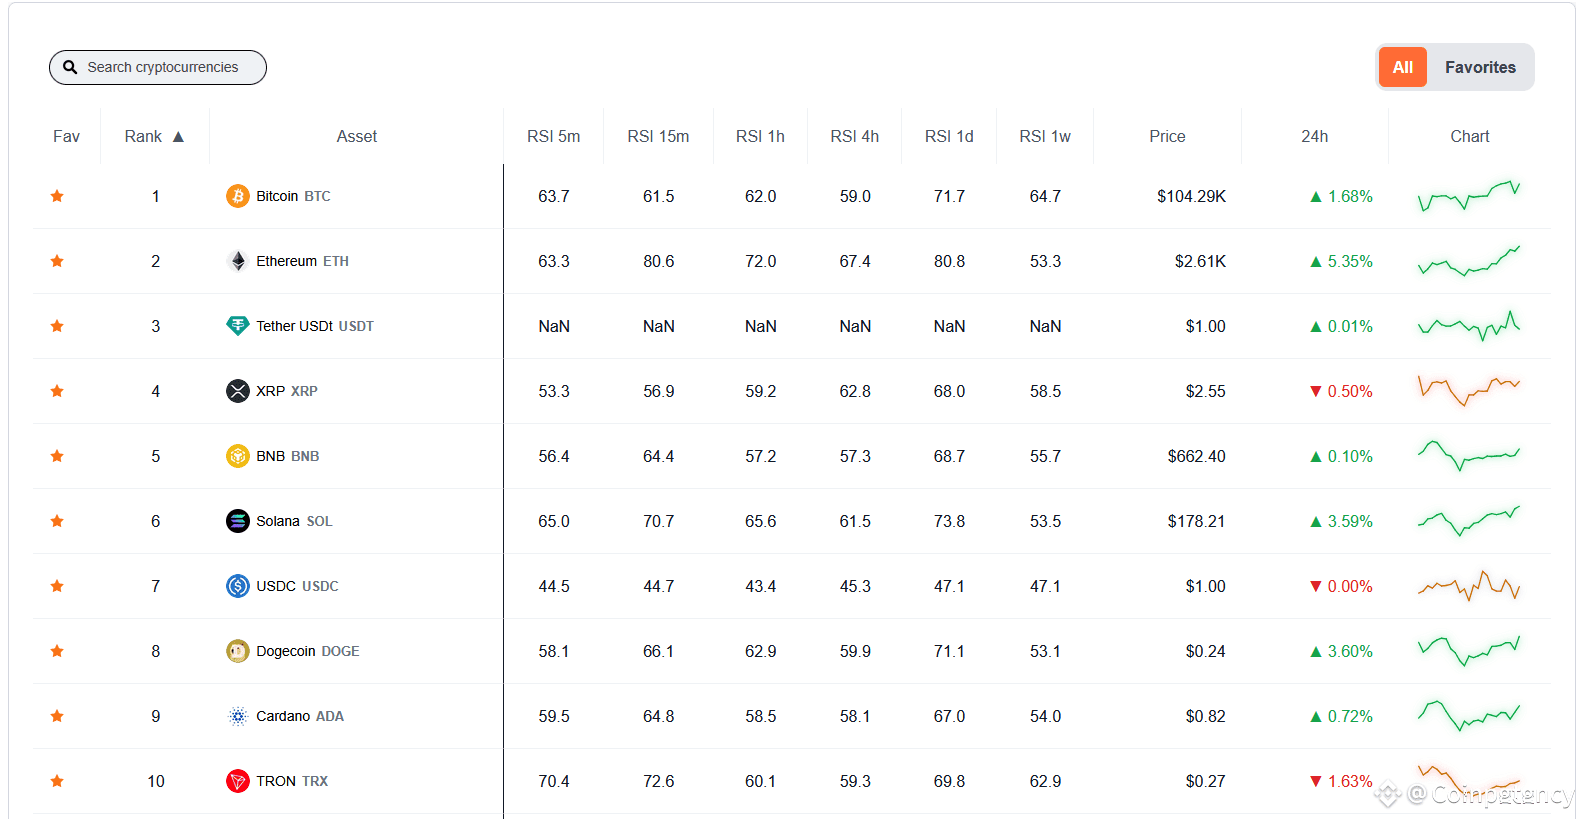
Real-time RSI values across multiple timeframes: 5m, 15m, 1h, 4h, 1d, 1w
Filter by rank, RSI range, or sector tags
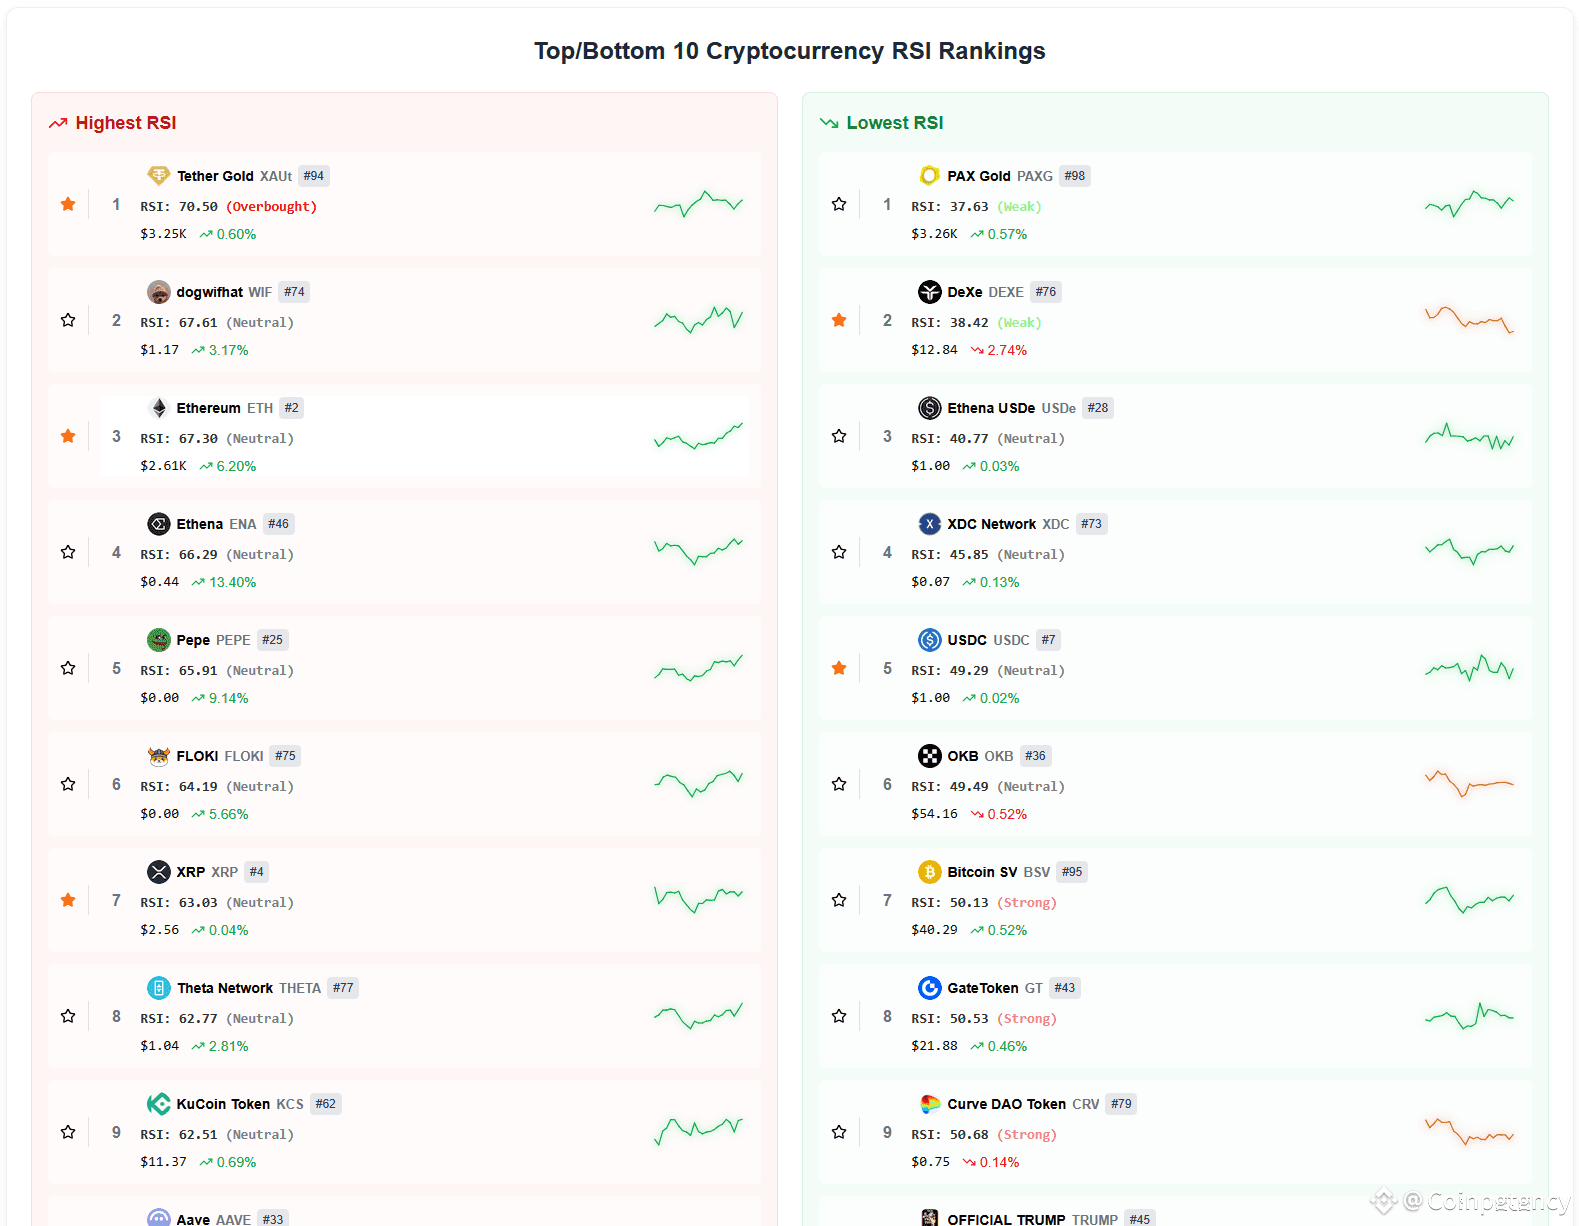
View top overbought/oversold assets instantly
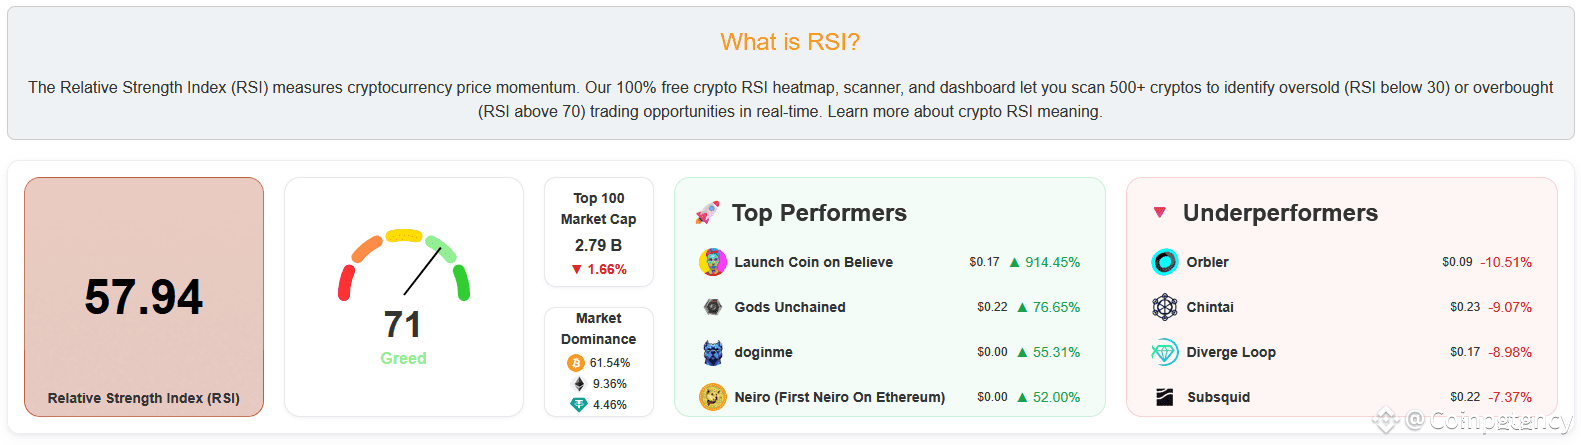
Market sentiment gauge based on global RSI averages
Completely free. No login, no wallet connection, no ads.
🧠 Why Use It?
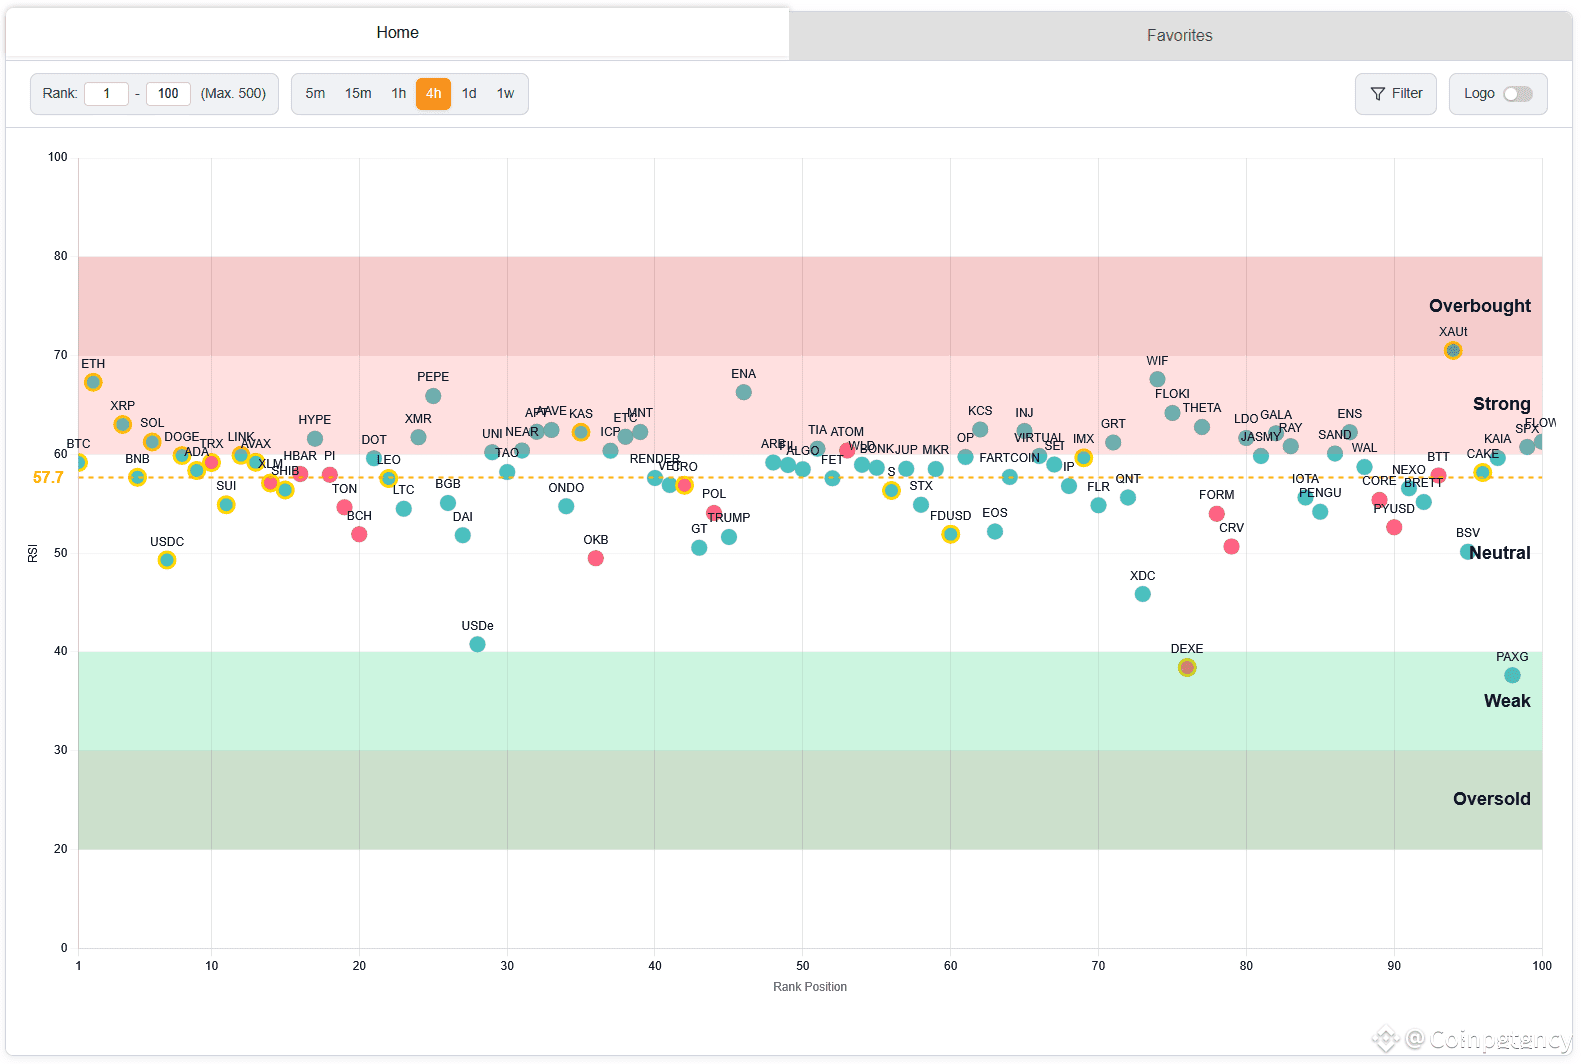
Whether you're a day trader or long-term investor, this tool gives you a clear snapshot of where the market stands—now. Spot coins entering overbought territory (RSI > 70), or search for those in oversold zones (RSI < 30) that may present buying opportunities.
Examples (as of writing):
Monero (XMR) shows a daily RSI of 86 – possibly overextended.
DeXe (DEXE) is hovering near RSI 30 – could it be due for a bounce?
You can also monitor the average RSI across the Binance market to assess risk sentiment and avoid entering at euphoric peaks.
🔗 Try It Here:
👉 RSI-Crypto.com
Designed for speed, simplicity, and efficiency—perfect for Binance traders who want to make data-driven decisions fast.


