Combining the daily, four-hour, and one-hour charts, DOGE has risen nearly 70% in a row, with obvious signs of a short-term pullback. Multiple overbought signals have appeared technically, and the timing for bearish positioning is approaching! Below is a detailed cycle analysis and tactical strategy configuration.
I. Technical Analysis
Daily chart (1D): Extreme increase, initial divergence: Since the low point of 0.15 in April, the daily level has skyrocketed to 0.25973, with a cumulative increase of over 70%;

MACD at a high level is becoming blunt, RSI has entered a severely overbought zone;
The upper shadow's increasing volume indicates a weakening bullish momentum, with selling pressure at high levels appearing;
Four-hour chart (4H): The trend is too steep, deviating from the moving average constraints, with the candlestick far from MA30, showing a strong need for a pullback;

After a volume increase, a decrease and pullback occur, revealing the early signs of a topping structure;
The candlestick closes with a downward shadow, indicating insufficient momentum for a rise, and bearish strength begins to permeate;
One-hour chart (1H): Clear topping signals: Two consecutive candlesticks with highs followed by declines, with increased volume stagnation;
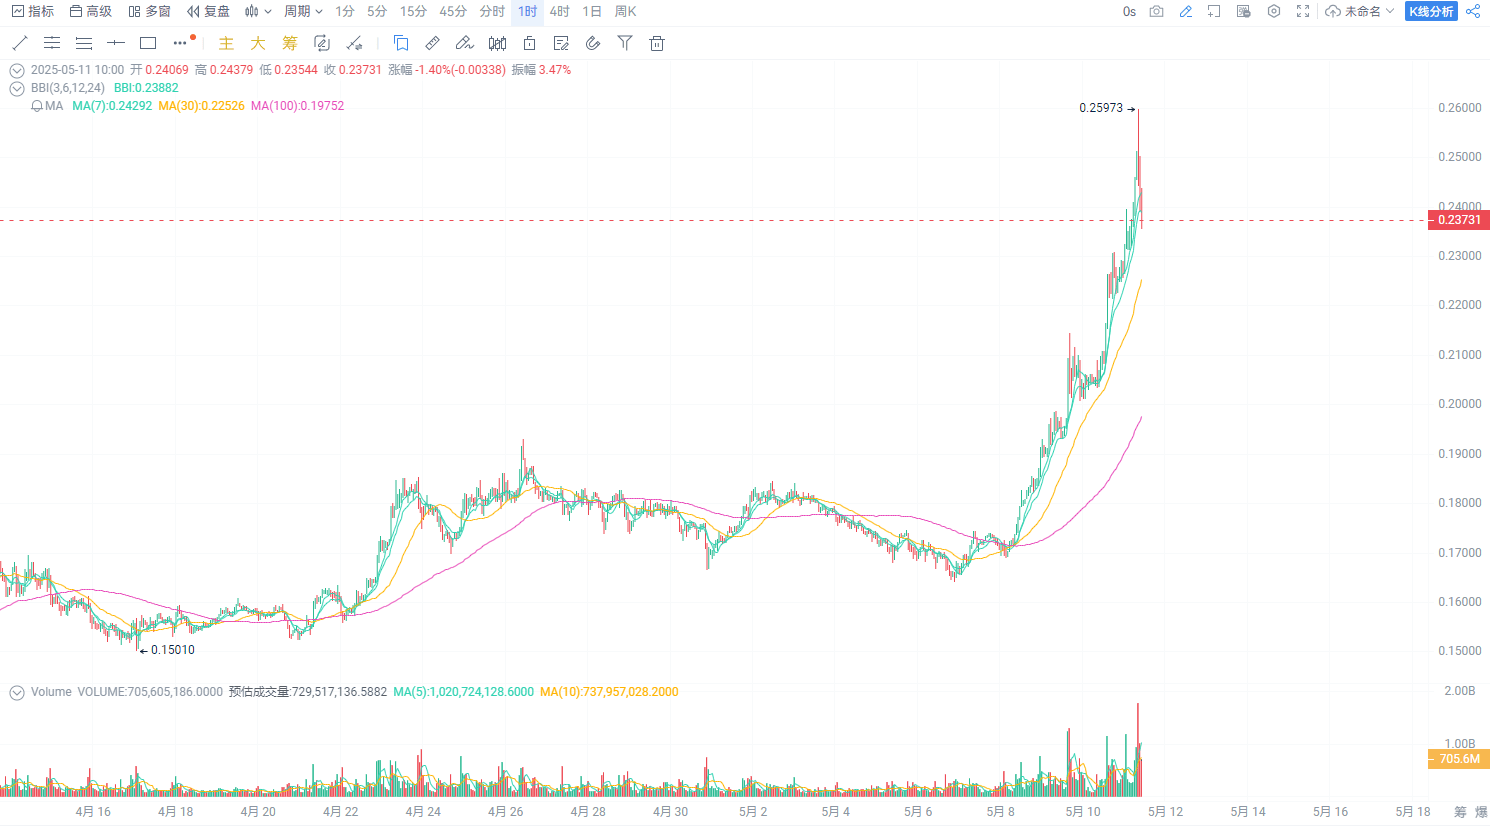
The price high of 0.25973 becomes the stage peak, followed by a continuous pullback;
If the short-term rebound does not exceed around 0.242, it will become an ideal area to enter short.
Opening position: 0.239–0.242 range
First take profit level: 0.2334 USDT
Second take profit level: 0.2311 USDT
Stop loss level: 0.2418 USDT


