
Optimism (OP) is capturing attention as it breaks out of a 14-month-long falling wedge pattern, a bullish indicator suggesting a potential upward trend.
---
🔍 Technical Overview
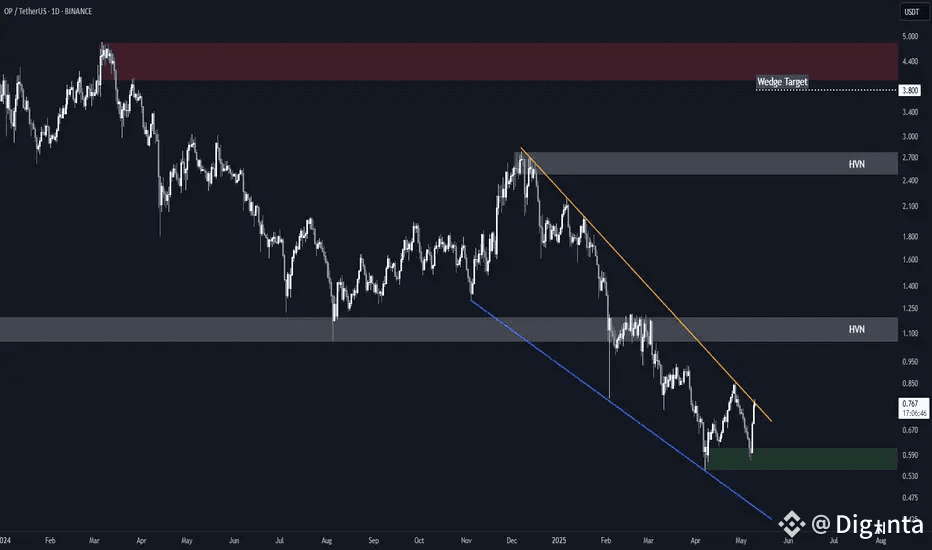
Pattern Formation: OP has been trading within a falling wedge since December 2023, characterized by converging downward-sloping trendlines.
Breakout Confirmation: A decisive move above the wedge's upper boundary, accompanied by increased volume, confirms the breakout.
Key Support Levels:
**$0.55–$0.60:** Primary demand zone and invalidation point.
**$1.00–$1.20:** High-volume node and significant support/resistance area.
Resistance and Targets:
**$2.50–$2.80:** Previous high within the wedge, potential resistance.
**$4.00–$4.80:** Main supply zone, aligning with historical resistance levels.
---
📈 Trading Strategy
1. Entry Point: Consider entering upon confirmation of the breakout above the wedge's upper trendline, ideally with increased volume.
2. Stop-Loss Placement: Set a stop-loss below the $0.55–$0.60 demand zone to manage risk.
3. Profit Targets:
Target 1: $2.50–$2.80
Target 2: $4.00–$4.80
4. Risk Management: Adjust position sizes according to your risk tolerance and trading plan.
---
📊 Market Sentiment
The breakout from the falling wedge pattern indicates a shift in market sentiment from bearish to bullish for OP. This move is supported by increased trading volume and positive momentum indicators.
---
Stay updated on OP's performance and consider this breakout as a potential opportunity, keeping in mind the importance of thorough analysis and risk management.
---