

Introduction
Recently, BTC broke through the resistance range, but the subsequent trend did not continue and quickly fell back, forming a typical false breakout structure. Although it pulled back again during the fluctuation, the continued divergence between spot and contract CVD shows that market funds are more inclined to release risks on the leverage side. Although ETH has healthy data support, its structural performance still leans towards consolidation and lacks a clear direction. At the same time, targets such as TURBO and LINK also show false breakouts and whale transfer signals. The overall market is in a stage where bulls and bears are intertwined, making it easy to be misled in the wrong direction. Operations need to pay more attention to details and rhythm.
USDT Market Share

Last week, USDT.D was mentioned, explaining its negative correlation with BTC, and reminded that the pullback of the USDT.D channel could likely impact Bitcoin's decline. Currently, USDT.D is indeed undergoing a pullback after breaking down, and I will wait for the pullback to complete before making a bullish layout for BTC.
Bitcoin
MicroStrategy buys BTC

On April 28, 2024, Michael Saylor announced on X (Twitter) that MicroStrategy purchased a total of 15,355 BTC this week (average price 92,737).
Currently, MicroStrategy holds 553,555 BTC (average price 68,459)
On-chain operation records: related link
BTC Market Analysis

From the daily structure, the BTC short pullback position mentioned last week (Fibonacci retracement 0.382) and the POC of the previous consolidation zone have been touched, showing clear signs of resistance. Based on my experience, the newer the POC, the more effective it is, meaning the first resistance is the strongest. If there is another upward attack in the future, the probability of breaking through is higher.

Contrary to expected trends, BTC slightly broke through the resistance range but did not continue the upward trend and instead fell back. The volatility here is getting smaller, making it less reasonable for trend traders to set up bullish positions. I suggest viewing this as more suitable for range trading.
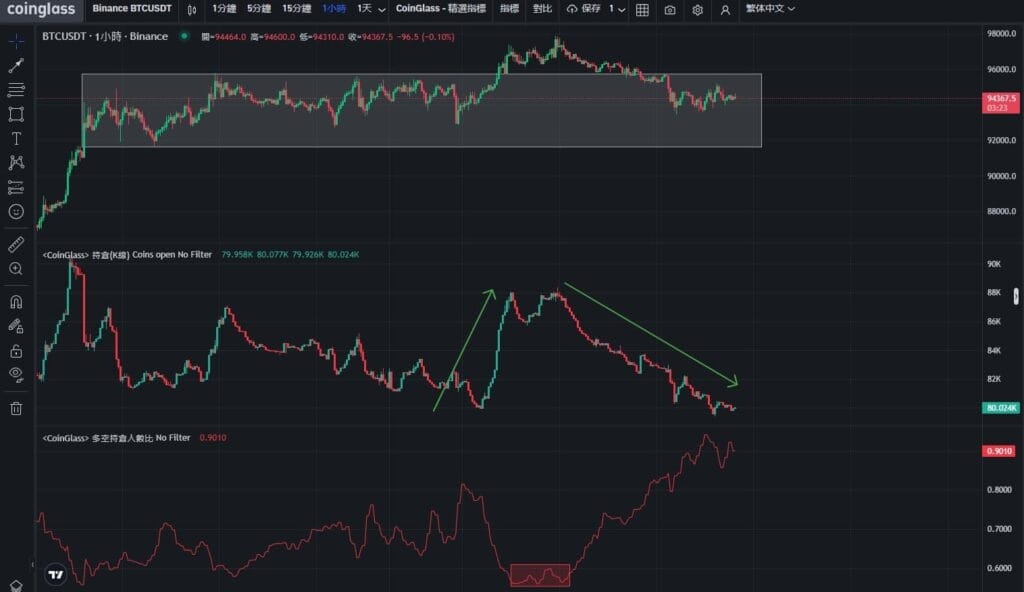
Observing with hourly intervals combined with futures data, the gray box indicates a small consolidation area. The rise in positions accompanied by price increases shows that major funds are on the bullish side, and subsequently break through. However, do not forget the possibility of a 'false breakout' in the range. At this time, we use the long-short ratio for observation, where the red box indicates the long-short ratio is at a relatively low point during this consolidation. Based on my experience, as long as the long-short ratio is relatively low during consolidation, it is what we call a 'bull trap'. Later, it was confirmed that bullish funds gradually liquidated, and the price fell back again, completing a Buy to Sell trend.

Last week's report mentioned the divergence between spot CVD and contract CVD, indicating that current market participants tend to leverage contracts for speculation. Observations suggest that this is due to Bitcoin's reduced volatility after reaching a high. This week's report again reminds that the risk of bullish strategies remains high. When spot CVD shows a clear sell > buy pattern, while contract CVD shows a buy > sell situation, it means the possibility of bullish leverage being liquidated still exists.
In an ideal bullish situation, if the spot CVD gradually shows an increasing pattern (buy > sell) with a longer period of consolidation, it will be more conducive to BTC moving towards higher prices.
Ethereum
ETH Market Analysis

ETH's volatility is much smaller compared to BTC. Initially expected to break through the previous range again, it ultimately faced resistance. Currently, ETH does not have many short or long opportunities, and it is recommended to wait and not act rashly.

Reviewing ETH's performance in spot CVD and contract CVD, ETH's data performance has remained more robust than BTC after a week of consolidation, but currently, there are no better entry points revealed in the price structure. I believe that even if ETH maintains a healthy data appearance, whether there will be opportunities for strong surges in the future still depends on BTC's performance.
Altcoin
Whale address transfers LINK to Binance

On May 2, 2025, multi-signature addresses starting with 0x013, 0xd45, and 0x9e6 simultaneously transferred 170,635 LINK to Binance.
On-chain operation records: related link 1 related link 2 related link 3
TURBO Market Analysis

TURBO is currently a very strong coin, having broken through the previous high (0.003) during the last surge, and has formed a triangle convergence above the previous high. From a bullish trend perspective, the triangle convergence can be seen as a continuation of the uptrend. However, in my experience, convergence under pressure is considered a buildup before a breakout. If convergence occurs after breaking through resistance, I would regard it as a behavior to lure bulls. After all, breaking through means there is no resistance, and if it does not continue to rise, but instead consolidates, the possibility of turnover increases. As expected, this convergence did not serve to continue the trend, but rather followed a classic AMD model before declining.

It is worth noting that in a typical false breakout within a general range, the price usually reverses to the other endpoint of the range. However, in area D, the downtrend formed a downward channel and broke through to become a reversal pattern. At this point, the stop-loss accumulated from shorts in area M will become the ultimate target for this bullish move.
Conclusion
Whether on-chain data, technical analysis, or futures data, all are at a stage of divergence between bulls and bears. Although ETH has a healthier data foundation, from a swing perspective, there is not much information to support the layout of bullish strategies. Coupled with the current divergence performance of BTC in spot CVD and contract CVD indicating bullish risks, I believe that besides spot DCA or simply holding the current spot, it is not suitable to engage in too many operations at this stage.
This report is for informational sharing only and does not constitute any form of investment advice or decision-making basis. The data, analysis, and opinions cited in this document are based on the author's research and public sources and may contain uncertainties or change at any time. Readers should make investment judgments cautiously based on their individual situations and risk tolerance. For further guidance, it is recommended to seek professional advisory opinions.