25/05/06 BTC top divergence pullback, a false breakout appeared on the daily chart. Where is the entry opportunity for the pullback?
The daily upward trend of Bitcoin has been broken, and the price line quickly fell back after breaking through 0.618. Currently, the 4-hour chart is still maintaining the lower channel of the upward channel, which is very critical. If it breaks, it will accelerate the decline.
The three indices of the beautiful valley have all come to the previous M head level, with significant pressure and caution needed here; the opening is low. Gold pulled back 12 days ago, and the last two days rebounded well, once again pulling back to the lower track for a rebound.
Bitcoin
The daily chart shows a top divergence with MACD returning to zero axis. On April 30, I predicted the trend of Bitcoin, and the trend for nearly a week has been quite consistent. Pay attention to several supports at 92222 and 88000—89000 for opportunities.
The daily upward trend of Bitcoin has been broken, and the price line quickly fell back after breaking through 0.618. Pay attention to the support of several moving averages on the daily chart. It is currently in the fourth wave of decline, and we need to grasp whether there will be an opportunity for the fifth wave.
Support: 88000—89000—92222
Resistance: 98000—100000

Ethereum
The sideways consolidation for 13 days has left people confused, tasteless to eat and not worth discarding. The supplementary rise in the market has not materialized. Here, pay attention to the continuous increase in the total market capitalization share of BTC (Bitcoin), which temporarily broke through 65%, reaching a new high since February 2021.
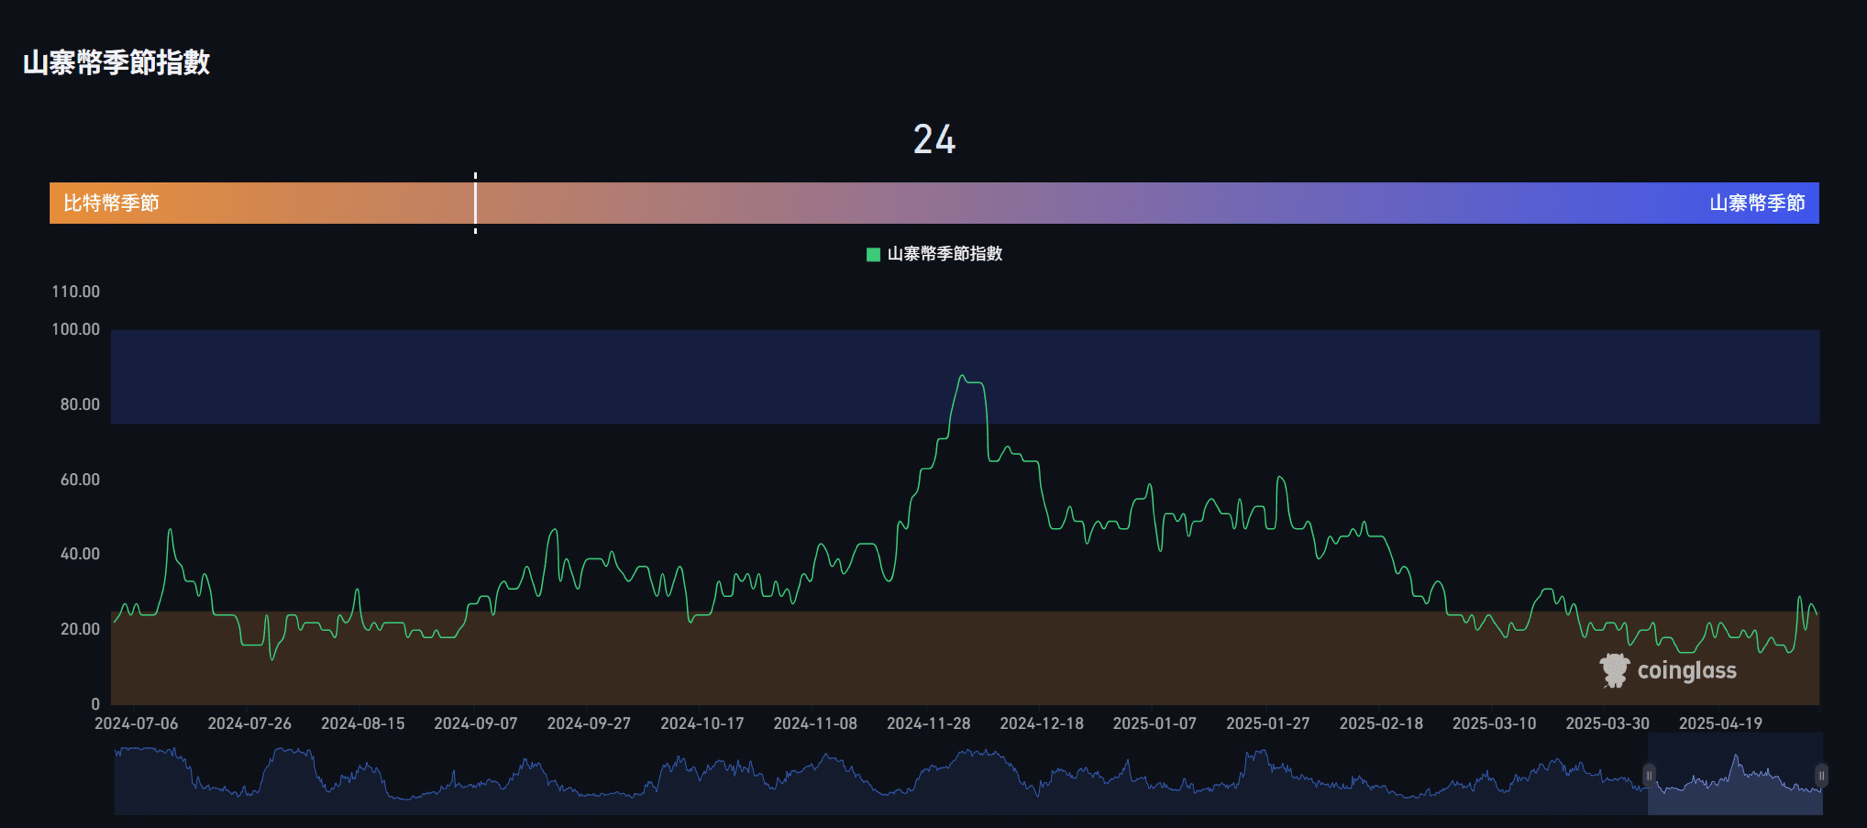
Many people love to say that when BTC D peaks, there will be a pullback and altcoins will take off. This has been said since last year and continues this year. I am more inclined towards a two-tier differentiation in altcoins, and the altcoin seasonal indicator 24 shows a good pullback opportunity for oversold altcoins.