
In a new post on X, analyst Checkmate discussed what Bitcoin looks like based on its Realized Price Distribution UTXO (URPD). URPD is an on-chain indicator that tells us what portion of the BTC supply was last purchased at different price levels that the cryptocurrency has reached in its history. Below is the chart of the data that the analyst shared in the post.
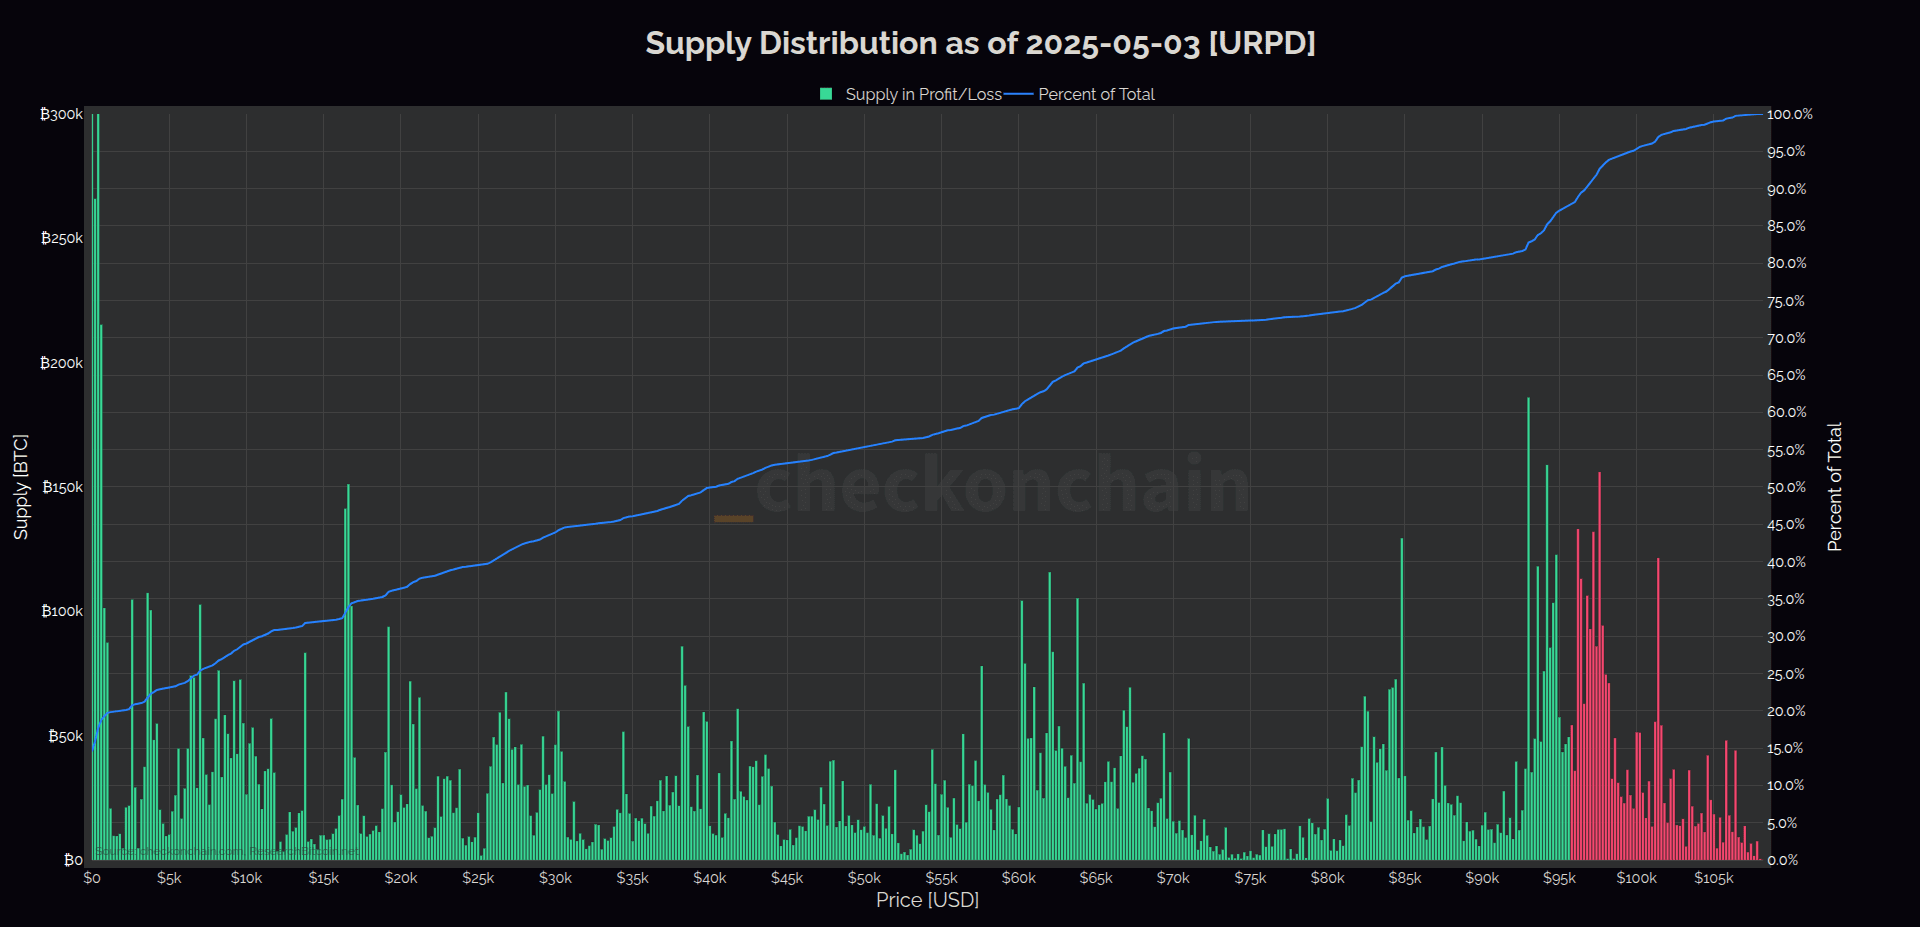
As can be seen in the chart, a significant portion of the Bitcoin supply has been purchased around the price range that BTC has recently traded. In particular, it seems that there are two large supply clusters at these levels.
When Checkmate shared the chart yesterday, the price of the cryptocurrency was trading right between two supply walls. This means that investors who bought at the lower wall are in profit and those who bought at the higher wall are at a loss.
The analyst calls the position of the asset the "exact midpoint of the decision point." This is due to the fact that any large movement up or down from that point will affect the profit and loss status of a large number of addresses.
In chain analysis, the large supply walls below the spot price of BTC are considered potential support positions, as investors who bought there may protect their breakeven point during the retest.
Similarly, the above levels may serve as resistance levels, as holders may take this opportunity to sell their cryptocurrency and recover their entire investment.
Since the post, Bitcoin has experienced a slight pullback, so this asset is now heading towards the green supply zone. It is likely that this area will help prevent BTC from being discounted, considering the large amount of supply purchased within it.
Naturally, its next move could have a significant impact on market sentiment. As Checkmate said, "just one large red or green candle from here is enough to convince people of lower highs or continue bullish."
Bitcoin is currently also near the macro support on-chain: the realized price of short-term holders. As community analyst CryptoQuant Maartunn explained in post X, this level is at $93,364.

The realized price of short-term holders refers to the average cost basis of those holding Bitcoin who purchased their coins in the last 155 days. This level has historically served as the boundary between bullish and bearish trends for BTC.