
The BTC rate exceeded $96,000 today, breaking the local trend line from the high of April 25.
Now is the perfect time to recall the post from April 22, when it was written: 'From this week, BTC will rise without reasons more often than it will fall without reasons. And signals for growth will work out more often than correction signals.'
And the signal for this rise was there; those who use our indicator saw two marks of potential lows on the 4-hour time frame last night.

Plus, this morning the price returned to a stable uptrend on the 30-minute and hourly time frames, having already clearly worked out the basic targets on them.
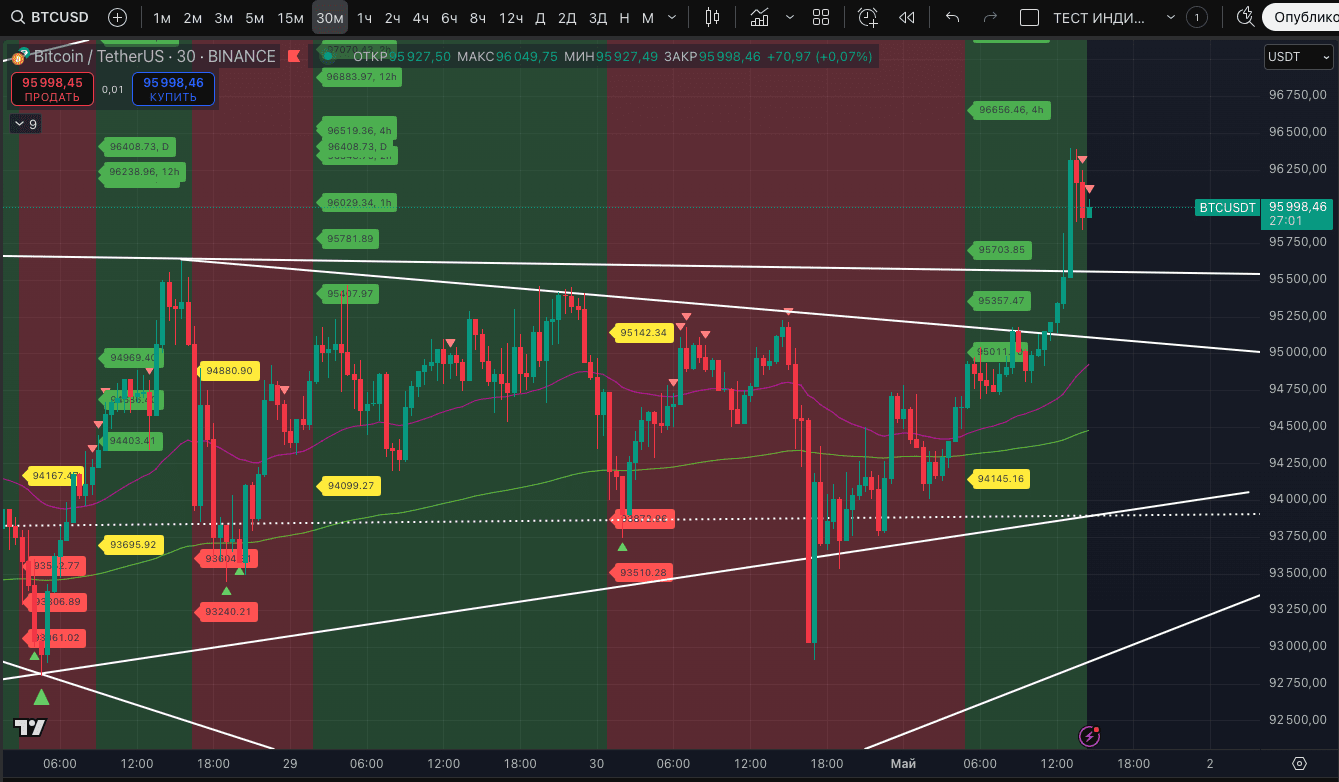

An uptrend transition is likely on the 2-hour time frame, if we do not see a reaction from sellers in the next half hour. The probability of the impulse finishing exists due to the marks of highs on the 15-, 30-minute, and 2-hour time frames.

There are two important points regarding the overall picture since April 21:
1. There is still no reasonable correction of the entire rise since April 21. All the declines that occurred were $93,987 on April 28 and $92,910 on April 30. This is extremely low. Liquidity is gathering below the lows of April 30, April 28, and April 24.
We continue to believe that a correction to the range of $87,000 - $88,000 would be preferable and beneficial for further growth now. But the situation is the same as it has been in recent days - while the price is in an uptrend even on the 15-minute time frame, all discussions about correction are just wishes.
2. Potential high signals on the 12-hour and daily time frames, which have been present since April 23, are under threat of breakdown. Will there be a breakdown? Given that signals on two such time frames should not exist. But if today’s daily candle closes bullish, the likelihood of a breakdown will sharply increase. In this case, we will need to wait for reasonable correction signals from a higher level, looking for its targets from the new high.
Regarding resistances above - now one can only refer to horizontal levels from our P73 Smart Liquidity Zones indicator. On the 4-hour time frame, these are: $96,499, $97,176, $98,079.

Overall, we do not change our expectations - the #BTC rate has reversed. With a high degree of probability, it is preparing for a move to a new ATH in May. The only question is the format and timing of the correction of the impulse rise since April 21.
Currently, the key bullish signal we are waiting for is the price transition to a sustainable uptrend on the 3-day time frame. There have been only four such signals in this cycle, all of which resulted in significant growth. Here’s what the last two gave:
- the signal from October 22, 2023, provided a growth of +147.47% to the peak of the trend,

- the signal from October 21, 2024, provided a growth of +58% to the peak of the trend.
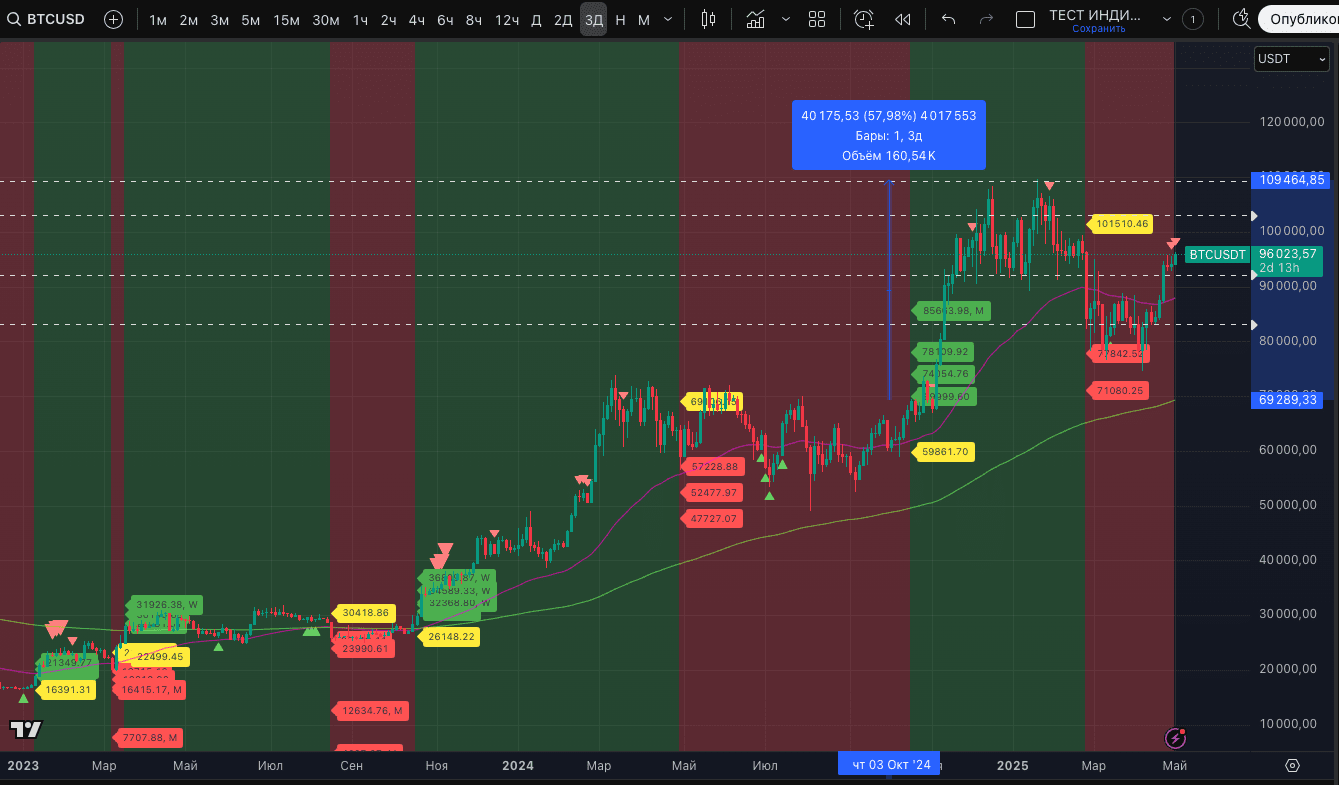
There was no transition last night; we were specifically watching to report the news. Plus, there is a nuance - on the 3-day time frame, there is already a second mark of a high. This leaves room for correction without significant growth from the current levels. The last such mark was on January 28, and after it, the price fell by -28%. BUT overall, in the current cycle, such marks on this time frame have more often been a signal for consolidation before continuing to rise.
