4-hour key level becomes the focus of bullish and bearish contention.
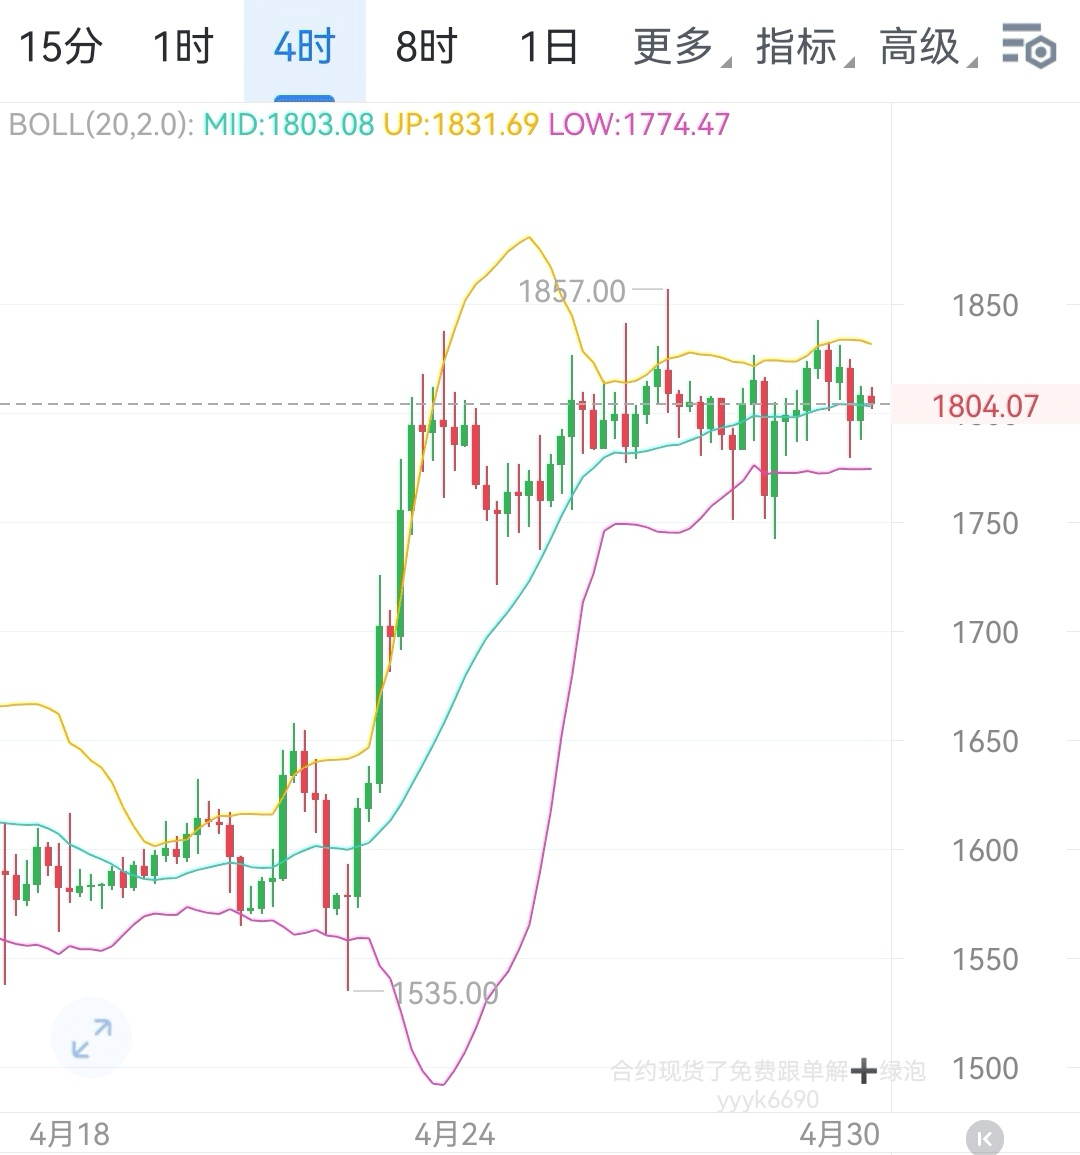
The current ETH price trend has entered a key node for short-term directional choice. Whether the 4-hour K-line can stabilize above 1805 becomes the core basis for judging the continuity of the market. The following analysis will be conducted from three aspects: technical logic, significance of key points, and operational strategy.
1. The "start switch" for the upward trend: The strategic value of 1805.
- Technical implications: 1805 is the upper boundary of ETH's recent consolidation range and corresponds to the 200-period moving average resistance at the 4-hour level. If the price can stabilize the 4-hour K-line above this level, it indicates that bullish strength has successfully broken through short-term resistance, and the trend may shift from consolidation to a one-sided upward movement.
- Upward target breakdown:
- First resistance at 1831: This level is a short-term resistance formed by connecting the high points from late March. A breakout may attract quantitative trading funds to follow the trend.
- Second resistance at 1856: Corresponding to the historical transaction concentration area in December 2024, there are many trapped positions here, and a volume breakout is needed to open up space.
- Third resistance at 1881: The upper band position of the Bollinger Bands at the daily level. If reached, it may trigger a concentrated sell-off of short-term profit-taking.
- Market sentiment linkage: Stabilizing at 1805 may drive bullish sentiment towards ETH, especially against the backdrop of BTC strengthening simultaneously, which may lead funds to rotate from BTC to ETH, accelerating the price upwards.
2. Trigger line for pullback risk: The support system after breaking 1805.
- Trend weakening signal: If the 4-hour close fails to hold above 1805 USD, it indicates a failed bullish breakout attempt, and the market may return to a sideways downward rhythm, quickly cooling off the previously accumulated buying sentiment.
- Stepwise analysis of support levels:
- First support at 1780: The resonance support formed by the 50-period moving average and recent lows, this is the "defensive bottom line" for short-term bulls; breaking this level may trigger programmed trading stop losses.
- Second support at 1751: Corresponding to the low point in mid-February. If this level is broken, the market may interpret it as an initial formation of a "head and shoulders" pattern, increasing the risk of further declines.
- Third support at 1721: The preliminary defense line at the psychological level of 1700. If this is lost, it may directly test the 1700 integer level or even dip into the strong support range of 1680 USD.
- Key observation on trading volume: If the trading volume decreases by over 30% during the pullback compared to the previous few days, it is generally a healthy adjustment; if there is a volume drop, caution is needed as major funds may use this momentum to wash or offload positions.
3. Operational strategy and risk control.
- Bull-bear watershed operation guide:
- Bullish scenario: If the 4-hour closing price stabilizes above 1805, positions can be built in batches in the 1810-1820 range, targeting 1831 and 1856 sequentially, with a stop loss set at 1795 USD (exit quickly after breaking 1805).
- Bearish scenario: If the 4-hour closing price is below 1805, a light short position can be attempted in the 1795-1785 USD range, targeting 1780 and 1751, with a stop loss set at 1815 (stop loss after breaking the resistance).
- Position management principles:
- Single trade position should not exceed 10% of total capital to avoid liquidation due to excessive volatility when breaking key levels;
- Near resistance/support levels, a "ladder-style take profit/stop loss" can be adopted. For example, take profit on 30% of the position at 1831, and look for a higher target with the remaining position; if it breaks below 1780, then stop loss on the entire position.
- Cross-species linkage reference: If BTC stabilizes at 94750 USD, the probability of ETH rising increases; if BTC pulls back, ETH may amplify volatility, necessitating caution against the risk of "catching up with declines."
Summary: Focus on the 4-hour closing line, grasp the trend switching window.
Today's core contradiction in the ETH market focuses on the bull-bear contention at 1805. The direction of the 4-hour closing line will directly determine the short-term trend. For aggressive players, light positions can be taken near key levels to speculate on the breakout direction; for conservative operations, it is recommended to wait for a clear trend before following up to avoid repeated stop losses in a sideways market. It is crucial to remember that the cryptocurrency market is significantly influenced by news and capital flow, and technical analysis is merely a supporting tool; operations need to be flexibly adjusted according to real-time market dynamics.$ETH #以太坊走势