In recent months, Bitcoin (BTC) has exhibited strong upward momentum, but a critical analysis of its historical behavior suggests a significant correction is imminent.
By comparing the previous major rally’s monthly pattern with the current monthly setup, we notice a striking similarity that hints at a possible retracement of around 12.5%, targeting the $82,500 level in the coming 1–2 weeks.

Understanding the Historical Context
As illustrated in the first attached chart, following a robust monthly green candle during the last leg up, Bitcoin experienced an 8.8% decline shortly after. This correction was a healthy market behavior — a necessary cooling-off period after rapid price expansion.

Previous retracement:
Drop: 8.80%
Volume: 864.53K
Duration: Immediate next candle
Target Zone: Aligned with mid-support levels
This historical retracement set a precedent: after strong impulsive moves, Bitcoin tends to retest lower liquidity areas to stabilize before resuming its trend.
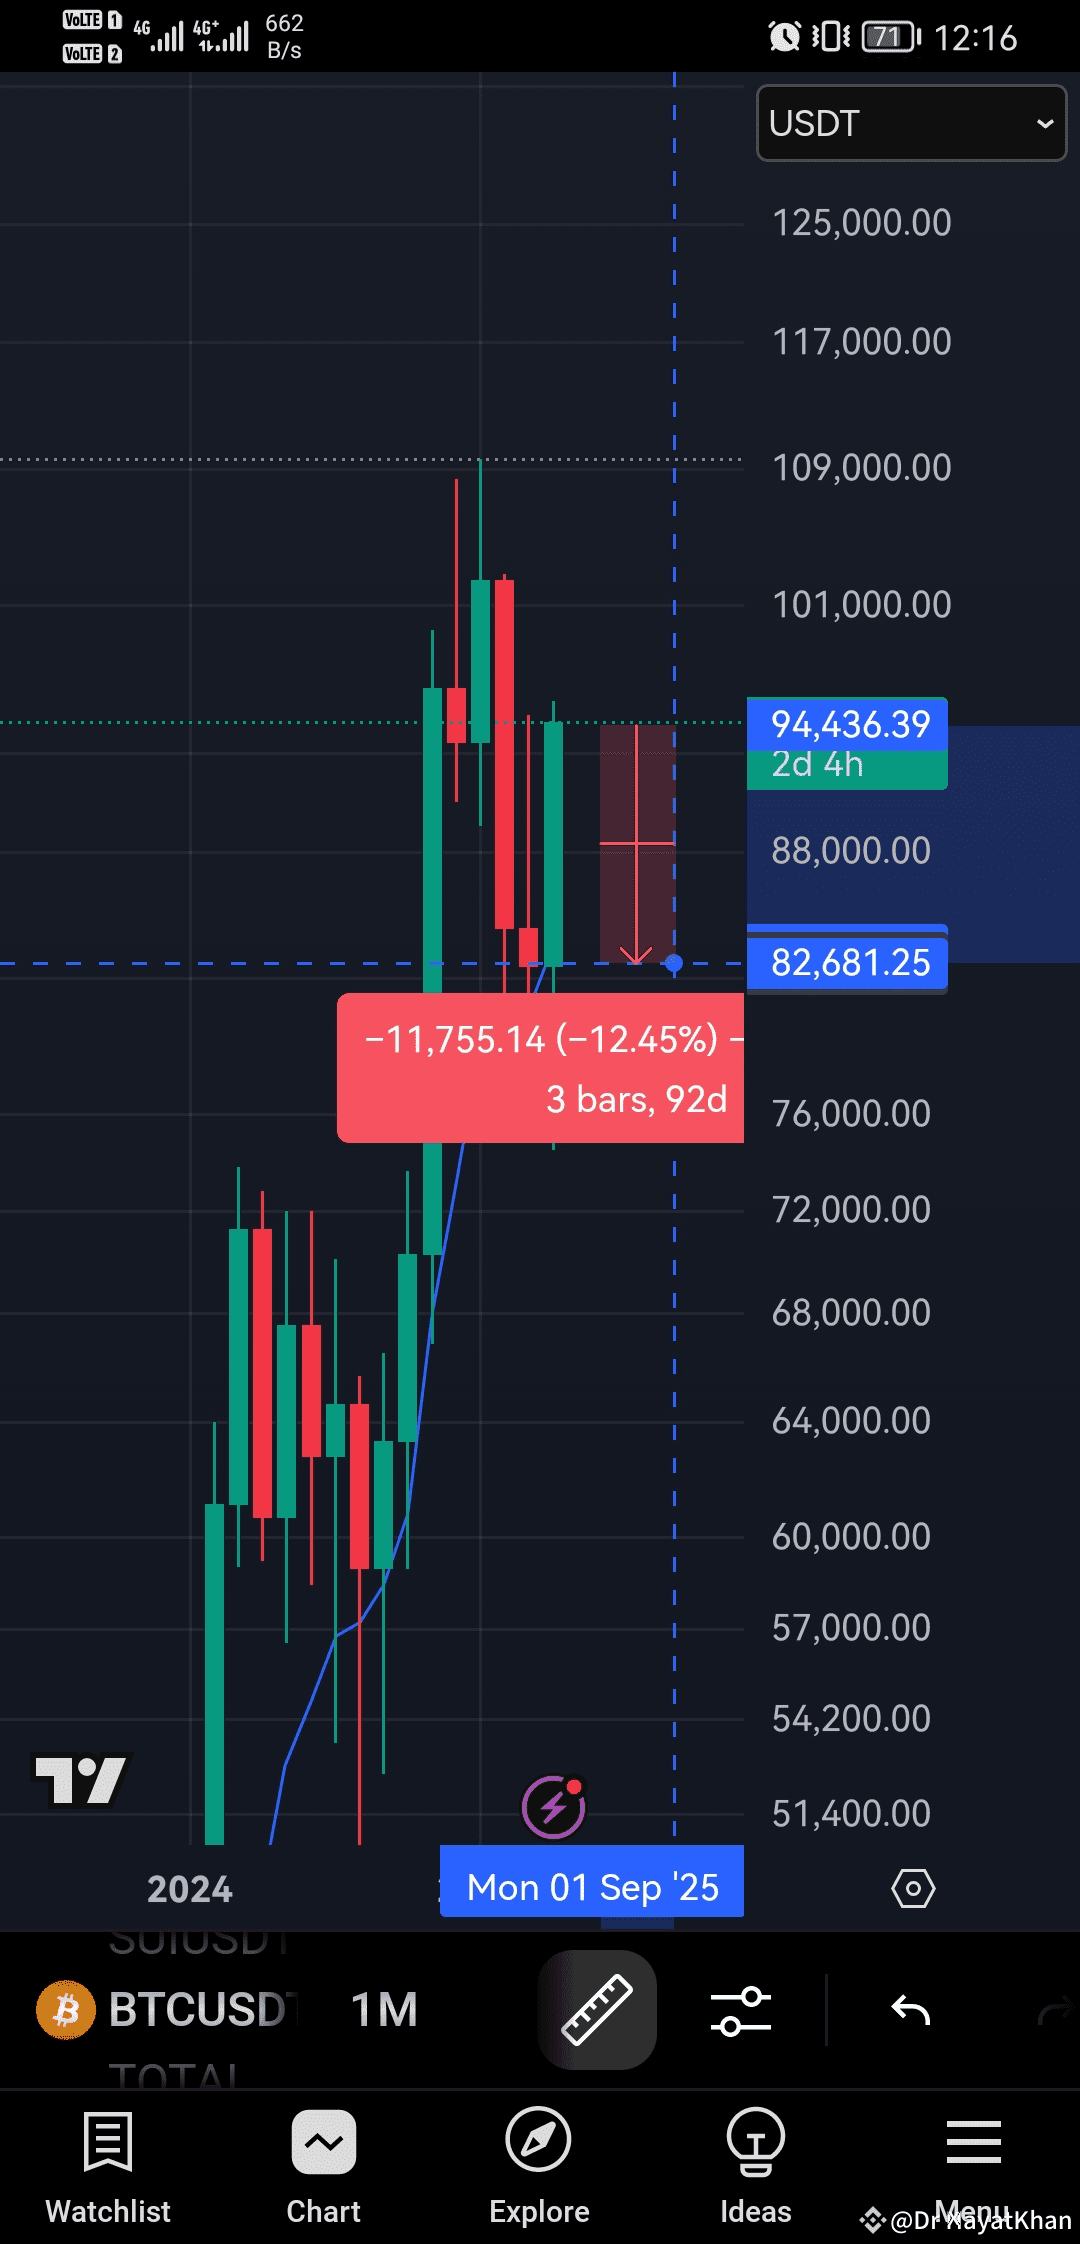
Current Setup and Expected Scenario
Moving to the current setup (second chart), the market is reflecting an even steeper exhaustion.
After another strong parabolic push, BTC has already started forming a topping structure on the monthly frame, with rejection wicks at the highs.
Projected retracement:
Drop: ~12.45%
Target Zone: $82,500 ± $500
Duration: Next 1–2 weeks
Reason: Higher exhaustion than previous leg (shown by longer wicks and increased rejection pressure)
Given the steeper nature of the current exhaustion compared to the previous pattern, it is logical to anticipate a deeper correction, approximately 12.5%, rather than just 8.8%.
This correction would allow Bitcoin to reset its indicators (especially RSI and MACD on lower timeframes), offer fresh liquidity to the bulls, and potentially prepare for the next phase of the bull cycle.
Why a Deeper Correction This Time?
Several technical and psychological factors strengthen the 12.5% correction thesis:
Increased Volatility: Wider price swings are typical as Bitcoin nears key psychological zones ($100,000 psychological resistance).
Monthly Rejection Signals: Longer upper wicks are visible compared to the previous monthly candle formation, signaling early profit-taking.
Historical Mean Reversion: Each bull phase historically involves significant mid-cycle corrections ranging between 10% to 20% to maintain market health.
Market Sentiment:
The fear-greed index and on-chain metrics suggest over-leveraging, making a sharp but temporary retracement healthy and necessary.
Conclusion:
Drawing parallels between past and present price behavior suggests that Bitcoin is poised for a 12.5% correction, potentially revisiting the $82,500 level.
While short-term traders should be cautious, long-term investors can view this as an opportunity to accumulate before Bitcoin continues its macro trend upward.
History doesn’t repeat itself exactly — but it often rhymes.
BTC’s roadmap appears to be following that rhyme closely once again.
Disclaimer: This article is for informational purposes only and does not constitute financial advice. Always do your own research before making investment decisions.
