
Original text: David Puell, Ark Invest analyst;
Translator: CryptoLeo; Editor: Hao Fangzhou.
Editor's note:
At the beginning of the year, Bitcoin 'dead bulls', Cathie Wood's Ark Invest released the Big Ideas 2025 report, mentioning three price targets for Bitcoin in 2030, which are: $300,000 (bear market), $710,000 (baseline market), and $1.5 million (bull market). At that time, it was just 'purely shouting' a price far exceeding market expectations (like Plan B), without revealing the actual estimation process.
Two months later, Ark Invest finally announced its modeling methodology and logical assumptions for Bitcoin's price target in 2030. This model predicts Bitcoin's price in 2023 based on the total addressable market (TAM) and penetration rate.
More inspiring (exaggerated) is that the price of Bitcoin in 2030, based on the calculations created by Ark Invest using Bitcoin's active supply metrics, is projected to be: $500,000 (bear market), $1.2 million (baseline market), and $2.4 million (bull market). If any of these TAM or penetration rates do not meet expectations, Bitcoin may fail to reach these price targets. Therefore, this model also carries some risks and biases. The following are the specific details of Bitcoin's price predictions, compiled by Odaily Planet Daily.

Price targets and assumptions.
Our price target is the sum of the contributions of TAM (total addressable market) by the end of 2030, based on the following formula:

Odaily Planet Daily note: This formula predicts Bitcoin's price in 2030 by quantifying the dynamic relationship between market demand and Bitcoin circulation. It calculates Bitcoin's price by multiplying the maximum dollar benchmark demand size for the segmented market by Bitcoin's penetration rate in its market and dividing it by Bitcoin's circulating supply, summing the prices of all segmented markets (the following segmented markets/concepts) to arrive at the predicted price of Bitcoin in 2030.
Our estimate of supply is based on Bitcoin's circulating amount, which will approach 20.5 million BTC mined by 2030. The contribution of each variable to the price target is as follows:
Expected contributors to capital accumulation (main):
1. Institutional investment, primarily through spot ETFs;
2. Bitcoin is referred to by some as 'digital gold', as it is a more flexible and transparent means of value storage compared to gold;
3. Emerging market investors seeking safe havens to protect themselves from inflation and currency devaluation.
Expected contributors to capital accumulation (secondary):
4. National treasury reserves, as other countries follow the US in establishing Bitcoin strategic reserves;
5. Corporate treasury reserves, as more and more companies use Bitcoin to achieve cash diversification;
6. Bitcoin on-chain financial services, Bitcoin as an alternative to traditional finance.
Excluding digital gold (as it is Bitcoin's most direct zero-sum competitor, our model excludes it), we conservatively assume that the TAM for the above contributors (specifically 1, 3, 4, and 5) will grow at a compound annual growth rate (CAGR) of 3% over the next six years. For the sixth contributor—Bitcoin's on-chain financial services—we assume a 6-year CAGR between 20% and 60%, based on the cumulative value as of the end of 2024, as follows:

Odaily Planet Daily note: This formula calculates Bitcoin's TAM six years later by using the total value of Bitcoin in 2024 and the compound growth rate for each year, and divides it by Bitcoin's circulating supply in 2030 to calculate its price.
Finally, we separately describe the contribution of TAM and penetration rates to price targets in bear, baseline, and bull markets, as follows:

As shown in the figure above, 'digital gold' contributes the most to our bear and baseline scenarios, while institutional investment contributes the most to our bull market scenario. Interestingly, national treasuries, corporate treasuries, and on-chain financial services contribute relatively little in each scenario. In the table below, we detail the relative contributions of our predicted sources of capital accumulation to bear, baseline, and bull market scenarios.
Odaily Planet Daily note: The following charts show the expected TAM for segmented markets in 2030, Bitcoin's penetration rates under three market conditions, and the contribution ratios in the figure above.
1. Potential contributors to capital accumulation: Institutional investment.

According to State Street Bank, the definition of the global market portfolio is as follows:
The market value of all investable capital assets divided by the sum of the market values of all assets. As the total of all holdings produced by collective decision-making of investors and issuers, as well as capital suppliers and demanders, the global market portfolio can be viewed as a practical representation of the investable opportunity set for all global investors.
As of 2024, the global portfolio's TAM is approximately $169 trillion (excluding gold's 3.6% share). Assuming a CAGR of 3%, its value will reach about $200 trillion by 2030.
We assume penetration rates of 1% and 2.5% for the bear and baseline markets, respectively, both of which are below gold's current share of 3.6%. Therefore, the bear and baseline markets represent a conservative view on Bitcoin adoption. In a more aggressive bull market, we assume Bitcoin's penetration rate reaches 6.5%, nearly double gold's current share.
2. Potential contributors to capital accumulation: Digital gold.
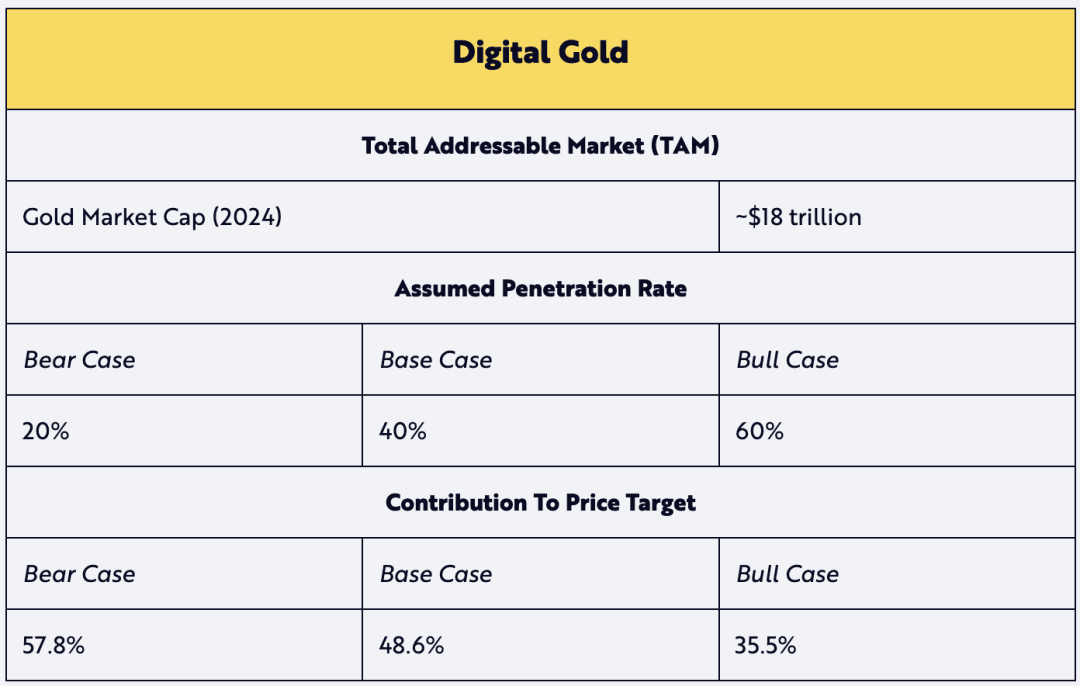
The contribution of digital gold assumes the ratio of TAM relative to gold's current market value. Given the positive penetration rates provided, we assume that gold's expected TAM will not grow by 2030, thereby lowering its expected value. We believe that Bitcoin as digital gold is an attractive narrative that will drive its penetration rate.
3. Potential contributors to capital accumulation: Emerging market safe havens.

The TAM for emerging market safe havens is based on the monetary base of all developing countries (as defined by the IMF/CIA, also referred to as 'underdeveloped' economies). We believe that this use case for Bitcoin has the greatest potential for capital appreciation. In addition to its value storage characteristics, Bitcoin's low entry barrier provides individuals with internet access an investment option that may yield capital appreciation over time, unlike defensive allocations such as the US dollar—thereby maintaining purchasing power and avoiding domestic currency devaluation.
Odaily Planet Daily note: 'M2' is an indicator of the US money supply, including M1 (currency and deposits held by the non-bank public, demand deposits, and traveler's checks) plus savings deposits (including money market deposit accounts), small time deposits under $100,000, and retail money market mutual fund shares.
4. Potential contributors to capital accumulation: National treasuries.

Although El Salvador and Bhutan currently lead the world in national-level Bitcoin adoption rates, the number of advocates for Bitcoin strategic reserves is increasing—especially since Trump's administration, which issued an executive order on March 6 requiring the establishment of BTC reserves in the US. Despite our conservative assumptions in bear and baseline scenarios, we believe that the situation in the US may further validate our bullish assumption of a 7% penetration rate.
5. Potential contributors to capital accumulation: Corporate bonds.

Inspired by the successful acquisition of Bitcoin by MicroStrategy since 2020, other companies have also begun to incorporate Bitcoin into their corporate treasury reserves. As of the end of 2024, 74 listed companies are holding approximately $55 billion in Bitcoin on their balance sheets. If these companies' BTC strategies are validated over the next six years, our conservative penetration rate assumptions in bear and baseline scenarios (1% and 2.5% respectively) may ultimately approach 10% under bullish assumptions.
6. Potential contributors to capital accumulation: Bitcoin's on-chain financial services.

Bitcoin's native financial services are emerging as new contributors to capital accumulation. Notable examples include Layer 2 services like the Lightning Network, which aims to expand Bitcoin's transaction capacity, while Wrapped BTC (WBTC) on the Ethereum network allows Bitcoin to participate in decentralized finance. Such on-chain financial services are becoming an increasingly important feature of the Bitcoin ecosystem. Therefore, we believe that a 40% CAGR for the baseline market from now until 2030 is based on realistic expectations.
ARK's assumptions apply to active Bitcoin supply.
Although not included in ARK's Big Ideas 2025 report, other experimental modeling methods have estimated Bitcoin's price in 2030. One such method calculates the lost or long-held Bitcoin, using Bitcoin's on-chain transparency to estimate Bitcoin's liquid supply—we refer to this as 'active' supply.
According to this method, the active supply can be calculated by multiplying Bitcoin's expected supply in 2030 by the 'liveliness' metric, which measures the movement of Bitcoin from 0% to 100% over time—in other words, the true 'float' of the asset, as follows.

As shown in the figure, Bitcoin's network activity has remained around 60% since early 2018. We believe this level of activity indicates that approximately 40% of the supply is 'vaulted' (i.e., Bitcoin that is stored and not entering the market, such as Satoshi's Bitcoin address)—a concept we explored in depth in our ARK white paper (Cointime Economics: A New Framework for On-Chain Analysis of Bitcoin) (https://www.ark-invest.com/white-papers/cointime-economics).
We then apply the same TAM and penetration rates under the bear and baseline market scenarios to the expected active supply to reach 60% by 2030 (assuming the activity remains stable over time), as follows:

Based on this, we arrive at the following price targets, which are approximately 40% higher than our base model that does not consider Bitcoin's active supply and network activity:

The model shows that based on the new active supply metric, the estimated price of BTC in 2030 is: $500,000 (bear market), $1.2 million (baseline market), and $2.4 million (bull market).
Importantly, valuations constructed using this more experimental approach are more aggressive than those we set under bear, baseline, and bull market scenarios. Because our official price targets are more conservative, they focus solely on Bitcoin's total supply. Even so, we believe that this more experimental approach highlights Bitcoin's scarcity and the loss of supply that is not reflected in most current valuation models.
Appendix
I took a rough look at the Cointime Economics framework, which proposes a new system for analyzing Bitcoin valuation and inflation rates by calculating Bitcoin's liveliness and vaultedness to assess the economic state and supply activity of Bitcoin, measuring the activity level of transactions in the Bitcoin network and the proportion of unused coins. These two indicators can classify Bitcoin's supply into active and unused supply.
This framework also introduces a metric called 'Coinblock', which offers a new set of on-chain analytical indicators to measure Bitcoin's activity by calculating the product of holding time and the amount of Bitcoin to determine the number of coinblocks. It also introduces three concepts: 'coinblock creation', 'coinblock destruction', and 'coinblock storage', and builds a series of new economic indicators based on this, such as Bitcoin's activity and the degree of being locked, to measure the dynamic changes and economic status of the Bitcoin market. Additionally, this content showcases the potential of Cointime Economics in improving market valuation models, measuring supply activity, and creating new models through case studies. The concept of coinblocks and the Cointime economic framework may become a major reference for Bitcoin valuation in the future. Interested parties can check out the original PDF (https://assets.arkinvest.com/media-8e522a83-1b23-4d58-a202-792712f8d2d3/c919760f-ddc5-4c7c-a653-7904c0f78ddf/ARK%20Invest%20x%20Glassnode_White%20Paper_Cointime%20Economics_Final.pdf).