Bitcoin price projections are back in the spotlight after the weekly Monte Carlo simulation chart processed today, Wednesday, April 23, 2025, the day BTC broke through US$94,508. Can the one-of-a-kind crypto break through the psychological zone of US$100 thousand again?
The simulation used by Blockchainmedia.id Editors displays a series of possible Bitcoin price paths against USDT, with a reference to the weekly opening price on Monday, April 21, 2025, which is US$85,157. The Monte Carlo model used in this projection relies on statistical principles and random distributions based on historical volatility to estimate how prices may develop over a certain period of time.
“This Monte Carlo simulation allows users to project future asset prices or trading strategy performance using historical data or custom inputs, using two statistical methods—normal distribution and bootstrapping. Features include graphical visualizations such as lines and histograms, parameter adjustments such as number of simulations and prediction length, and options to display best/worst case scenarios and scatterplots for up to 1000 potential outcomes,” the model’s description states.
Simulation Structure
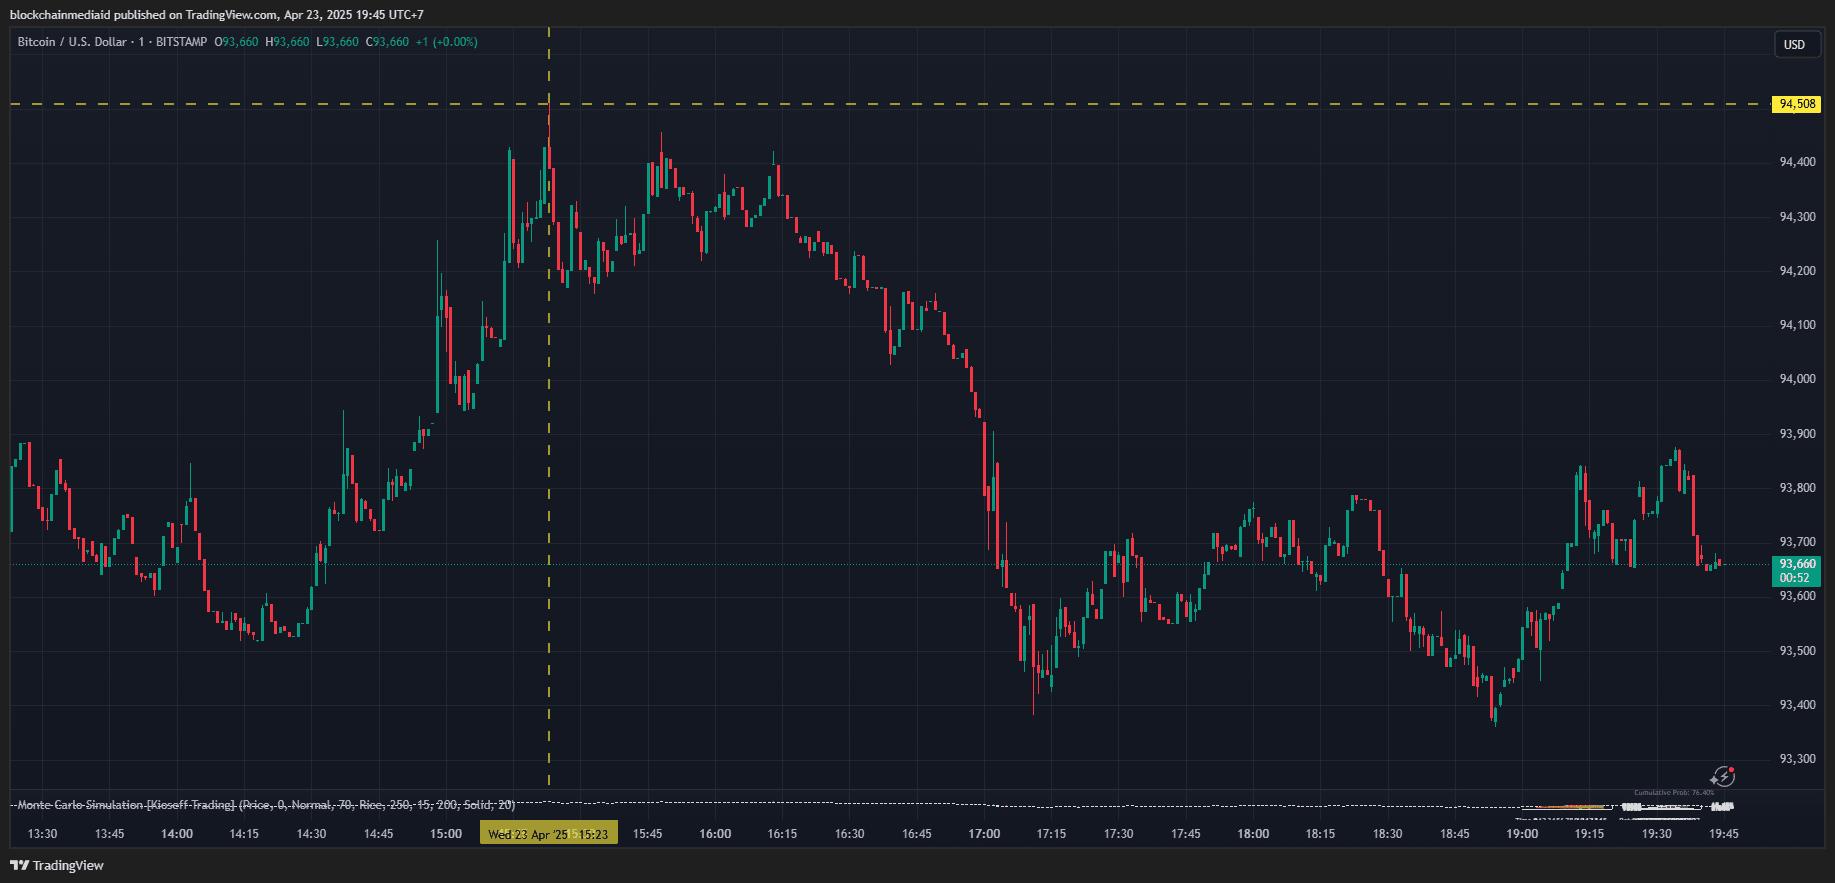
The simulation results chart consists of two main parts (see the image below). The left part shows the various possible price paths over the weeks, starting from the starting point on April 21, 2025 and continuing until Monday, July 28, 2025. The right part is a histogram chart of the final simulation results.
These paths are depicted as colored lines that spread out in different directions, representing the various possible directions of Bitcoin's price movement. This 15-week time span is sufficient to illustrate medium-term fluctuations and help form Bitcoin price projections in the context of seasonality and evolving market sentiment.

It is important to note that the spread of these paths shows a high degree of uncertainty. Some simulated paths point to a fairly deep correction, with Bitcoin falling to near $40,000. On the other hand, some optimistic trajectories show a potential surge to over $120,000. Statistically, this illustrates the spectrum of risks and opportunities as part of Bitcoin’s non-deterministic price projections.
Bitcoin price projections are back in the spotlight after the weekly Monte Carlo simulation chart processed today, Wednesday, April 23, 2025, the day BTC broke through US$94,508. Can the one-of-a-kind crypto break through the psychological zone of US$100 thousand again?
The simulation used by Blockchainmedia.id Editors displays a series of possible Bitcoin price paths against USDT, with a reference to the weekly opening price on Monday, April 21, 2025, which is US$85,157. The Monte Carlo model used in this projection relies on statistical principles and random distributions based on historical volatility to estimate how prices may develop over a certain period of time.

“This Monte Carlo simulation allows users to project future asset prices or trading strategy performance using historical data or custom inputs, using two statistical methods—normal distribution and bootstrapping. Features include graphical visualizations such as lines and histograms, parameter adjustments such as number of simulations and prediction length, and options to display best/worst case scenarios and scatterplots for up to 1000 potential outcomes,” the model’s description states.
Simulation Structure
The simulation results chart consists of two main parts (see the image below). The left part shows the various possible price paths over the weeks, starting from the starting point on April 21, 2025 and continuing until Monday, July 28, 2025. The right part is a histogram chart of the final simulation results.
These paths are depicted as colored lines that spread out in different directions, representing the various possible directions of Bitcoin's price movement. This 15-week time span is sufficient to illustrate medium-term fluctuations and help form Bitcoin price projections in the context of seasonality and evolving market sentiment.
It is important to note that the spread of these paths shows a high degree of uncertainty. Some simulated paths point to a fairly deep correction, with Bitcoin falling to near $40,000. On the other hand, some optimistic trajectories show a potential surge to over $120,000. Statistically, this illustrates the spectrum of risks and opportunities as part of Bitcoin’s non-deterministic price projections.

