

Preface
Both BTC and ETH markets are facing an unprecedented capital withdrawal. By observing the inter-exchange flow pulse indicator (IFP) and the supply of long-term holders, it is found that market investor sentiment is becoming more cautious, the leveraged trading frenzy has clearly subsided, the open contract volume has sharply declined, and the funding rate is approaching negative territory. Various signs indicate that recent market adjustments may not yet be over.
Bitcoin
Inter-exchange Flow Pulse (IFP)

The IFP indicator has remained at a high level since 2024, but there has recently been a trend of gradual decline, approaching its 90-day moving average. Particularly between the end of 2024 and early 2025, the chart shows red areas representing a slowdown in fund flow, corresponding to BTC's price consolidation or slight correction. This indicates that although the overall bull market sentiment has not fully transformed, there are significant signs of a decline in market liquidity. This situation may suggest that market participants are becoming more cautious or wait-and-see. When funds no longer actively flow in or quickly circulate between exchanges, it indicates that the current volatile market may need more time.
Note: 'Bitcoin: Inter-exchange Flow Pulse (IFP)' is an indicator of the flow of funds between exchanges, used to observe the flow of BTC across exchanges to gauge market liquidity and changes in investor sentiment. When the IFP value is above its 90-day moving average (IFP-SMA), it indicates active fund flow between exchanges, usually corresponding to a bull market scenario; conversely, when the value is below the moving average, fund flow tends to decline, which may indicate the market entering a bear or consolidation phase.
BTC: Long-Term Holders Supply and Price

The relationship between the supply of BTC long-term holders (LTH Supply, blue bar chart) and BTC price (white curve). Overall, as the supply of long-term holders gradually increases, it indicates that more BTC is being transferred from short-term traders to investors who are confident in holding long-term, usually reflecting an optimistic market outlook for BTC's future price trend or a consolidation phase. From 2022 to mid-2023, BTC price experienced significant volatility and a notable decline, while the supply of long-term holders increased significantly, indicating that in bear markets or downturns, a large amount of capital gradually settles into the wallets of long-term investors.
The latest status in April 2025 shows that the supply of long-term holders peaked in the fourth quarter of 2024 (close to 15.75M BTC) and then rapidly declined alongside BTC's price correction, indicating that many long-term investors began to take profits or reduce their positions during this period. After entering early 2025, the supply of long-term holders began to stabilize and rise again, suggesting that after experiencing a brief profit-taking wave, long-term holders regained confidence in the market and continued to absorb capital, with BTC price also showing signs of stopping its decline.
Note: BTC: Long-Term Holders Supply and Price indicator tracks the BTC supply and price changes of long-term holders (holding BTC for more than 155 days) to present the degree of confidence of long-term investors in the market outlook and changes in holdings. Generally, an increase in long-term holders' supply indicates that more BTC is being withdrawn from short-term market trading, representing a stage of long-term capital accumulation and gradual confidence buildup; conversely, a decrease in long-term holders' supply may indicate that such investors are beginning to take profits, signaling that the market may enter a cyclical peak or state of price correction. This indicator is often used as a judgment tool for the medium to long-term trends in the BTC market.
MicroStrategy has not bought BTC

On 2025/04/07, MicroStrategy (Strategy) did not announce or purchase any BTC.
(Does not conform to the norm, as MicroStrategy announces the amount of BTC bought every Monday.)
Currently, MicroStrategy holds 528,185 BTC (average price 67,458)
On-chain operation records: Related links
BTC Market Analysis

Currently, BTC's market share has not yet broken through this upward channel. Normally, in technical analysis, we would hope to bounce back upon hitting support and drop when meeting resistance. However, based on the current candlestick trend sticking to the upper boundary's response, the author is more inclined to view this as boundary accumulation, waiting for a breakout.
BTC's weekly chart maintains a state of stopping the decline, with the previous low (74,500) close to a major support-resistance conversion zone, which is also the Fibonacci retracement 0.618 in this bull market. The price stopping and rebounding in these two weeks further implies that this price range has a stronger support effect; thus, the author believes that the support range shown in the chart and the Fibonacci retracement 0.618 represent a good potential opportunity for long-term holders.
Currently, BTC is in a daily consolidation phase, forming a clear range between the previously mentioned support zone and the upper resistance zone (about $85,000-$90,000). Recent prices show an attempt to break upward, but the upper resistance area has dense trading, making short-term breakthroughs more challenging; on the other hand, prices quickly rebounded after testing the lower support zone, indicating strong buying power at the lower support zone, with a strong defensive willingness in the short term. In terms of trading volume, the recent volume has significantly decreased compared to the previous wave of increases, indicating that the current market is still in a wait-and-see state. For an effective breakthrough or breakdown of the aforementioned key range in the short term, a clearer accumulation of trading volume and a breakthrough of the downward trend structure are needed.
Ethereum
Ethereum: Open Interest – All Exchanges

In 2021 and 2024, when ETH prices reached their peaks, the open contract volume also concurrently reached historical highs, reflecting that market participants were actively engaging in leveraged speculative operations through the derivatives market, paired with the market's enthusiastic atmosphere, driving prices to new highs. However, whenever prices fall from their peaks, the open contract volume also declines sharply, showing that leveraged traders are rapidly closing their positions, causing the market to enter a period of correction or consolidation.
As ETH price has fallen from a peak of over $4,000 in 2024 to around $1,500, the open contract volume has sharply declined from nearly $18 billion to around $600 million, showing a highly synchronized decline. This situation indicates that since the end of 2024, the market's leveraged trading and speculative frenzy have clearly subsided, and market participants have become more cautious, representing significant downward pressure on ETH price.
Ethereum: Funding Rates

The funding rate for ETH has significantly dropped to near neutral levels by the end of 2024, even briefly falling into negative territory, indicating a shift in market sentiment from clearly bullish to conservative or even bearish. ETH price has also fallen from a high of over $4,000 to around $1,500, showing a high correlation between funding rates and market prices. Furthermore, the funding rate has remained close to zero since early 2025, indicating a lack of clear directional movement in the market, with long and short forces temporarily in balance, and an overall market atmosphere leaning towards caution and observation.
Trump WLFI project sells ETH at a loss
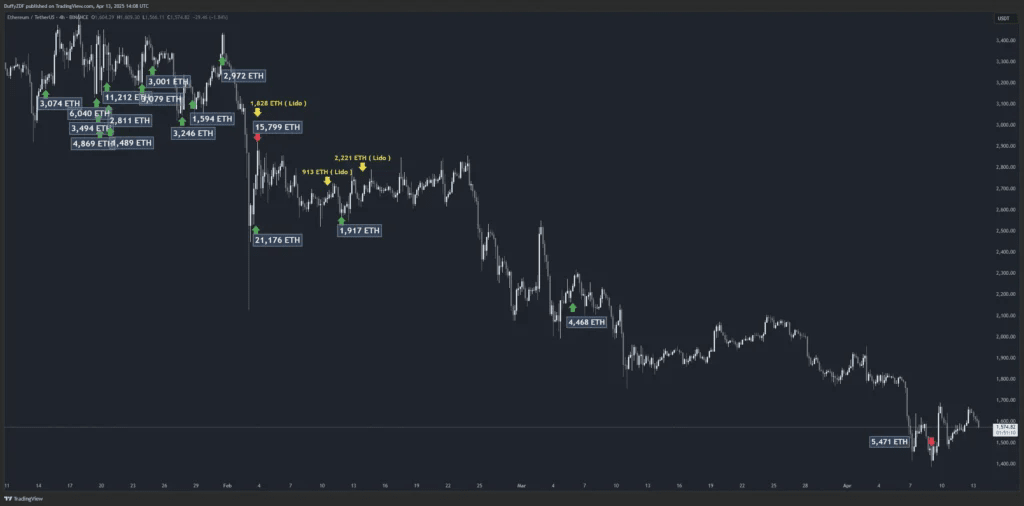
On 2025/04/09, an address starting with 0x77a (World Liberty Fi) sold 5,471 ETH through CoW Protocol.
On-chain operation records: Related link 1 Related link 2
ETH Market Analysis

ETH/BTC's current exchange rate has not yet reached around 0.01642 for a support test. Observing the structural trend, no reversal pattern has appeared, so we must wait and see.

The trend of ETH compared to BTC is more straightforward; both show a pattern of decline → consolidation → decline. If ETH continues to show weak performance without forming a bottom pattern or breaking the current downward trend structure, then ETH will continue its strong bearish trend.
Shanzhai Coin Altcoin
Internal transfer of Layer by Binance

According to the previous article: 'Did Trump's Tariff Deal a Death Blow? Bitcoin and Ethereum Plummet, These Signals Indicate It's Not Time to Buy the Dip!' After internal transfer of Layer, the price rose from $1.38 to $1.98.
Subsequently, on 2025/04/11, Binance again transferred 6,366,000 Layer from a hot wallet starting with 5tzFk to a cold wallet starting with 9WzDX (internal transfer).
On-chain operation records: Related links
Trump WLFI project buys SEI

Subsequently, on 2025/04/12, an address starting with 0xA71 (World Liberty Fi) bought 4,894,000 SEI through CoW Protocol. As of now, World Liberty Fi holds a total of 5,983,000 SEI (average price 1.67)
On-chain operation records: Related link 1 Related link 2
SEI Market Analysis

The weekly chart has completed a 1:1 decline, and has reacted slightly upon encountering our gray support area, so we can wait for a bottom formation.

Currently, the SEI daily chart has completed a head-and-shoulders pattern, after a pullback to the right shoulder it declined into a downward channel. Currently, only a rebound is being observed; even if this downward channel is broken in the short term, the outlook remains pessimistic as there are no signs of a bottom or stabilization.
Conclusion
Although BTC has found temporary support at important levels and ETH shows signs of stabilization, the overall market heat and investor sentiment have significantly cooled, and there is a possibility of continued downward pressure in the short term. The market is currently at a critical turning point, and whether it can truly stabilize depends on the speed of capital inflow and the extent of market sentiment recovery.
This report is for informational sharing only and does not constitute any form of investment advice or decision-making basis. The data, analysis, and opinions cited are based on the author's research and public sources and may contain uncertainties or changes at any time. Readers should exercise caution in making investment judgments based on their own circumstances and risk tolerance. For further guidance, it is advisable to seek professional advisory opinions.


