

Introduction
Recently, the market appears to have welcomed a rebound. BTC entered a consolidation phase after reaching high-pressure levels, while ETH demonstrated resilience during the consolidation structure. However, upon examining the market structure and futures data, it is found that this bullish counterattack conceals significant divergences and hidden concerns. USDT market share, contract CVD and spot CVD divergences, overlapping Fibonacci pressure zones, and a rebound structure driven by leverage are gradually revealing the fragile foundation of this market trend. This article will analyze the current long and short risk levels and potential momentum directions of BTC and ETH from both technical structure and capital behavior.
USDT Market Share

Today, I will additionally analyze an index related to the fluctuations of Bitcoin, called USDT.D, which refers to the market share of USDT. It has a strong negative correlation with BTC. If the USDT market share decreases, these excess stablecoins will tend to purchase risk assets like BTC; if the USDT market share increases, it indicates that investors in the market are converting BTC into stablecoins for hedging.
From the county chart, it can be seen that after USDT.D rises, it encounters a pressure zone and breaks this rising channel, currently staying briefly on the yellow line, expecting to make a rise to form a pullback channel before continuing to decline. Therefore, I believe that BTC will similarly face a correction trend.
Bitcoin
MicroStrategy bought BTC

On April 21, 2024, Michael Saylor announced on X (Twitter) that MicroStrategy bought a total of 6,556 BTC this week (average price 84,785).
Currently, MicroStrategy holds a total of 538,200 BTC (average price 67,766).
On-chain operation records: Related links
1inch team investment fund sold WBTC

On April 26, 2024, the address starting with 0x225 (1inch team Investment Fund) sold 70.76 WBTC on-chain (average price 94,346).
Currently, this address still holds 55.38 WBTC.
On-chain operation records: Related links
BTC Market Analysis

Last week, I analyzed that the bullish profit-taking position for BTC (91,600 to 93,200) has been reached, even touching the upper boundary of the range, but it did not break through the range and instead consolidated at the top. From the perspective of limit orders, since the sell orders at the top have been consumed yet there has been no breakthrough, this behavior appears more bearish in my view, indicating that bullish forces are not very interested in this price and are unwilling to pull the price up for a breakout.

Another perspective to consider is the large Fibonacci retracement of 0.382. From the chart above, it can be observed that this retracement level coincides with the previous trading concentration (POC) formed during BTC's fluctuations and the pressure zone. If BTC rises to around 96,400 in future price fluctuations, and the six-hour to daily candlesticks cannot effectively close above 96,400, then BTC will have a higher chance of facing resistance.

Since BTC's previous drop touched 75,000, there has been a nearly 30% price rebound, but if we observe the spot CVD & contract CVD, we can see that the cumulative increase in contract CVD is very strong, while the spot CVD has continued to decline with the price increase.
The increase in contract CVD can be seen as current market participants tend to engage with contracts that allow leverage, while the continuous decrease in spot CVD indicates that spot traders in the market are actively selling > actively buying. Based on past experiences, when observing the divergence between current contract CVD and spot CVD, the risk of bullish leverage being liquidated is very high.
Further reading: How to read Bitcoin futures data? What are open interest & long-short ratios? Master the movements of large holders!
Note:
Contract CVD
Used to track the gap between active buy and sell orders in the contract market. It accumulates the difference between the number of active buy and sell orders in the derivatives market, forming a continuously changing trend line. When the contract CVD continues to rise, it indicates that leveraged long positions are more prevalent, suggesting a bullish market; conversely, if it continues to decline, it indicates that short positions are dominating. Due to the high leverage allowed in the contract market, this type of capital is often involved in short-term, speculative operations, so contract CVD is often used to observe short-term trading sentiment and potential liquidation risks.
Spot CVD
Used to observe the cumulative difference between active buy and sell orders in the spot market. Unlike contracts, spot trading involves the flow of real funds. When the spot CVD rises, it indicates that more people are actively buying spot assets, reflecting the actual buying power in the market; if the spot CVD declines, it indicates that active selling predominates, with funds flowing out. Since spot traders usually prefer to hold for the medium to long term, the spot CVD better reflects the confidence in the market's fundamentals and long-term trend direction.
Ethereum
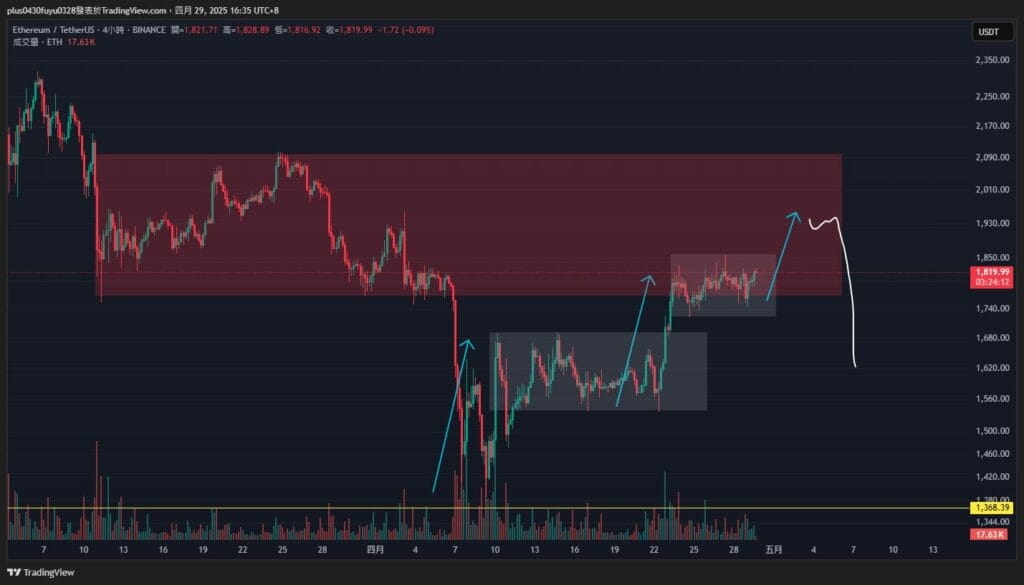
Currently, regarding ETH's pattern, I believe this is a market structure of consolidation > breakout > consolidation, where consolidation can be seen as a bullish continuation, similar to a pattern of accumulation. The current trend is relatively healthy, but it has yet to break through the pressure zone formed after the decline on the left side, so caution is still required.

From another perspective, if ETH falls back to around 1,650 to 1,680 in small levels, it deserves more attention. This level has a support zone and a Fibonacci retracement of 0.618. When Fibonacci retracement of 0.618 coincides with a strong trend, it possesses higher efficacy. Therefore, if one wants to find potential opportunities for ETH with a bullish strategy, waiting for a test of the lower price zone before executing would be a better choice.

In the performance of spot CVD & contract CVD, ETH is clearly stronger than BTC. In the first half of the article, it was mentioned that if the spot CVD for BTC shows continued decline while the contract CVD continues to increase, the likelihood of bullish leverage being liquidated is higher.
In contrast, the data characteristics of ETH are opposite to BTC; the spot CVD has continued to increase since its previous decline, while the contract CVD has remained flat with little change. In this scenario, we can consider ETH's characteristics as being driven by spot buying rather than being dominated by the contract market.
In simple terms, price increases driven by spot demand are healthier than those driven by contracts.
Altcoin
Fantom Foundation sold CRV

On April 24, 2024, the address starting with 0x431 (Andre Cronje: Fantom Foundation) transferred 11.074M CRV to Binance.
On-chain operation records: Related links
ApeCoin project transferred APE to Coinbase Prime

On April 23, 2024, the address starting with 0xc21 (Apecoin: Treasury) transferred 8M APE to Coinbase Prime.
On-chain operation records: Related links
CORE Market Analysis

The BTC L2-related coins CORE mentioned in last week's report have risen about 25% as expected; currently, we are observing the POC (1.07) area for profit-taking.
Conclusion
BTC's strong performance on the daily level has indeed gradually restored confidence in the market, but while being optimistic, one must also be aware of the risks currently indicated by the market, whether it is the POC mentioned in technical analysis or the Fibonacci retracement of 0.382, or the divergence of spot CVD & contract CVD, all revealing that BTC's current price level carries significant bullish risks.
Even though ETH has performed poorly since 2025, according to the current characteristics of spot CVD & contract CVD data, it indicates that ETH's price rebound this time is healthier. Therefore, if there is a pullback or a more evident pattern formation in the future, currently the bearish strategy is focused on BTC; the bullish strategy is focused on ETH, which would be a worthwhile strategy to enter.
This report is for informational sharing purposes only and does not constitute any form of investment advice or decision-making basis. The data, analyses, and opinions cited in the text are based on the author's research and public sources, which may have uncertainties or be subject to change at any time. Readers should make investment judgments cautiously based on their circumstances and risk tolerance. For further guidance, it is recommended to seek professional advice.