Last week, the market saw Ethereum attempting to break the 2850 mark while Bitcoin moved like a stable coin. The market faced two sell-offs due to stagflation and ETH hack news. Despite this week being relatively quiet in terms of news, the Core Personal Consumption Expenditures Price Index data on Friday will be significant. Additionally, Trump will be speaking today at 10 PM.
Bitcoin
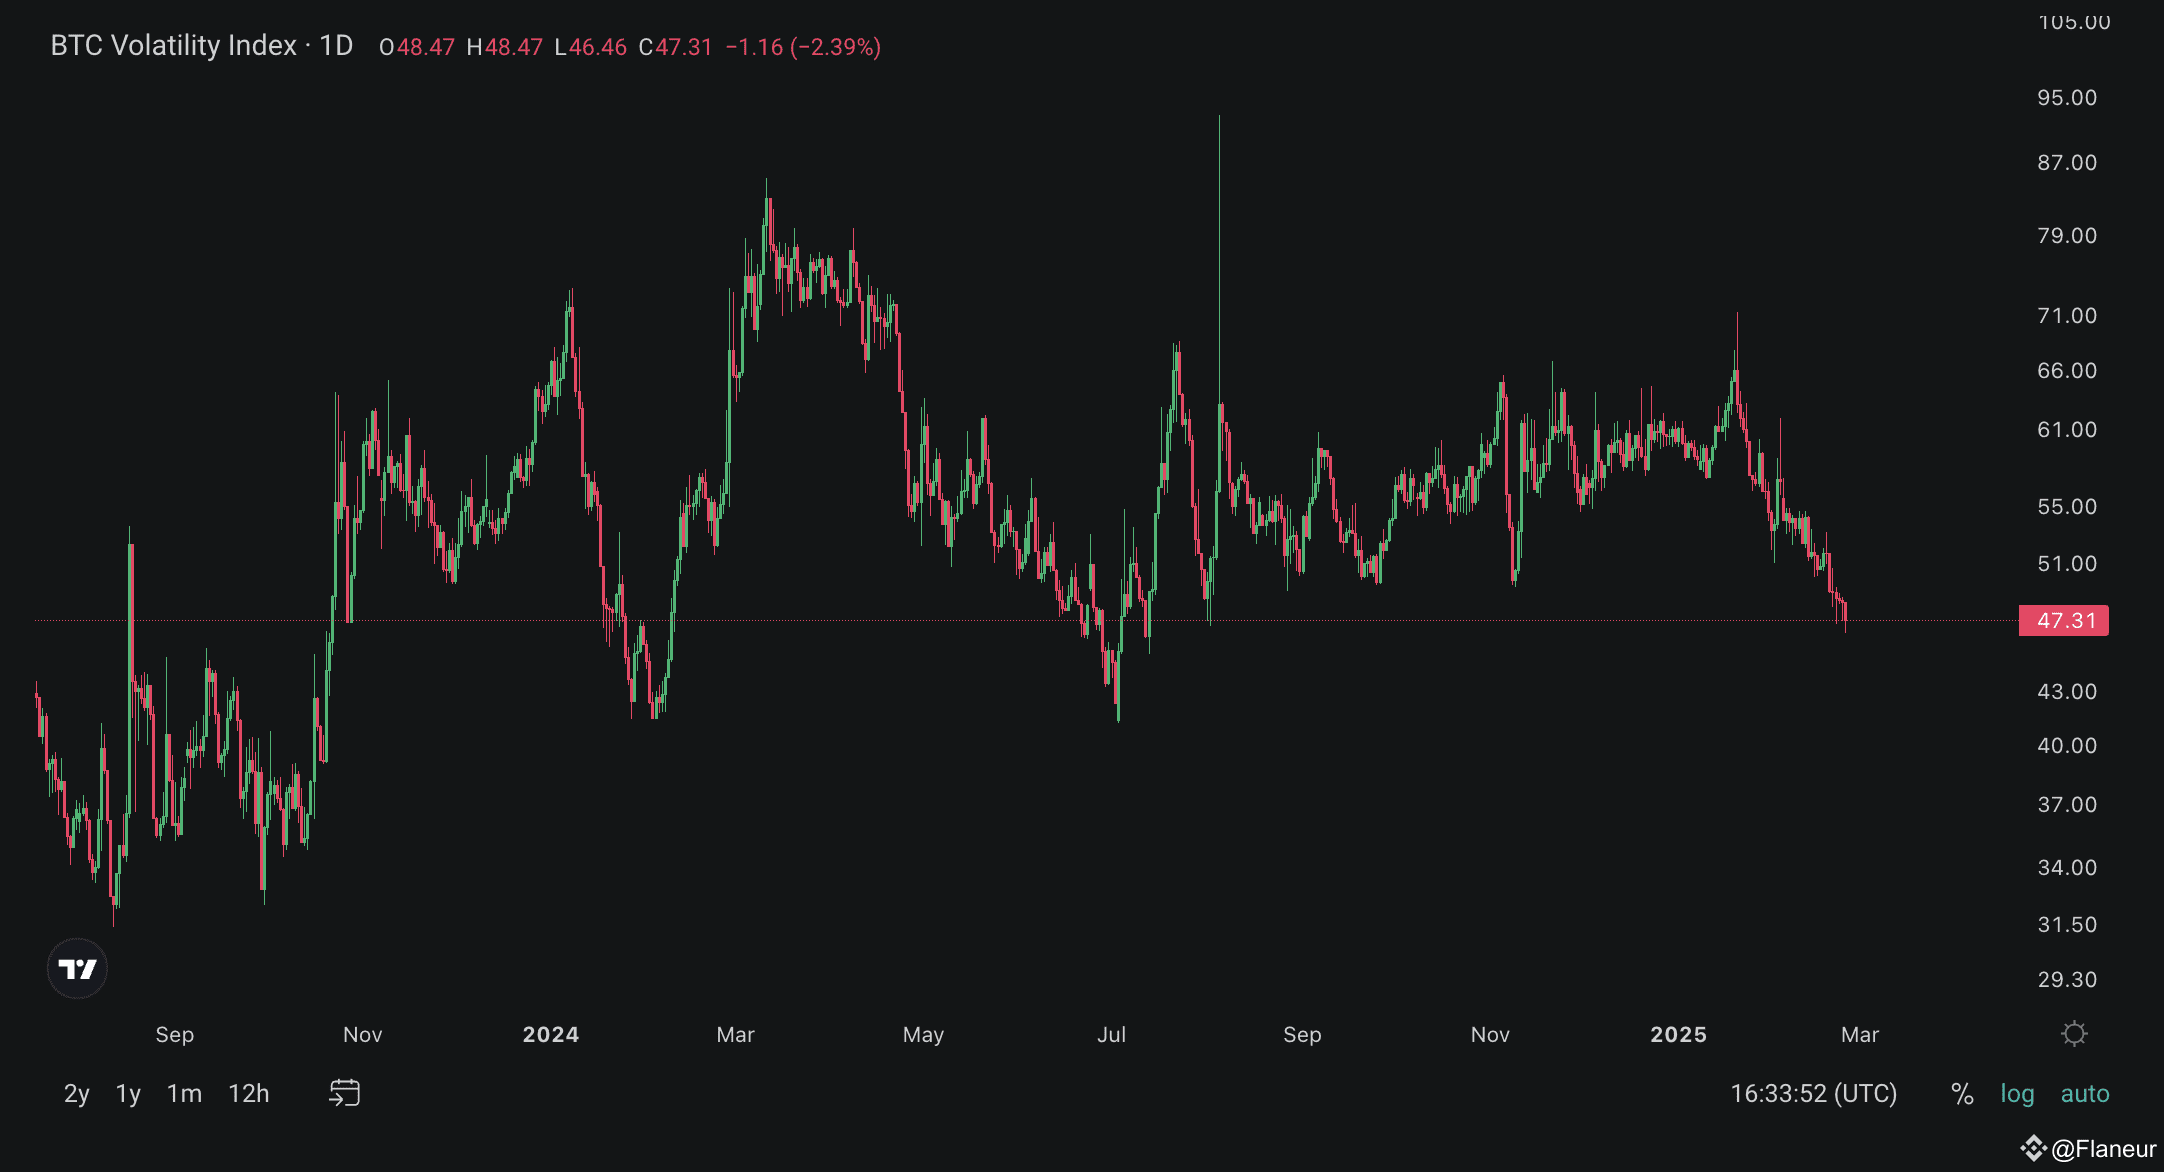
After its weekly opening, Bitcoin closed slightly above its weekly opening with minor movements. Although it attempted to reach 100k, it faced a sharp sell-off from there. The price is still below the monthly opening. The Volatility Index for BTC has reached its lowest level since July 2024. If DVOL remains below 42, we could see significant price movements.

This week's implied volatility is similar to last week, ranging between 82k and 110k. It opened with a sharp sell-off and is currently down by 2.5%. It continues to maintain its wick structure, and volatility is decreasing. If it approaches the 89-91k range, I will consider long positions. However, my primary target is for the price to first reach the 104 area.

The Max Pain level has dropped to a price of 99k. Although call contracts are prevalent, the Put/Call Ratio at 0.75 does not indicate a bullish outlook. Due to the monthly contract closure, contracts worth 5 billion will be closing.

Ethereum has shown similar movements to BTC but with more volatility. It attempted to break the 2850 mark three times but failed. Although it closed above its weekly opening, there was a 6% sell-off today. Similarly, ETH is hovering just above the trend support, making it illogical to buy or sell without a clear support or resistance breakout.

There wasn't much different movement from last week. It would be wise not to buy altcoins without seeing a clear close above the 2850-2900 range. This week's implied volatility range has remained unchanged at 2280-3350. Instead of trading within the 2650-2850 price range, it would be more prudent to wait for breakouts. I am looking for the 2300 area below and the 3200 area above.

This week, we may see much higher volatility in ETH compared to BTC. The total Open Interest for the February 28 contracts is 515k contracts, valued at 1.4 billion dollars. The Max Pain level has dropped to 3000, and while the Put/Call Ratio has risen from 0.51 to 0.56, indicating a bullish market expectation, we are seeing an increase in put contracts. We can say that volatility is approaching in ETH.

ETHBTC
There isn't much change here, but if we are to see upward reactions, we need to see some indicators for a bottom formation. If we see movement above the 0.03 price, I believe it could progress much faster. Otherwise, my thought continues that it will drop to the 0.022 area.

#BTCDipOrRebound #InfiniHacked #SaylorBTCPurchase #ETHPriceWatch #SECStaking


