
#tia
tia
115.5M views
237,795 Discussing
Hot
Latest

·
--
$TIA moves 0.9 percent every single hour. Most traders still size it like it is a sleepy stablecoin
The hourly ATR right now sits at 0.9 percent of the price which is 0.32030 dollars
That means a normal hourly swing touches about 0.003 dollars away from where you enter
If your account holds 1000 dollars and you only want to risk 1 percent on a stop loss placed one ATR away the math is simple
You divide your 10 dollar risk amount by the 0.003 dollar distance to find your exact share count
Guessing your size based on a gut feeling is why accounts bleed out slowly
Open $TIA and set an alert at that level
How do you usually figure out your risk per trade
#TIA #TradingTips
$TIA moves 0.9 percent every single hour. Most traders still size it like it is a sleepy stablecoin
The hourly ATR right now sits at 0.9 percent of the price which is 0.32030 dollars
That means a normal hourly swing touches about 0.003 dollars away from where you enter
If your account holds 1000 dollars and you only want to risk 1 percent on a stop loss placed one ATR away the math is simple
You divide your 10 dollar risk amount by the 0.003 dollar distance to find your exact share count
Guessing your size based on a gut feeling is why accounts bleed out slowly
Open $TIA and set an alert at that level
How do you usually figure out your risk per trade
#TIA #TradingTips
The hourly ATR right now sits at 0.9 percent of the price which is 0.32030 dollars
That means a normal hourly swing touches about 0.003 dollars away from where you enter
If your account holds 1000 dollars and you only want to risk 1 percent on a stop loss placed one ATR away the math is simple
You divide your 10 dollar risk amount by the 0.003 dollar distance to find your exact share count
Guessing your size based on a gut feeling is why accounts bleed out slowly
Open $TIA and set an alert at that level
How do you usually figure out your risk per trade
#TIA #TradingTips
6

·
--
🦈 INSTITUTIONAL ACCUMULATION WATCHLIST: WHY $TIA , $TRB , AND $AR ARE ANCHORING MY 2028 CYCLE STRUCTURE ⚡
Smart money positions long before retail recognizes structural shifts, focusing heavily on fundamental architecture and deep liquidity zones. Assets like $TIA and $TRB are building robust multi-year bases that mirror classic institutional accumulation phases. 📊
We are tracking structural expansion across high-utility networks rather than chasing transient momentum spikes. Integrating these foundational layers into a long-term portfolio creates asymmetric upside as market inefficiencies clear out. 💡
💬 Which of these foundational network assets are you positioning in ahead of the next major macroeconomic liquidity expansion? 👇
⚠️ Not financial advice. Always manage your risk. 🛡️
🏷️ #TIA #SmartMoney #MarketStructure #Crypto #LongTerm
🔥 💎
🦈 INSTITUTIONAL ACCUMULATION WATCHLIST: WHY $TIA , $TRB , AND $AR ARE ANCHORING MY 2028 CYCLE STRUCTURE ⚡
Smart money positions long before retail recognizes structural shifts, focusing heavily on fundamental architecture and deep liquidity zones. Assets like $TIA and $TRB are building robust multi-year bases that mirror classic institutional accumulation phases. 📊
We are tracking structural expansion across high-utility networks rather than chasing transient momentum spikes. Integrating these foundational layers into a long-term portfolio creates asymmetric upside as market inefficiencies clear out. 💡
💬 Which of these foundational network assets are you positioning in ahead of the next major macroeconomic liquidity expansion? 👇
⚠️ Not financial advice. Always manage your risk. 🛡️
🏷️ #TIA #SmartMoney #MarketStructure #Crypto #LongTerm
🔥 💎
Smart money positions long before retail recognizes structural shifts, focusing heavily on fundamental architecture and deep liquidity zones. Assets like $TIA and $TRB are building robust multi-year bases that mirror classic institutional accumulation phases. 📊
We are tracking structural expansion across high-utility networks rather than chasing transient momentum spikes. Integrating these foundational layers into a long-term portfolio creates asymmetric upside as market inefficiencies clear out. 💡
💬 Which of these foundational network assets are you positioning in ahead of the next major macroeconomic liquidity expansion? 👇
⚠️ Not financial advice. Always manage your risk. 🛡️
🏷️ #TIA #SmartMoney #MarketStructure #Crypto #LongTerm
🔥 💎
1
40

🦈 $TIA AND CORE INFRASTRUCTURE PLAYS LOCKED IN FOR THE NEXT EXPANSION CYCLE ⚡
Smart capital avoids chasing every fleeting green candle and instead anchors into heavy-duty infrastructure plays like $TIA and $TRB that are quietly building deep network moats during quiet market consolidation phases. 📊
These asymmetric setups require absolute patience while smart money accumulates structural liquidity before the macro tide shifts decisively upward. Positioning early in proven narratives separates high-conviction players from retail FOMO. 💬 Which of these foundational assets anchors your long-term accumulation bag for the upcoming cycle? 👇
⚠️ Not financial advice. Always manage your risk. 🛡️
🏷️ #TIA #Crypto #Altcoins #LongTerm
🔥 💎
🦈 $TIA AND CORE INFRASTRUCTURE PLAYS LOCKED IN FOR THE NEXT EXPANSION CYCLE ⚡
Smart capital avoids chasing every fleeting green candle and instead anchors into heavy-duty infrastructure plays like $TIA and $TRB that are quietly building deep network moats during quiet market consolidation phases. 📊
These asymmetric setups require absolute patience while smart money accumulates structural liquidity before the macro tide shifts decisively upward. Positioning early in proven narratives separates high-conviction players from retail FOMO. 💬 Which of these foundational assets anchors your long-term accumulation bag for the upcoming cycle? 👇
⚠️ Not financial advice. Always manage your risk. 🛡️
🏷️ #TIA #Crypto #Altcoins #LongTerm
🔥 💎
Smart capital avoids chasing every fleeting green candle and instead anchors into heavy-duty infrastructure plays like $TIA and $TRB that are quietly building deep network moats during quiet market consolidation phases. 📊
These asymmetric setups require absolute patience while smart money accumulates structural liquidity before the macro tide shifts decisively upward. Positioning early in proven narratives separates high-conviction players from retail FOMO. 💬 Which of these foundational assets anchors your long-term accumulation bag for the upcoming cycle? 👇
⚠️ Not financial advice. Always manage your risk. 🛡️
🏷️ #TIA #Crypto #Altcoins #LongTerm
🔥 💎
25


·
--
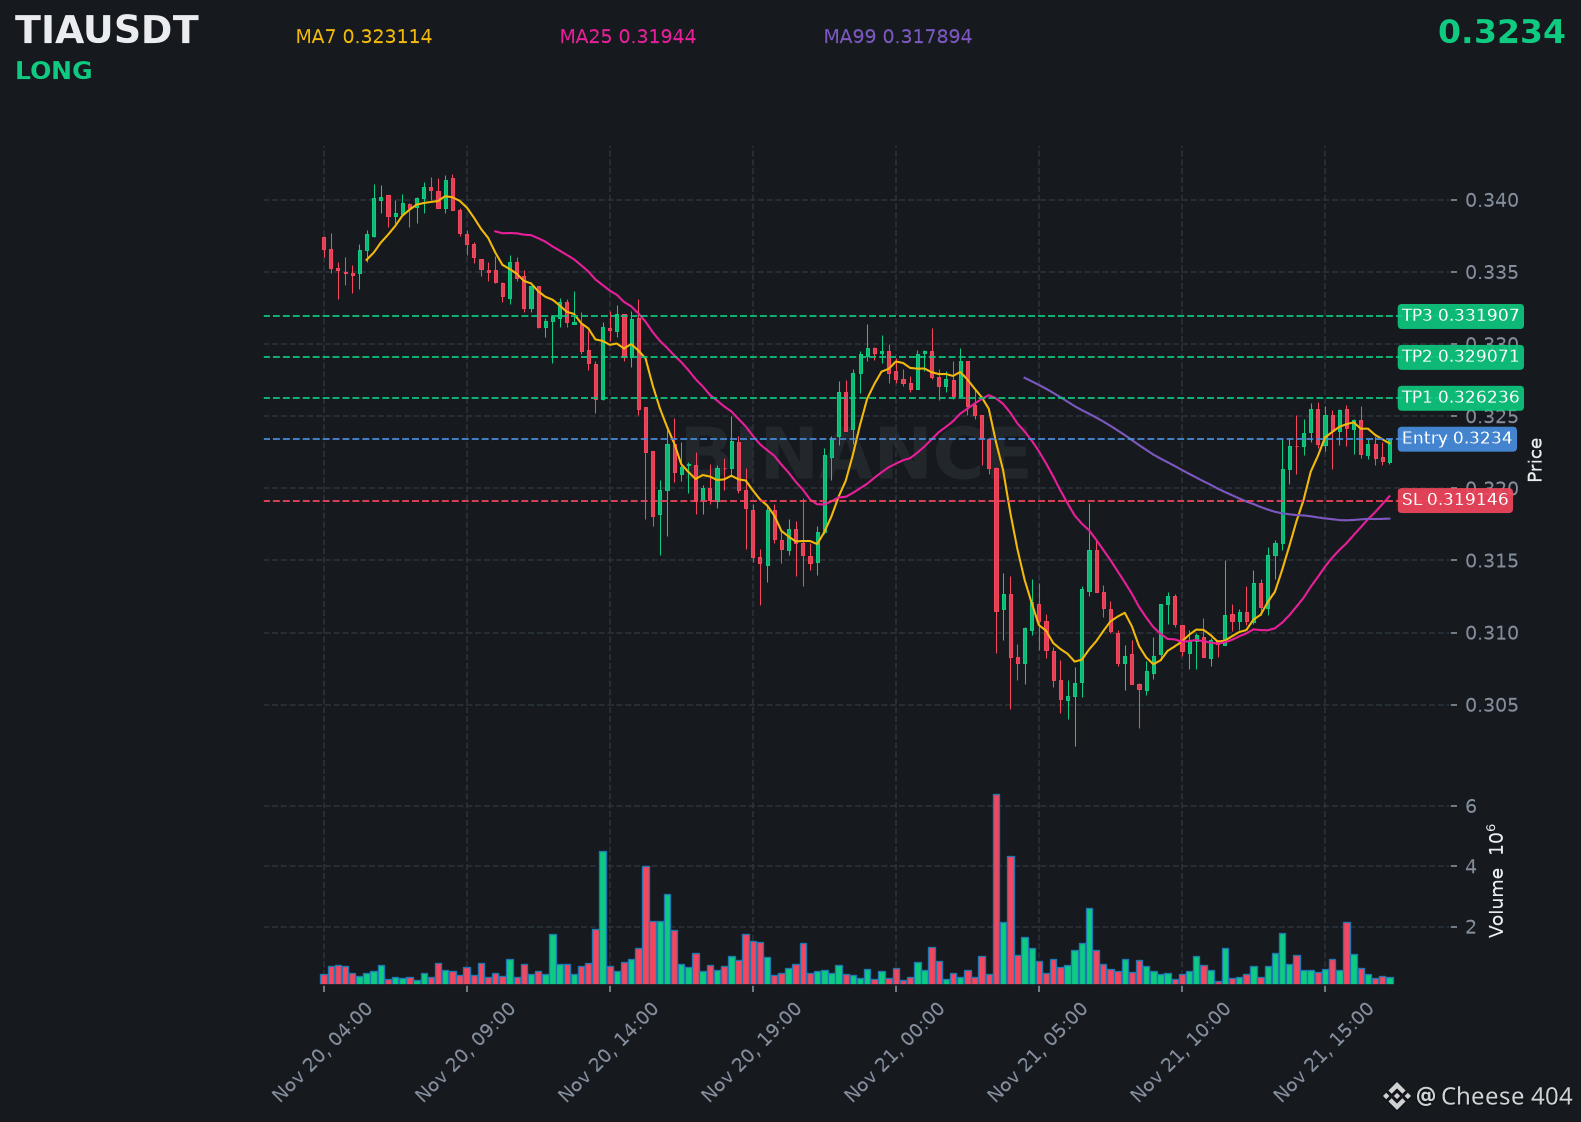
$TIA looks primed to keep climbing, with bulls firmly in control of the trend.
📍 @ 0.3234 | Volume: 0.11M USD
RSI 60 | EMA20: 0.321026 USD
📈 Trade Plan:
📈 Entry: 0.322549 – 0.324251
🛑 Stop Loss: 0.319146
🎯 TP1: 0.326236
🎯 TP2: 0.329071
🎯 TP3: 0.331907
Waiting for a retest, then riding the uptrend.
👉 $TIA 👈 Catch it
#TIA
$TIA looks primed to keep climbing, with bulls firmly in control of the trend.
📍 @ 0.3234 | Volume: 0.11M USD
RSI 60 | EMA20: 0.321026 USD
📈 Trade Plan:
📈 Entry: 0.322549 – 0.324251
🛑 Stop Loss: 0.319146
🎯 TP1: 0.326236
🎯 TP2: 0.329071
🎯 TP3: 0.331907
Waiting for a retest, then riding the uptrend.
👉 $TIA 👈 Catch it
#TIA
📍 @ 0.3234 | Volume: 0.11M USD
RSI 60 | EMA20: 0.321026 USD
📈 Trade Plan:
📈 Entry: 0.322549 – 0.324251
🛑 Stop Loss: 0.319146
🎯 TP1: 0.326236
🎯 TP2: 0.329071
🎯 TP3: 0.331907
Waiting for a retest, then riding the uptrend.
👉 $TIA 👈 Catch it
#TIA
104

$TIA: Does Visual Calm Impact Technical Objectivity?
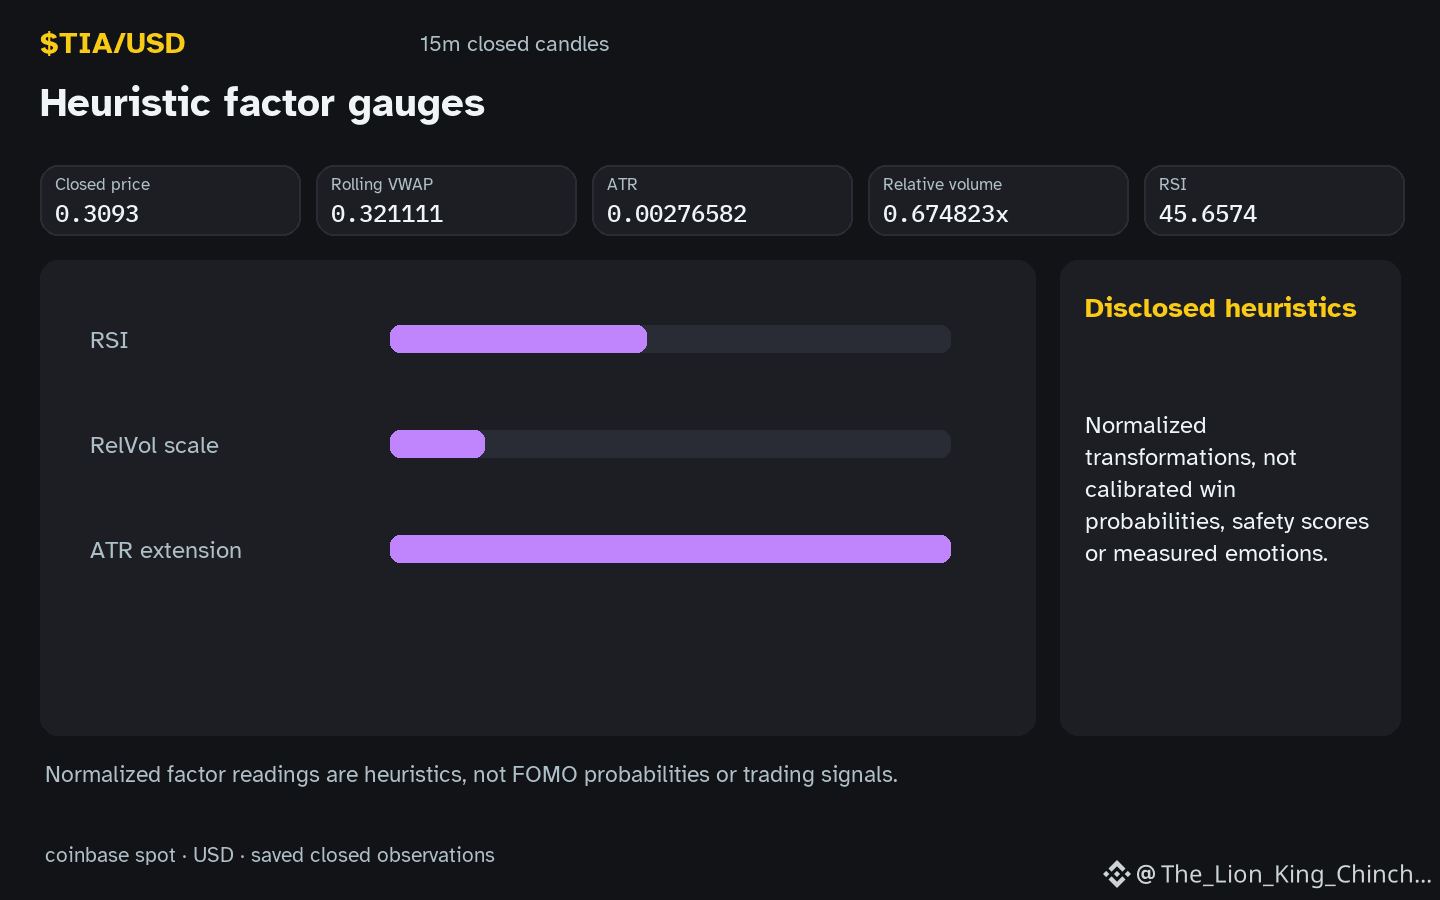
$TIA: Does a clean chart layout make a price analysis more trustworthy or simply more persuasive? The current movement in $TIA shows a daily change of -7.42293% while staying inside its recorded range.
Visual calm is often used as a stylistic trust signal. A layout without clutter or aggressive formatting can imply a professional and objective perspective. However, this aesthetic can be a shortcut that bypasses critical thinking. When a post lacks distracting emojis, readers might assume the logic is more rigorous, even if the underlying data is limited. This is a hypothetical mechanism where style replaces substance in public discourse.
Consider the general dilemma of Write to Earn incentives. When creators are incentivized to post frequently, they may adopt a specific visual style to signal authority quickly. Distinguishing evidence from persuasion requires looking past the presentation. For example, $TIA currently shows an RSI of 45.7 and hourly volume that is not above baseline. These are neutral facts, regardless of how they are formatted.
A counterexample is a cluttered chart that actually identifies a high-probability range. If the visual style is messy, do we dismiss the evidence? A useful way to reassess is to check if the logic holds when the price moves past resistance at 0.3184. If the interpretation fails to adapt to new candle closes, the initial visual calm was likely just a persuasive tool. ⚖️
Probabilistic market research, not a recommendation or guaranteed return.
#TIA #CryptoCommunity #CryptoLearning
$TIA : Does Visual Calm Impact Technical Objectivity?
$TIA : Does a clean chart layout make a price analysis more trustworthy or simply more persuasive? The current movement in $TIA shows a daily change of -7.42293% while staying inside its recorded range.
Visual calm is often used as a stylistic trust signal. A layout without clutter or aggressive formatting can imply a professional and objective perspective. However, this aesthetic can be a shortcut that bypasses critical thinking. When a post lacks distracting emojis, readers might assume the logic is more rigorous, even if the underlying data is limited. This is a hypothetical mechanism where style replaces substance in public discourse.
Consider the general dilemma of Write to Earn incentives. When creators are incentivized to post frequently, they may adopt a specific visual style to signal authority quickly. Distinguishing evidence from persuasion requires looking past the presentation. For example, $TIA currently shows an RSI of 45.7 and hourly volume that is not above baseline. These are neutral facts, regardless of how they are formatted.
A counterexample is a cluttered chart that actually identifies a high-probability range. If the visual style is messy, do we dismiss the evidence? A useful way to reassess is to check if the logic holds when the price moves past resistance at 0.3184. If the interpretation fails to adapt to new candle closes, the initial visual calm was likely just a persuasive tool. ⚖️
Probabilistic market research, not a recommendation or guaranteed return.
#TIA #CryptoCommunity #CryptoLearning
$TIA : Does a clean chart layout make a price analysis more trustworthy or simply more persuasive? The current movement in $TIA shows a daily change of -7.42293% while staying inside its recorded range.
Visual calm is often used as a stylistic trust signal. A layout without clutter or aggressive formatting can imply a professional and objective perspective. However, this aesthetic can be a shortcut that bypasses critical thinking. When a post lacks distracting emojis, readers might assume the logic is more rigorous, even if the underlying data is limited. This is a hypothetical mechanism where style replaces substance in public discourse.
Consider the general dilemma of Write to Earn incentives. When creators are incentivized to post frequently, they may adopt a specific visual style to signal authority quickly. Distinguishing evidence from persuasion requires looking past the presentation. For example, $TIA currently shows an RSI of 45.7 and hourly volume that is not above baseline. These are neutral facts, regardless of how they are formatted.
A counterexample is a cluttered chart that actually identifies a high-probability range. If the visual style is messy, do we dismiss the evidence? A useful way to reassess is to check if the logic holds when the price moves past resistance at 0.3184. If the interpretation fails to adapt to new candle closes, the initial visual calm was likely just a persuasive tool. ⚖️
Probabilistic market research, not a recommendation or guaranteed return.
#TIA #CryptoCommunity #CryptoLearning
57

TIA, INIT and ERA: Infrastructure Tokens Face a High Volatility Market TestThe latest Binance spot market data shows a pressure filled session for TIA, INIT and ERA. These three assets sit within the broader blockchain infrastructure narrative, yet they represent different approaches to scaling, modular development and network architecture. Their current price action highlights an important market reality: strong technology narratives can attract lasting attention, but short term token performance still depends heavily on liquidity, sentiment and risk appetite.
TIA, the native token of Celestia, is trading at $0.3087, down 7.60% from its 24 hour opening price of $0.3341. The market reached a high of $0.3365 and a low of $0.3024, producing an 11.28% range. Quoted trading volume is approximately $4.28M.
Celestia remains one of the most recognised names in the modular blockchain conversation. Its focus on data availability aims to help developers launch specialised blockchain environments without requiring every chain to handle every function independently. This is a structural narrative rather than a short lived trend, because demand for scalable and flexible blockchain infrastructure continues to shape the long term development of the industry.
The latest TIA move shows that sellers have held control during the current session. However, the relatively contained range compared with INIT suggests that TIA is experiencing a more measured repricing. For market participants, the main signal is whether demand can return after the token tested the $0.3024 session low. Sustained volume and stable price behaviour would show that the market is absorbing supply, while weaker liquidity could leave TIA more exposed to broader altcoin volatility.
INIT, the token of Initia, is trading at $0.08584, down 14.04% from its 24 hour opening price of $0.09986. It moved between $0.10119 and $0.08451, resulting in a 19.74% trading range, the widest among these three assets. Quoted trading volume stands near $3.27M.
Initia is positioned around a modular ecosystem model that connects Layer 1 capabilities with application specific networks. This design reflects a growing market focus on tailored blockchain environments, where developers can build applications with more control over execution, user experience and economic models. The opportunity is meaningful, but the segment is also competitive, and token valuations can shift quickly when traders reassess growth expectations.
INIT’s current decline and wide range show that volatility is elevated. A move of this scale can bring attention from momentum focused traders, but it also increases the risk of rapid reversals and slippage. The key factor is whether participation remains consistent after the initial selling wave. Price movement without persistent volume can become fragile, particularly in infrastructure assets where long term adoption narratives may develop more slowly than short term market expectations.
ERA, the native token of Caldera, is currently trading at $0.0719, down 7.11% from its opening price of $0.0774. The session high was $0.0794 and the low was $0.0688, creating a 15.41% range. Quoted trading volume is approximately $3.24M.
Caldera is associated with rollup infrastructure and the development of application specific blockchain environments. Its role in the expanding rollup ecosystem places ERA in a segment closely connected to scalability, interoperability and chain customisation. As blockchain projects seek more efficient ways to scale applications, infrastructure providers may remain relevant, but token performance can still diverge sharply from technological progress.
ERA’s current structure reflects a market that is actively repricing risk. The token has moved below its session open, yet it remains above the day’s low, showing that buyers and sellers are still engaging around the current range. Traders watching ERA will likely focus on liquidity conditions, ecosystem activity and whether the infrastructure sector can regain momentum alongside broader market demand.
The important takeaway is that TIA, INIT and ERA are not interchangeable. TIA represents data availability within the modular blockchain thesis. INIT reflects an ecosystem focused on modular application chains. ERA provides exposure to rollup infrastructure and customisable blockchain deployment. Each has its own adoption path, token supply dynamics and liquidity profile.
The latest session is a reminder that narrative strength alone does not eliminate volatility. TIA’s decline is comparatively measured, INIT is experiencing the most aggressive price discovery, and ERA is navigating a volatile but active market. For anyone assessing these assets, tracking volume persistence, market depth, wider crypto sentiment and project execution is more informative than reacting solely to a one day percentage move.
High volatility can create active trading conditions, but it also raises execution risk. Independent research and a clear understanding of each asset’s role remain essential.
#TIA #INIT #ERA #CryptoMarket #Blockchain
$TIA
{spot}(TIAUSDT)
$INIT
{spot}(INITUSDT)
$ERA
{spot}(ERAUSDT)
TIA, INIT and ERA: Infrastructure Tokens Face a High Volatility Market Test
The latest Binance spot market data shows a pressure filled session for TIA, INIT and ERA. These three assets sit within the broader blockchain infrastructure narrative, yet they represent different approaches to scaling, modular development and network architecture. Their current price action highlights an important market reality: strong technology narratives can attract lasting attention, but short term token performance still depends heavily on liquidity, sentiment and risk appetite.
TIA, the native token of Celestia, is trading at $0.3087, down 7.60% from its 24 hour opening price of $0.3341. The market reached a high of $0.3365 and a low of $0.3024, producing an 11.28% range. Quoted trading volume is approximately $4.28M.
Celestia remains one of the most recognised names in the modular blockchain conversation. Its focus on data availability aims to help developers launch specialised blockchain environments without requiring every chain to handle every function independently. This is a structural narrative rather than a short lived trend, because demand for scalable and flexible blockchain infrastructure continues to shape the long term development of the industry.
The latest TIA move shows that sellers have held control during the current session. However, the relatively contained range compared with INIT suggests that TIA is experiencing a more measured repricing. For market participants, the main signal is whether demand can return after the token tested the $0.3024 session low. Sustained volume and stable price behaviour would show that the market is absorbing supply, while weaker liquidity could leave TIA more exposed to broader altcoin volatility.
INIT, the token of Initia, is trading at $0.08584, down 14.04% from its 24 hour opening price of $0.09986. It moved between $0.10119 and $0.08451, resulting in a 19.74% trading range, the widest among these three assets. Quoted trading volume stands near $3.27M.
Initia is positioned around a modular ecosystem model that connects Layer 1 capabilities with application specific networks. This design reflects a growing market focus on tailored blockchain environments, where developers can build applications with more control over execution, user experience and economic models. The opportunity is meaningful, but the segment is also competitive, and token valuations can shift quickly when traders reassess growth expectations.
INIT’s current decline and wide range show that volatility is elevated. A move of this scale can bring attention from momentum focused traders, but it also increases the risk of rapid reversals and slippage. The key factor is whether participation remains consistent after the initial selling wave. Price movement without persistent volume can become fragile, particularly in infrastructure assets where long term adoption narratives may develop more slowly than short term market expectations.
ERA, the native token of Caldera, is currently trading at $0.0719, down 7.11% from its opening price of $0.0774. The session high was $0.0794 and the low was $0.0688, creating a 15.41% range. Quoted trading volume is approximately $3.24M.
Caldera is associated with rollup infrastructure and the development of application specific blockchain environments. Its role in the expanding rollup ecosystem places ERA in a segment closely connected to scalability, interoperability and chain customisation. As blockchain projects seek more efficient ways to scale applications, infrastructure providers may remain relevant, but token performance can still diverge sharply from technological progress.
ERA’s current structure reflects a market that is actively repricing risk. The token has moved below its session open, yet it remains above the day’s low, showing that buyers and sellers are still engaging around the current range. Traders watching ERA will likely focus on liquidity conditions, ecosystem activity and whether the infrastructure sector can regain momentum alongside broader market demand.
The important takeaway is that TIA, INIT and ERA are not interchangeable. TIA represents data availability within the modular blockchain thesis. INIT reflects an ecosystem focused on modular application chains. ERA provides exposure to rollup infrastructure and customisable blockchain deployment. Each has its own adoption path, token supply dynamics and liquidity profile.
The latest session is a reminder that narrative strength alone does not eliminate volatility. TIA’s decline is comparatively measured, INIT is experiencing the most aggressive price discovery, and ERA is navigating a volatile but active market. For anyone assessing these assets, tracking volume persistence, market depth, wider crypto sentiment and project execution is more informative than reacting solely to a one day percentage move.
High volatility can create active trading conditions, but it also raises execution risk. Independent research and a clear understanding of each asset’s role remain essential.
#TIA #INIT #ERA #CryptoMarket #Blockchain
$TIA
$INIT
$ERA
TIA, the native token of Celestia, is trading at $0.3087, down 7.60% from its 24 hour opening price of $0.3341. The market reached a high of $0.3365 and a low of $0.3024, producing an 11.28% range. Quoted trading volume is approximately $4.28M.
Celestia remains one of the most recognised names in the modular blockchain conversation. Its focus on data availability aims to help developers launch specialised blockchain environments without requiring every chain to handle every function independently. This is a structural narrative rather than a short lived trend, because demand for scalable and flexible blockchain infrastructure continues to shape the long term development of the industry.
The latest TIA move shows that sellers have held control during the current session. However, the relatively contained range compared with INIT suggests that TIA is experiencing a more measured repricing. For market participants, the main signal is whether demand can return after the token tested the $0.3024 session low. Sustained volume and stable price behaviour would show that the market is absorbing supply, while weaker liquidity could leave TIA more exposed to broader altcoin volatility.
INIT, the token of Initia, is trading at $0.08584, down 14.04% from its 24 hour opening price of $0.09986. It moved between $0.10119 and $0.08451, resulting in a 19.74% trading range, the widest among these three assets. Quoted trading volume stands near $3.27M.
Initia is positioned around a modular ecosystem model that connects Layer 1 capabilities with application specific networks. This design reflects a growing market focus on tailored blockchain environments, where developers can build applications with more control over execution, user experience and economic models. The opportunity is meaningful, but the segment is also competitive, and token valuations can shift quickly when traders reassess growth expectations.
INIT’s current decline and wide range show that volatility is elevated. A move of this scale can bring attention from momentum focused traders, but it also increases the risk of rapid reversals and slippage. The key factor is whether participation remains consistent after the initial selling wave. Price movement without persistent volume can become fragile, particularly in infrastructure assets where long term adoption narratives may develop more slowly than short term market expectations.
ERA, the native token of Caldera, is currently trading at $0.0719, down 7.11% from its opening price of $0.0774. The session high was $0.0794 and the low was $0.0688, creating a 15.41% range. Quoted trading volume is approximately $3.24M.
Caldera is associated with rollup infrastructure and the development of application specific blockchain environments. Its role in the expanding rollup ecosystem places ERA in a segment closely connected to scalability, interoperability and chain customisation. As blockchain projects seek more efficient ways to scale applications, infrastructure providers may remain relevant, but token performance can still diverge sharply from technological progress.
ERA’s current structure reflects a market that is actively repricing risk. The token has moved below its session open, yet it remains above the day’s low, showing that buyers and sellers are still engaging around the current range. Traders watching ERA will likely focus on liquidity conditions, ecosystem activity and whether the infrastructure sector can regain momentum alongside broader market demand.
The important takeaway is that TIA, INIT and ERA are not interchangeable. TIA represents data availability within the modular blockchain thesis. INIT reflects an ecosystem focused on modular application chains. ERA provides exposure to rollup infrastructure and customisable blockchain deployment. Each has its own adoption path, token supply dynamics and liquidity profile.
The latest session is a reminder that narrative strength alone does not eliminate volatility. TIA’s decline is comparatively measured, INIT is experiencing the most aggressive price discovery, and ERA is navigating a volatile but active market. For anyone assessing these assets, tracking volume persistence, market depth, wider crypto sentiment and project execution is more informative than reacting solely to a one day percentage move.
High volatility can create active trading conditions, but it also raises execution risk. Independent research and a clear understanding of each asset’s role remain essential.
#TIA #INIT #ERA #CryptoMarket #Blockchain
$TIA
$INIT
$ERA
21

·
--
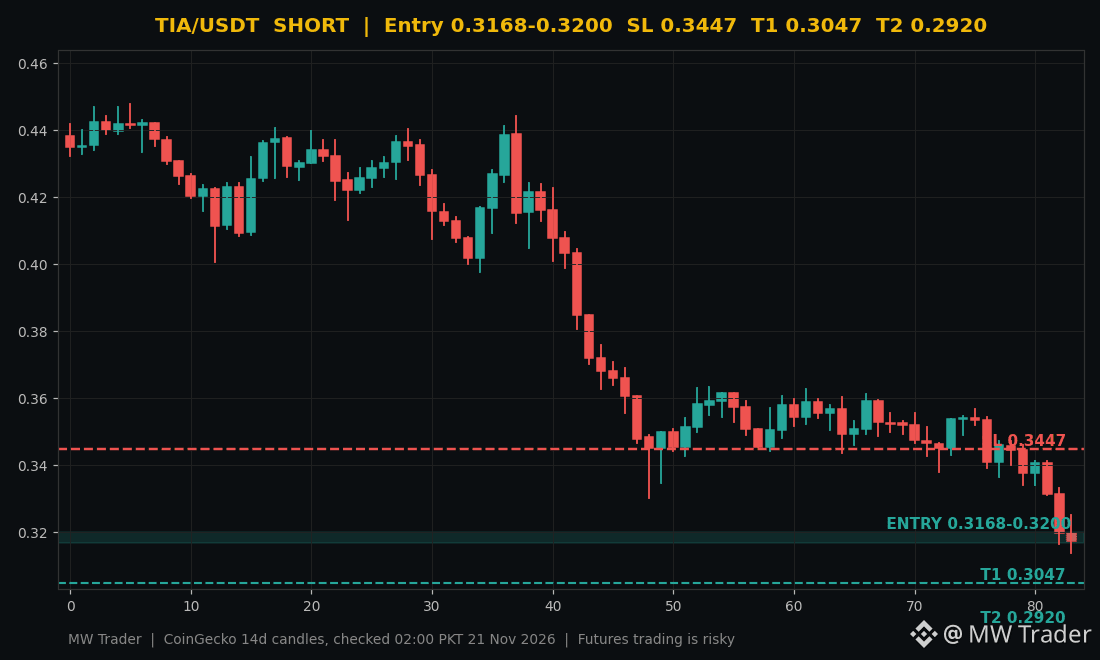
$TIA #TIA 📉 Celestia is down 8.39 percent today and I am shorting the bounce.
Direction: SHORT 🔴
Entry zone: 0.3168 to 0.3200
Stop loss: 0.3447
Target 1: 0.3047
Target 2: 0.2920
Celestia is trading near $0.3174 after losing 8.39 percent in 24 hours, according to CoinGecko, and the live price sits right inside my entry zone of 0.3168 to 0.3200. The coin fell from a 24 hour high of $0.3464 to a low of $0.3137 while Bitcoin broke below $60,000, and it is holding near its daily low with no sign of buyers stepping in yet. My plan is short the zone, stop above $0.3447, take the first profit at $0.3047, with $0.2920 as the second target. 📉
Would you short TIA here, or wait for a bounce back toward $0.3447 first? 🤔
Futures trading is risky, trade small, manage risk, do your own research. ⚠️
Follow for more trades.
#Celestia #Crypto #FuturesTrading #TradingSignals
$TIA #TIA 📉 Celestia is down 8.39 percent today and I am shorting the bounce.
Direction: SHORT 🔴
Entry zone: 0.3168 to 0.3200
Stop loss: 0.3447
Target 1: 0.3047
Target 2: 0.2920
Celestia is trading near $0.3174 after losing 8.39 percent in 24 hours, according to CoinGecko, and the live price sits right inside my entry zone of 0.3168 to 0.3200. The coin fell from a 24 hour high of $0.3464 to a low of $0.3137 while Bitcoin broke below $60,000, and it is holding near its daily low with no sign of buyers stepping in yet. My plan is short the zone, stop above $0.3447, take the first profit at $0.3047, with $0.2920 as the second target. 📉
Would you short TIA here, or wait for a bounce back toward $0.3447 first? 🤔
Futures trading is risky, trade small, manage risk, do your own research. ⚠️
Follow for more trades.
#Celestia #Crypto #FuturesTrading #TradingSignals
Direction: SHORT 🔴
Entry zone: 0.3168 to 0.3200
Stop loss: 0.3447
Target 1: 0.3047
Target 2: 0.2920
Celestia is trading near $0.3174 after losing 8.39 percent in 24 hours, according to CoinGecko, and the live price sits right inside my entry zone of 0.3168 to 0.3200. The coin fell from a 24 hour high of $0.3464 to a low of $0.3137 while Bitcoin broke below $60,000, and it is holding near its daily low with no sign of buyers stepping in yet. My plan is short the zone, stop above $0.3447, take the first profit at $0.3047, with $0.2920 as the second target. 📉
Would you short TIA here, or wait for a bounce back toward $0.3447 first? 🤔
Futures trading is risky, trade small, manage risk, do your own research. ⚠️
Follow for more trades.
#Celestia #Crypto #FuturesTrading #TradingSignals
25

·
--
$TIA
Celestia focuses on modular blockchain infrastructure, separating data availability from other network functions. This approach gives developers more flexibility when building chains. Its progress will depend on real demand for data availability and the growth of applications using its technology.
#tia #celestia #ModularBlockchain
$TIA
Celestia focuses on modular blockchain infrastructure, separating data availability from other network functions. This approach gives developers more flexibility when building chains. Its progress will depend on real demand for data availability and the growth of applications using its technology.
#tia #celestia #ModularBlockchain
Celestia focuses on modular blockchain infrastructure, separating data availability from other network functions. This approach gives developers more flexibility when building chains. Its progress will depend on real demand for data availability and the growth of applications using its technology.
#tia #celestia #ModularBlockchain
1
595

Verified

Article
🌚$TIA — THE MODULAR BLOCKSPACE BET👀A roughly $342 MILLION cryptocurrency.
⠀
Nearly 993 MILLION tokens circulating.
⠀
Infrastructure designed to supply data availability to other blockchains.
⠀
And a token trading approximately 98.4% below its all-time high.
⠀
But here's the contradiction.
⠀
Celestia wants blockspace to become dramatically cheaper and more abundant.
⠀
$TIA investors still need that abundant capacity to generate meaningful economic demand.
⠀
More data does not automatically mean more revenue.
⠀
Is $TIA an overlooked bet on the next generation of blockchain infrastructure?
⠀
Or does cheap blockspace remain a difficult business for token holders?
⠀
Let's examine the numbers.
⠀
01 | WHAT IS CELESTIA?
⠀
Celestia is a modular data availability network.
⠀
Its central function is helping other chains publish data that participants can verify is available.
⠀
Execution and settlement can operate elsewhere.
⠀
This lets developers build application-specific chains without recreating every infrastructure component.
⠀
Data availability sampling allows light nodes to check availability without downloading entire blocks.
⠀
However, availability is different from permanent archival storage.
⠀
Applications still need to consider how older data remains retrievable.
⠀
The investment thesis is that many independent chains could purchase a shared infrastructure service.
⠀
The challenge is making that service economically valuable at scale.
⠀
02 | THE NUMBERS THAT MATTER
⠀
November 20, 2026 snapshot:
⠀
TIA Price: ~$0.3450
Market Cap: ~$342.5M
Reported FDV: ~$407.8M
Circulating Supply: ~992.7M TIA
Current Total Supply: ~1.182B TIA
Circulating / Current Total Supply: ~84.0%
Genesis Supply: 1B TIA
Maximum Supply: No fixed cap
24H Trading Volume: ~$18.7M
All-Time High: ~$20.91
Decline From ATH: ~98.4%
⠀
NETWORK ECONOMICS:
⠀
DefiLlama Tracked Chain Fees, 24H: ~$46
Post-v6 Inflation Framework: ~2.5% initially, declining annually
Long-Term Scheduled Inflation Floor: 1.5%
⠀
Exchange trading volume is not customer spending on Celestia.
⠀
The reported FDV uses currently issued supply.
⠀
It does not include every token that could be created through future inflation.
⠀
03 | THE CUSTOMER IS ANOTHER CHAIN
⠀
Celestia's customer relationship differs from that of a consumer trading application.
⠀
Rollups and infrastructure operators purchase data availability.
⠀
Their users may never interact directly with Celestia.
⠀
That can create efficient distribution.
⠀
One successful customer could bring substantial recurring demand.
⠀
But it also makes customer quality important.
⠀
A list of integrations does not reveal how many customers publish data consistently.
⠀
Investors should examine recurring paying namespaces, spending concentration, and customer retention.
⠀
Ten experimental chains can be less valuable than one durable production customer.
⠀
04 | THE FIBRE CHANGE
⠀
Fibre materially expands Celestia's technical ambitions.
⠀
The team reported an end-to-end benchmark sustaining approximately 3.07 terabits per second across 120 validators.
⠀
Its October 29 announcement also confirmed that Fibre had gone live on mainnet the previous week.
⠀
That moves the discussion beyond an entirely future roadmap.
⠀
However, benchmark throughput is capacity.
⠀
It is not customer utilization.
⠀
Nor is it fee revenue.
⠀
Fibre separates bulk data distribution from the commitments recorded onchain.
⠀
The investment question is whether applications actually need and pay for that capacity.
⠀
05 | THE VOYAGER OPPORTUNITY
⠀
Celestia introduced Voyager as an execution architecture targeting high-volume payments.
⠀
Its initial benchmark reported 21 million transactions per second.
⠀
The proposed market includes agents making small payments for content, data, and services.
⠀
That is a plausible reason applications might demand much more bandwidth.
⠀
But a benchmark payment is not a paying customer.
⠀
And the value transferred by an application is not automatically Celestia revenue.
⠀
The useful evidence would be production applications, recurring funded usage, and fees attributable to their data requirements.
⠀
The commercial opportunity remains separate from the performance demonstration.
⠀
06 | HOW TIA CAPTURES VALUE
⠀
Publishing conventional blobs on Celestia requires fees denominated in TIA.
⠀
That creates a direct utility connection.
⠀
TIA also supports staking and governance.
⠀
Developers can choose to use TIA as their own chain's gas token.
⠀
That additional role is optional.
⠀
A rollup using Celestia does not automatically require every user to hold TIA.
⠀
An operator can acquire the tokens needed for its publishing costs.
⠀
Consequently, the relevant demand is the amount of TIA customers need to purchase, hold, or commit.
⠀
An integration count alone cannot establish that amount.
⠀
07 | THE CHEAP BLOCKSPACE PARADOX
⠀
Lower costs make Celestia more attractive to developers.
⠀
But lower revenue per unit means usage must grow enough to compensate.
⠀
Compression can reduce the data required for each transaction.
⠀
Batching can spread publishing costs across more users.
⠀
These improvements benefit applications.
⠀
They can also weaken the relationship between application transaction counts and Celestia fees.
⠀
The latest tracked daily chain fees were approximately $46.
⠀
That is a single-day observation, not a complete revenue forecast or independently audited Fibre business statement.
⠀
Nevertheless, it illustrates why a capacity headline cannot substitute for evidence of monetization.
⠀
08 | THE INFLATION FRAMEWORK CHANGED
⠀
Repeating Celestia's original 8% inflation schedule would misdescribe its current framework.
⠀
The July 2025 Lotus upgrade reduced inflation to approximately 5%.
⠀
The November 2025 v6 upgrade reduced it again to approximately 2.5%.
⠀
The revised schedule decreases the rate by 6.7% annually toward a 1.5% floor.
⠀
These changes reduce ongoing issuance relative to the original design.
⠀
They do not create a fixed supply.
⠀
Lower inflation means slower dilution.
⠀
Deflation would require total supply to decline.
⠀
Those are different outcomes.
⠀
09 | THE UNLOCK STORY HAS ALSO CHANGED
⠀
The original vesting schedule placed early-backer completion in October 2025 and initial core-contributor completion in October 2026.
⠀
R&D and ecosystem vesting continues into October 2027.
⠀
The remaining scheduled R&D release is approximately 183,562 TIA daily.
⠀
That means old narratives about every initial investor allocation still vesting are outdated.
⠀
However, unlocked tokens can remain in custody and be distributed later.
⠀
Transferability is different from selling.
⠀
Staking issuance is also separate from allocation unlocks.
⠀
The relevant analysis combines actual circulation changes, treasury distributions, and new issuance without counting the same tokens twice.
⠀
10 | THE VALUATION QUESTION
⠀
Using approximately 1.182 billion current total tokens:
⠀
$0.50 TIA implies ~$591M total-supply valuation.
$1.00 implies ~$1.18B.
$2.00 implies ~$2.36B.
$5.00 implies ~$5.91B.
$10.00 implies ~$11.82B.
$20.91 implies ~$24.72B.
⠀
These are valuation illustrations, not price targets.
⠀
Future issuance changes the denominator.
⠀
The old price high is therefore not a shortcut to fair value.
⠀
Likewise, conventional DeFi TVL is a weak standalone measure for a network selling data availability.
⠀
A better valuation discussion starts with recurring customer spending, competitive pricing, and the security costs required to deliver the service.
⠀
11 | THE BULL AND BEAR CASE
⠀
THE BULL CASE:
⠀
Fibre attracts applications that existing infrastructure struggles to serve.
⠀
Production customers publish substantially more paid data.
⠀
Demand grows faster than improvements reduce cost per transaction.
⠀
Customer spending becomes broader and more durable.
⠀
And reduced issuance improves the balance between token demand and supply.
⠀
THE BEAR CASE:
⠀
Technical capacity grows faster than commercial demand.
⠀
Competing data availability services compress pricing.
⠀
Customers optimize away much of their publishing expense.
⠀
Activity remains concentrated in a few subsidized applications.
⠀
And issuance continues while fee demand stays small.
⠀
The network can become more useful without the token becoming proportionately more valuable.
⠀
12 | THE FINAL VERDICT
⠀
Celestia has a specific product and a clear customer category.
⠀
Fibre is now a deployed development.
⠀
The inflation framework is materially less aggressive than the original schedule.
⠀
And much of the initial backer and contributor vesting period has passed.
⠀
Those changes deserve recognition.
⠀
But the central investment question remains unresolved.
⠀
Can cheap, abundant data availability produce enough recurring economic demand to support TIA's valuation?
⠀
My assessment:
⠀
TIA is a bet on future paid infrastructure demand whose commercial evidence must catch up with its technical progress.
⠀
A roughly $342 million market capitalization creates a different starting valuation from the previous cycle.
⠀
It does not prove the token is cheap.
⠀
More capacity creates an opportunity.
⠀
Retained customers create recurring usage.
⠀
Paid publishing creates TIA demand.
⠀
Demand relative to issuance determines how much of that progress benefits holders.
⠀
Bookmark this analysis before the next modular infrastructure rotation.
⠀
Which has the strongest long-term data availability thesis?
⠀
TIA , $AVAIL , or $EIGEN?
⠀
And can Celestia turn abundant blockspace into sustainable token value?
⠀
Drop your view below.
#tia #Avail #eigen
🌚$TIA — THE MODULAR BLOCKSPACE BET👀
A roughly $342 MILLION cryptocurrency.
⠀
Nearly 993 MILLION tokens circulating.
⠀
Infrastructure designed to supply data availability to other blockchains.
⠀
And a token trading approximately 98.4% below its all-time high.
⠀
But here's the contradiction.
⠀
Celestia wants blockspace to become dramatically cheaper and more abundant.
⠀
$TIA investors still need that abundant capacity to generate meaningful economic demand.
⠀
More data does not automatically mean more revenue.
⠀
Is $TIA an overlooked bet on the next generation of blockchain infrastructure?
⠀
Or does cheap blockspace remain a difficult business for token holders?
⠀
Let's examine the numbers.
⠀
01 | WHAT IS CELESTIA?
⠀
Celestia is a modular data availability network.
⠀
Its central function is helping other chains publish data that participants can verify is available.
⠀
Execution and settlement can operate elsewhere.
⠀
This lets developers build application-specific chains without recreating every infrastructure component.
⠀
Data availability sampling allows light nodes to check availability without downloading entire blocks.
⠀
However, availability is different from permanent archival storage.
⠀
Applications still need to consider how older data remains retrievable.
⠀
The investment thesis is that many independent chains could purchase a shared infrastructure service.
⠀
The challenge is making that service economically valuable at scale.
⠀
02 | THE NUMBERS THAT MATTER
⠀
November 20, 2026 snapshot:
⠀
TIA Price: ~$0.3450
Market Cap: ~$342.5M
Reported FDV: ~$407.8M
Circulating Supply: ~992.7M TIA
Current Total Supply: ~1.182B TIA
Circulating / Current Total Supply: ~84.0%
Genesis Supply: 1B TIA
Maximum Supply: No fixed cap
24H Trading Volume: ~$18.7M
All-Time High: ~$20.91
Decline From ATH: ~98.4%
⠀
NETWORK ECONOMICS:
⠀
DefiLlama Tracked Chain Fees, 24H: ~$46
Post-v6 Inflation Framework: ~2.5% initially, declining annually
Long-Term Scheduled Inflation Floor: 1.5%
⠀
Exchange trading volume is not customer spending on Celestia.
⠀
The reported FDV uses currently issued supply.
⠀
It does not include every token that could be created through future inflation.
⠀
03 | THE CUSTOMER IS ANOTHER CHAIN
⠀
Celestia's customer relationship differs from that of a consumer trading application.
⠀
Rollups and infrastructure operators purchase data availability.
⠀
Their users may never interact directly with Celestia.
⠀
That can create efficient distribution.
⠀
One successful customer could bring substantial recurring demand.
⠀
But it also makes customer quality important.
⠀
A list of integrations does not reveal how many customers publish data consistently.
⠀
Investors should examine recurring paying namespaces, spending concentration, and customer retention.
⠀
Ten experimental chains can be less valuable than one durable production customer.
⠀
04 | THE FIBRE CHANGE
⠀
Fibre materially expands Celestia's technical ambitions.
⠀
The team reported an end-to-end benchmark sustaining approximately 3.07 terabits per second across 120 validators.
⠀
Its October 29 announcement also confirmed that Fibre had gone live on mainnet the previous week.
⠀
That moves the discussion beyond an entirely future roadmap.
⠀
However, benchmark throughput is capacity.
⠀
It is not customer utilization.
⠀
Nor is it fee revenue.
⠀
Fibre separates bulk data distribution from the commitments recorded onchain.
⠀
The investment question is whether applications actually need and pay for that capacity.
⠀
05 | THE VOYAGER OPPORTUNITY
⠀
Celestia introduced Voyager as an execution architecture targeting high-volume payments.
⠀
Its initial benchmark reported 21 million transactions per second.
⠀
The proposed market includes agents making small payments for content, data, and services.
⠀
That is a plausible reason applications might demand much more bandwidth.
⠀
But a benchmark payment is not a paying customer.
⠀
And the value transferred by an application is not automatically Celestia revenue.
⠀
The useful evidence would be production applications, recurring funded usage, and fees attributable to their data requirements.
⠀
The commercial opportunity remains separate from the performance demonstration.
⠀
06 | HOW TIA CAPTURES VALUE
⠀
Publishing conventional blobs on Celestia requires fees denominated in TIA.
⠀
That creates a direct utility connection.
⠀
TIA also supports staking and governance.
⠀
Developers can choose to use TIA as their own chain's gas token.
⠀
That additional role is optional.
⠀
A rollup using Celestia does not automatically require every user to hold TIA.
⠀
An operator can acquire the tokens needed for its publishing costs.
⠀
Consequently, the relevant demand is the amount of TIA customers need to purchase, hold, or commit.
⠀
An integration count alone cannot establish that amount.
⠀
07 | THE CHEAP BLOCKSPACE PARADOX
⠀
Lower costs make Celestia more attractive to developers.
⠀
But lower revenue per unit means usage must grow enough to compensate.
⠀
Compression can reduce the data required for each transaction.
⠀
Batching can spread publishing costs across more users.
⠀
These improvements benefit applications.
⠀
They can also weaken the relationship between application transaction counts and Celestia fees.
⠀
The latest tracked daily chain fees were approximately $46.
⠀
That is a single-day observation, not a complete revenue forecast or independently audited Fibre business statement.
⠀
Nevertheless, it illustrates why a capacity headline cannot substitute for evidence of monetization.
⠀
08 | THE INFLATION FRAMEWORK CHANGED
⠀
Repeating Celestia's original 8% inflation schedule would misdescribe its current framework.
⠀
The July 2025 Lotus upgrade reduced inflation to approximately 5%.
⠀
The November 2025 v6 upgrade reduced it again to approximately 2.5%.
⠀
The revised schedule decreases the rate by 6.7% annually toward a 1.5% floor.
⠀
These changes reduce ongoing issuance relative to the original design.
⠀
They do not create a fixed supply.
⠀
Lower inflation means slower dilution.
⠀
Deflation would require total supply to decline.
⠀
Those are different outcomes.
⠀
09 | THE UNLOCK STORY HAS ALSO CHANGED
⠀
The original vesting schedule placed early-backer completion in October 2025 and initial core-contributor completion in October 2026.
⠀
R&D and ecosystem vesting continues into October 2027.
⠀
The remaining scheduled R&D release is approximately 183,562 TIA daily.
⠀
That means old narratives about every initial investor allocation still vesting are outdated.
⠀
However, unlocked tokens can remain in custody and be distributed later.
⠀
Transferability is different from selling.
⠀
Staking issuance is also separate from allocation unlocks.
⠀
The relevant analysis combines actual circulation changes, treasury distributions, and new issuance without counting the same tokens twice.
⠀
10 | THE VALUATION QUESTION
⠀
Using approximately 1.182 billion current total tokens:
⠀
$0.50 TIA implies ~$591M total-supply valuation.
$1.00 implies ~$1.18B.
$2.00 implies ~$2.36B.
$5.00 implies ~$5.91B.
$10.00 implies ~$11.82B.
$20.91 implies ~$24.72B.
⠀
These are valuation illustrations, not price targets.
⠀
Future issuance changes the denominator.
⠀
The old price high is therefore not a shortcut to fair value.
⠀
Likewise, conventional DeFi TVL is a weak standalone measure for a network selling data availability.
⠀
A better valuation discussion starts with recurring customer spending, competitive pricing, and the security costs required to deliver the service.
⠀
11 | THE BULL AND BEAR CASE
⠀
THE BULL CASE:
⠀
Fibre attracts applications that existing infrastructure struggles to serve.
⠀
Production customers publish substantially more paid data.
⠀
Demand grows faster than improvements reduce cost per transaction.
⠀
Customer spending becomes broader and more durable.
⠀
And reduced issuance improves the balance between token demand and supply.
⠀
THE BEAR CASE:
⠀
Technical capacity grows faster than commercial demand.
⠀
Competing data availability services compress pricing.
⠀
Customers optimize away much of their publishing expense.
⠀
Activity remains concentrated in a few subsidized applications.
⠀
And issuance continues while fee demand stays small.
⠀
The network can become more useful without the token becoming proportionately more valuable.
⠀
12 | THE FINAL VERDICT
⠀
Celestia has a specific product and a clear customer category.
⠀
Fibre is now a deployed development.
⠀
The inflation framework is materially less aggressive than the original schedule.
⠀
And much of the initial backer and contributor vesting period has passed.
⠀
Those changes deserve recognition.
⠀
But the central investment question remains unresolved.
⠀
Can cheap, abundant data availability produce enough recurring economic demand to support TIA's valuation?
⠀
My assessment:
⠀
TIA is a bet on future paid infrastructure demand whose commercial evidence must catch up with its technical progress.
⠀
A roughly $342 million market capitalization creates a different starting valuation from the previous cycle.
⠀
It does not prove the token is cheap.
⠀
More capacity creates an opportunity.
⠀
Retained customers create recurring usage.
⠀
Paid publishing creates TIA demand.
⠀
Demand relative to issuance determines how much of that progress benefits holders.
⠀
Bookmark this analysis before the next modular infrastructure rotation.
⠀
Which has the strongest long-term data availability thesis?
⠀
TIA , $AVAIL , or $EIGEN?
⠀
And can Celestia turn abundant blockspace into sustainable token value?
⠀
Drop your view below.
#tia #Avail #eigen
⠀
Nearly 993 MILLION tokens circulating.
⠀
Infrastructure designed to supply data availability to other blockchains.
⠀
And a token trading approximately 98.4% below its all-time high.
⠀
But here's the contradiction.
⠀
Celestia wants blockspace to become dramatically cheaper and more abundant.
⠀
$TIA investors still need that abundant capacity to generate meaningful economic demand.
⠀
More data does not automatically mean more revenue.
⠀
Is $TIA an overlooked bet on the next generation of blockchain infrastructure?
⠀
Or does cheap blockspace remain a difficult business for token holders?
⠀
Let's examine the numbers.
⠀
01 | WHAT IS CELESTIA?
⠀
Celestia is a modular data availability network.
⠀
Its central function is helping other chains publish data that participants can verify is available.
⠀
Execution and settlement can operate elsewhere.
⠀
This lets developers build application-specific chains without recreating every infrastructure component.
⠀
Data availability sampling allows light nodes to check availability without downloading entire blocks.
⠀
However, availability is different from permanent archival storage.
⠀
Applications still need to consider how older data remains retrievable.
⠀
The investment thesis is that many independent chains could purchase a shared infrastructure service.
⠀
The challenge is making that service economically valuable at scale.
⠀
02 | THE NUMBERS THAT MATTER
⠀
November 20, 2026 snapshot:
⠀
TIA Price: ~$0.3450
Market Cap: ~$342.5M
Reported FDV: ~$407.8M
Circulating Supply: ~992.7M TIA
Current Total Supply: ~1.182B TIA
Circulating / Current Total Supply: ~84.0%
Genesis Supply: 1B TIA
Maximum Supply: No fixed cap
24H Trading Volume: ~$18.7M
All-Time High: ~$20.91
Decline From ATH: ~98.4%
⠀
NETWORK ECONOMICS:
⠀
DefiLlama Tracked Chain Fees, 24H: ~$46
Post-v6 Inflation Framework: ~2.5% initially, declining annually
Long-Term Scheduled Inflation Floor: 1.5%
⠀
Exchange trading volume is not customer spending on Celestia.
⠀
The reported FDV uses currently issued supply.
⠀
It does not include every token that could be created through future inflation.
⠀
03 | THE CUSTOMER IS ANOTHER CHAIN
⠀
Celestia's customer relationship differs from that of a consumer trading application.
⠀
Rollups and infrastructure operators purchase data availability.
⠀
Their users may never interact directly with Celestia.
⠀
That can create efficient distribution.
⠀
One successful customer could bring substantial recurring demand.
⠀
But it also makes customer quality important.
⠀
A list of integrations does not reveal how many customers publish data consistently.
⠀
Investors should examine recurring paying namespaces, spending concentration, and customer retention.
⠀
Ten experimental chains can be less valuable than one durable production customer.
⠀
04 | THE FIBRE CHANGE
⠀
Fibre materially expands Celestia's technical ambitions.
⠀
The team reported an end-to-end benchmark sustaining approximately 3.07 terabits per second across 120 validators.
⠀
Its October 29 announcement also confirmed that Fibre had gone live on mainnet the previous week.
⠀
That moves the discussion beyond an entirely future roadmap.
⠀
However, benchmark throughput is capacity.
⠀
It is not customer utilization.
⠀
Nor is it fee revenue.
⠀
Fibre separates bulk data distribution from the commitments recorded onchain.
⠀
The investment question is whether applications actually need and pay for that capacity.
⠀
05 | THE VOYAGER OPPORTUNITY
⠀
Celestia introduced Voyager as an execution architecture targeting high-volume payments.
⠀
Its initial benchmark reported 21 million transactions per second.
⠀
The proposed market includes agents making small payments for content, data, and services.
⠀
That is a plausible reason applications might demand much more bandwidth.
⠀
But a benchmark payment is not a paying customer.
⠀
And the value transferred by an application is not automatically Celestia revenue.
⠀
The useful evidence would be production applications, recurring funded usage, and fees attributable to their data requirements.
⠀
The commercial opportunity remains separate from the performance demonstration.
⠀
06 | HOW TIA CAPTURES VALUE
⠀
Publishing conventional blobs on Celestia requires fees denominated in TIA.
⠀
That creates a direct utility connection.
⠀
TIA also supports staking and governance.
⠀
Developers can choose to use TIA as their own chain's gas token.
⠀
That additional role is optional.
⠀
A rollup using Celestia does not automatically require every user to hold TIA.
⠀
An operator can acquire the tokens needed for its publishing costs.
⠀
Consequently, the relevant demand is the amount of TIA customers need to purchase, hold, or commit.
⠀
An integration count alone cannot establish that amount.
⠀
07 | THE CHEAP BLOCKSPACE PARADOX
⠀
Lower costs make Celestia more attractive to developers.
⠀
But lower revenue per unit means usage must grow enough to compensate.
⠀
Compression can reduce the data required for each transaction.
⠀
Batching can spread publishing costs across more users.
⠀
These improvements benefit applications.
⠀
They can also weaken the relationship between application transaction counts and Celestia fees.
⠀
The latest tracked daily chain fees were approximately $46.
⠀
That is a single-day observation, not a complete revenue forecast or independently audited Fibre business statement.
⠀
Nevertheless, it illustrates why a capacity headline cannot substitute for evidence of monetization.
⠀
08 | THE INFLATION FRAMEWORK CHANGED
⠀
Repeating Celestia's original 8% inflation schedule would misdescribe its current framework.
⠀
The July 2025 Lotus upgrade reduced inflation to approximately 5%.
⠀
The November 2025 v6 upgrade reduced it again to approximately 2.5%.
⠀
The revised schedule decreases the rate by 6.7% annually toward a 1.5% floor.
⠀
These changes reduce ongoing issuance relative to the original design.
⠀
They do not create a fixed supply.
⠀
Lower inflation means slower dilution.
⠀
Deflation would require total supply to decline.
⠀
Those are different outcomes.
⠀
09 | THE UNLOCK STORY HAS ALSO CHANGED
⠀
The original vesting schedule placed early-backer completion in October 2025 and initial core-contributor completion in October 2026.
⠀
R&D and ecosystem vesting continues into October 2027.
⠀
The remaining scheduled R&D release is approximately 183,562 TIA daily.
⠀
That means old narratives about every initial investor allocation still vesting are outdated.
⠀
However, unlocked tokens can remain in custody and be distributed later.
⠀
Transferability is different from selling.
⠀
Staking issuance is also separate from allocation unlocks.
⠀
The relevant analysis combines actual circulation changes, treasury distributions, and new issuance without counting the same tokens twice.
⠀
10 | THE VALUATION QUESTION
⠀
Using approximately 1.182 billion current total tokens:
⠀
$0.50 TIA implies ~$591M total-supply valuation.
$1.00 implies ~$1.18B.
$2.00 implies ~$2.36B.
$5.00 implies ~$5.91B.
$10.00 implies ~$11.82B.
$20.91 implies ~$24.72B.
⠀
These are valuation illustrations, not price targets.
⠀
Future issuance changes the denominator.
⠀
The old price high is therefore not a shortcut to fair value.
⠀
Likewise, conventional DeFi TVL is a weak standalone measure for a network selling data availability.
⠀
A better valuation discussion starts with recurring customer spending, competitive pricing, and the security costs required to deliver the service.
⠀
11 | THE BULL AND BEAR CASE
⠀
THE BULL CASE:
⠀
Fibre attracts applications that existing infrastructure struggles to serve.
⠀
Production customers publish substantially more paid data.
⠀
Demand grows faster than improvements reduce cost per transaction.
⠀
Customer spending becomes broader and more durable.
⠀
And reduced issuance improves the balance between token demand and supply.
⠀
THE BEAR CASE:
⠀
Technical capacity grows faster than commercial demand.
⠀
Competing data availability services compress pricing.
⠀
Customers optimize away much of their publishing expense.
⠀
Activity remains concentrated in a few subsidized applications.
⠀
And issuance continues while fee demand stays small.
⠀
The network can become more useful without the token becoming proportionately more valuable.
⠀
12 | THE FINAL VERDICT
⠀
Celestia has a specific product and a clear customer category.
⠀
Fibre is now a deployed development.
⠀
The inflation framework is materially less aggressive than the original schedule.
⠀
And much of the initial backer and contributor vesting period has passed.
⠀
Those changes deserve recognition.
⠀
But the central investment question remains unresolved.
⠀
Can cheap, abundant data availability produce enough recurring economic demand to support TIA's valuation?
⠀
My assessment:
⠀
TIA is a bet on future paid infrastructure demand whose commercial evidence must catch up with its technical progress.
⠀
A roughly $342 million market capitalization creates a different starting valuation from the previous cycle.
⠀
It does not prove the token is cheap.
⠀
More capacity creates an opportunity.
⠀
Retained customers create recurring usage.
⠀
Paid publishing creates TIA demand.
⠀
Demand relative to issuance determines how much of that progress benefits holders.
⠀
Bookmark this analysis before the next modular infrastructure rotation.
⠀
Which has the strongest long-term data availability thesis?
⠀
TIA , $AVAIL , or $EIGEN?
⠀
And can Celestia turn abundant blockspace into sustainable token value?
⠀
Drop your view below.
#tia #Avail #eigen
BitXenMaster:
tremendous
1
1
915
·
--
$TIA has one level that matters today at $0.35740
Right now $TIA trades at $0.33760 sitting 5.9 percent below that high
An hourly close above there flips the local momentum fast
A rejection keeps the pressure on with $0.33230 holding underneath as support
Break or reject? 👀
#TIA #PriceAction
$TIA has one level that matters today at $0.35740
Right now $TIA trades at $0.33760 sitting 5.9 percent below that high
An hourly close above there flips the local momentum fast
A rejection keeps the pressure on with $0.33230 holding underneath as support
Break or reject? 👀
#TIA #PriceAction
Right now $TIA trades at $0.33760 sitting 5.9 percent below that high
An hourly close above there flips the local momentum fast
A rejection keeps the pressure on with $0.33230 holding underneath as support
Break or reject? 👀
#TIA #PriceAction
7

·
--
【2026-11-23 01:00 Market Update】
📈 $NEAR $2.9940 +4.76%
📈 $TIA $0.3337 +3.51%
📈 $OP $0.0718 +2.72%
NEAR continues to rally on rising volume, breaking through key resistance. TIA is also edging up, while OP is steadily breaking out—this move is an open book! You’ll kick yourself if you miss it, so get on board now! NEAR target: $3.5, TIA target: $0.4, OP target: $0.08—first come, first served! Enter now, take profit at $3.2, stop loss at $2.8, and lock in a sure win!
#快讯 $NEAR #TIA #Celestia #Optimism #Tomorrow's Wealth Secret
Take action—stop hesitating. Now is the best time to enter!
【2026-11-23 01:00 Market Update】
📈 $NEAR $2.9940 +4.76%
📈 $TIA $0.3337 +3.51%
📈 $OP $0.0718 +2.72%
NEAR continues to rally on rising volume, breaking through key resistance. TIA is also edging up, while OP is steadily breaking out—this move is an open book! You’ll kick yourself if you miss it, so get on board now! NEAR target: $3.5, TIA target: $0.4, OP target: $0.08—first come, first served! Enter now, take profit at $3.2, stop loss at $2.8, and lock in a sure win!
#快讯 $NEAR #TIA #Celestia #Optimism #Tomorrow's Wealth Secret
Take action—stop hesitating. Now is the best time to enter!
📈 $NEAR $2.9940 +4.76%
📈 $TIA $0.3337 +3.51%
📈 $OP $0.0718 +2.72%
NEAR continues to rally on rising volume, breaking through key resistance. TIA is also edging up, while OP is steadily breaking out—this move is an open book! You’ll kick yourself if you miss it, so get on board now! NEAR target: $3.5, TIA target: $0.4, OP target: $0.08—first come, first served! Enter now, take profit at $3.2, stop loss at $2.8, and lock in a sure win!
#快讯 $NEAR #TIA #Celestia #Optimism #Tomorrow's Wealth Secret
Take action—stop hesitating. Now is the best time to enter!

·
--
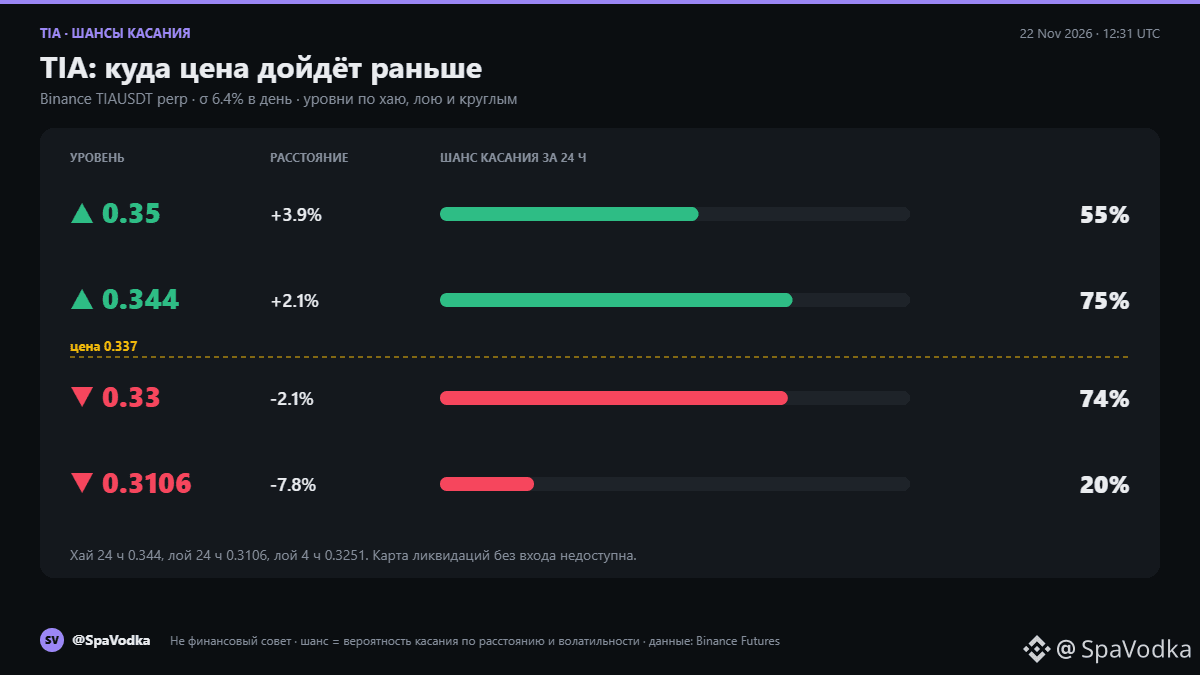
$TIA 0.337 is rising: up 8.4% in 24 hours, already up 8.5% from the low of 0.3106.
What I see: open interest is up 1.8% in 24 hours and 2.8% over 3 hours; the rise is happening with only a small increase in positions. There are 1.05 long accounts for every short account, and top traders favor longs by 1.40. Market buys were strong two hours ago (1.35, 1.14), but in the last hour they were at 0.97. Funding is negative at 0.002%.
What I think: there’s about a 75% chance of touching the 0.344 high within 24 hours, about 55% of reaching the round-number level of 0.35, about 74% of returning to 0.33, and only 20% of reaching the low of 0.3106. ENA is rising at the same pace, up 7.1%.
What would change my mind: if TIA drops below 0.3251 (the low of the last 4 hours), the bounce is broken, and 0.33 becomes more likely than 0.35.
I’ll check this evening to see how it played out. Follow me to see the score.
Not financial advice.
Which comes first: 0.35 or 0.33?
#TIA #криптовалюта #Трейдинг
{future}(TIAUSDT)
{future}(BTCUSDT)
{future}(ENAUSDT)
$TIA 0.337 is rising: up 8.4% in 24 hours, already up 8.5% from the low of 0.3106.
What I see: open interest is up 1.8% in 24 hours and 2.8% over 3 hours; the rise is happening with only a small increase in positions. There are 1.05 long accounts for every short account, and top traders favor longs by 1.40. Market buys were strong two hours ago (1.35, 1.14), but in the last hour they were at 0.97. Funding is negative at 0.002%.
What I think: there’s about a 75% chance of touching the 0.344 high within 24 hours, about 55% of reaching the round-number level of 0.35, about 74% of returning to 0.33, and only 20% of reaching the low of 0.3106. ENA is rising at the same pace, up 7.1%.
What would change my mind: if TIA drops below 0.3251 (the low of the last 4 hours), the bounce is broken, and 0.33 becomes more likely than 0.35.
I’ll check this evening to see how it played out. Follow me to see the score.
Not financial advice.
Which comes first: 0.35 or 0.33?
#TIA #криптовалюта #Трейдинг
What I see: open interest is up 1.8% in 24 hours and 2.8% over 3 hours; the rise is happening with only a small increase in positions. There are 1.05 long accounts for every short account, and top traders favor longs by 1.40. Market buys were strong two hours ago (1.35, 1.14), but in the last hour they were at 0.97. Funding is negative at 0.002%.
What I think: there’s about a 75% chance of touching the 0.344 high within 24 hours, about 55% of reaching the round-number level of 0.35, about 74% of returning to 0.33, and only 20% of reaching the low of 0.3106. ENA is rising at the same pace, up 7.1%.
What would change my mind: if TIA drops below 0.3251 (the low of the last 4 hours), the bounce is broken, and 0.33 becomes more likely than 0.35.
I’ll check this evening to see how it played out. Follow me to see the score.
Not financial advice.
Which comes first: 0.35 or 0.33?
#TIA #криптовалюта #Трейдинг
76

·
--
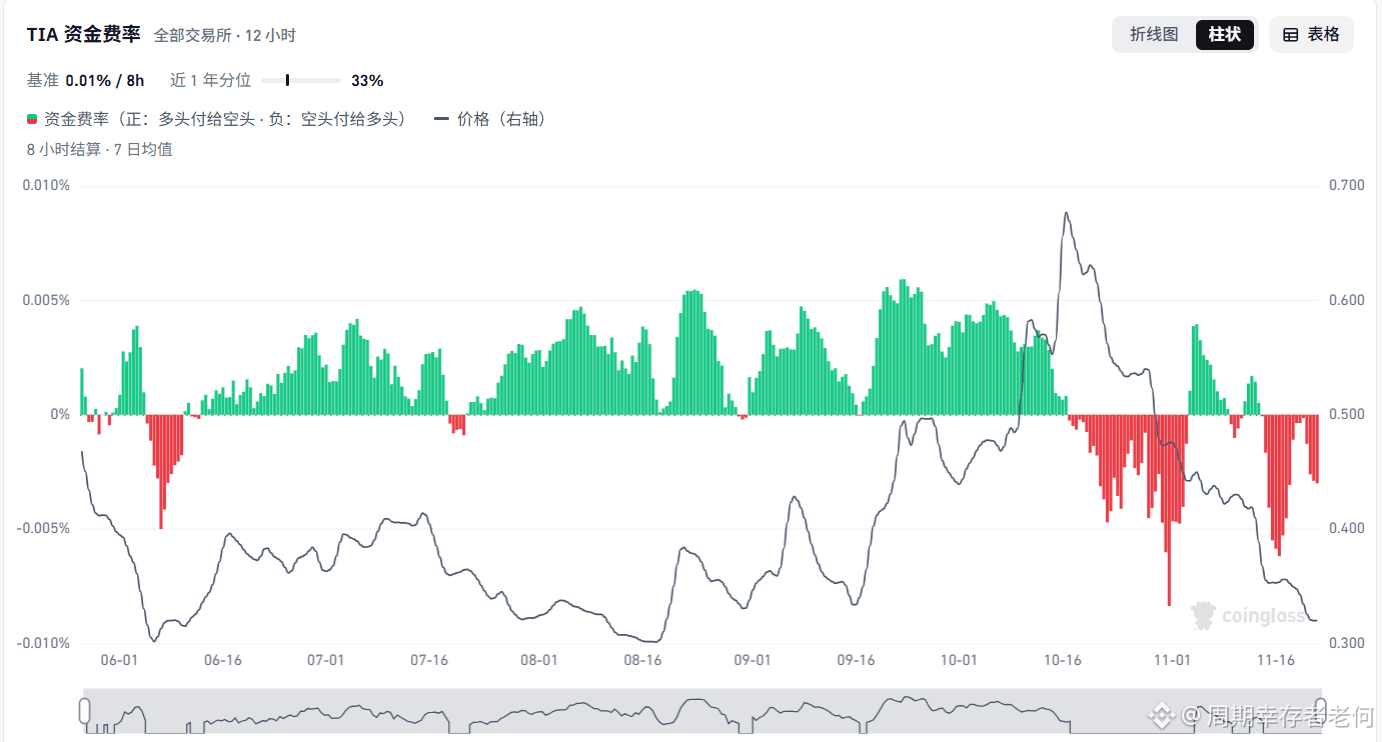
#tia Modular blockchains are still generating buzz, so why has the token price barely moved?
Current reference price: $0.3198
24H: +3.23%
TIA has a distinctive technical narrative, but changes in token supply are also a factor that shouldn’t be overlooked when trading.
In the short term, I’d first watch to see whether the daily chart stops making new lows, then check whether trading volume continues to increase during a rebound.
Lao He thinks TIA’s biggest problem isn’t that its story hasn’t been told well enough, but whether the market is willing to keep paying for it.
A sector may have a bright future, but that doesn’t mean every token will make its holders money.
Lao He will continue to monitor the market in real time and share specific trades and key take-profit levels in the chatroom.
#tia #celestia #模块化 #全球股市创三年来最长连跌,投资者避险情绪升温
#tia Modular blockchains are still generating buzz, so why has the token price barely moved?
Current reference price: $0.3198
24H: +3.23%
TIA has a distinctive technical narrative, but changes in token supply are also a factor that shouldn’t be overlooked when trading.
In the short term, I’d first watch to see whether the daily chart stops making new lows, then check whether trading volume continues to increase during a rebound.
Lao He thinks TIA’s biggest problem isn’t that its story hasn’t been told well enough, but whether the market is willing to keep paying for it.
A sector may have a bright future, but that doesn’t mean every token will make its holders money.
Lao He will continue to monitor the market in real time and share specific trades and key take-profit levels in the chatroom.
#tia #celestia #模块化 #全球股市创三年来最长连跌,投资者避险情绪升温
Current reference price: $0.3198
24H: +3.23%
TIA has a distinctive technical narrative, but changes in token supply are also a factor that shouldn’t be overlooked when trading.
In the short term, I’d first watch to see whether the daily chart stops making new lows, then check whether trading volume continues to increase during a rebound.
Lao He thinks TIA’s biggest problem isn’t that its story hasn’t been told well enough, but whether the market is willing to keep paying for it.
A sector may have a bright future, but that doesn’t mean every token will make its holders money.
Lao He will continue to monitor the market in real time and share specific trades and key take-profit levels in the chatroom.
#tia #celestia #模块化 #全球股市创三年来最长连跌,投资者避险情绪升温

30
·
--
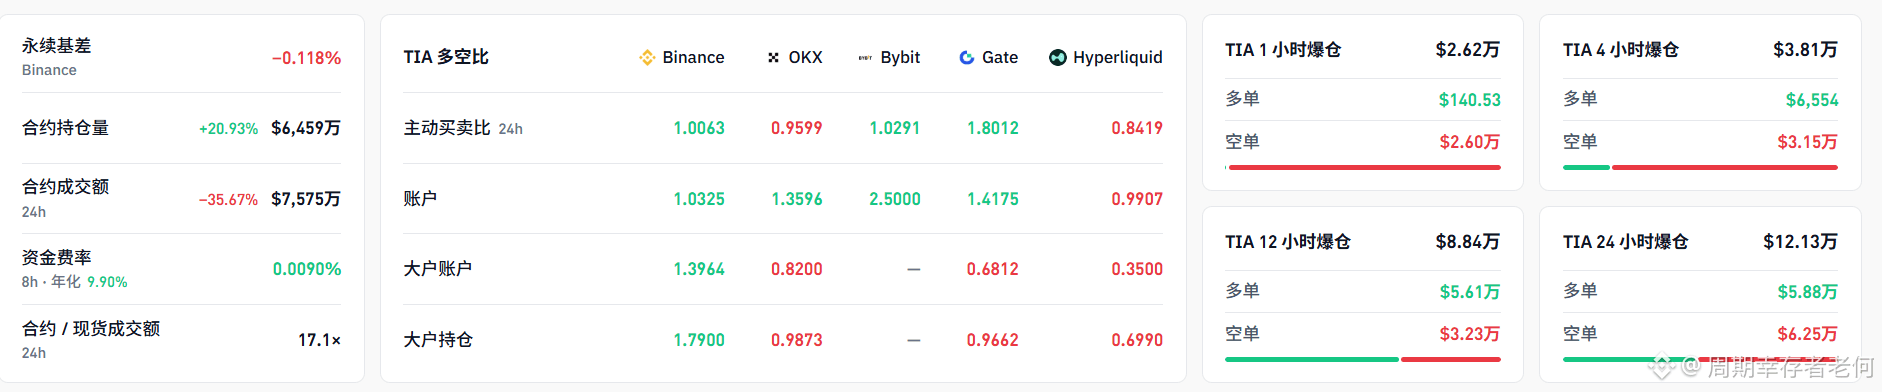
#tia Modular blockchain rebounds 6%—is money getting ready to buy the dip this time?
Current reference price: $0.3253
24H: +6.00%
TIA’s rebound today has some strength, but after the earlier correction, the market needs more time to confirm a bottom structure.
In the short term, I’ll be watching the $0.31–$0.32 range. If it regains and holds above $0.34, I’ll then watch for resistance around $0.35.
Lao He thinks the key thing to watch with TIA isn’t whether modular technology has a future, but whether changes in token supply can be matched by actual buying demand.
The technology roadmap may look promising in the long run, but you shouldn’t keep holding on through a trade indefinitely.
Lao He will continue monitoring the market in real time and share updates in the chatroom on specific trades and key take-profit levels.
#tia #celestia #模块化 #Anthropic上市次日大跌,股价接近破发
#tia Modular blockchain rebounds 6%—is money getting ready to buy the dip this time?
Current reference price: $0.3253
24H: +6.00%
TIA’s rebound today has some strength, but after the earlier correction, the market needs more time to confirm a bottom structure.
In the short term, I’ll be watching the $0.31–$0.32 range. If it regains and holds above $0.34, I’ll then watch for resistance around $0.35.
Lao He thinks the key thing to watch with TIA isn’t whether modular technology has a future, but whether changes in token supply can be matched by actual buying demand.
The technology roadmap may look promising in the long run, but you shouldn’t keep holding on through a trade indefinitely.
Lao He will continue monitoring the market in real time and share updates in the chatroom on specific trades and key take-profit levels.
#tia #celestia #模块化 #Anthropic上市次日大跌,股价接近破发
Current reference price: $0.3253
24H: +6.00%
TIA’s rebound today has some strength, but after the earlier correction, the market needs more time to confirm a bottom structure.
In the short term, I’ll be watching the $0.31–$0.32 range. If it regains and holds above $0.34, I’ll then watch for resistance around $0.35.
Lao He thinks the key thing to watch with TIA isn’t whether modular technology has a future, but whether changes in token supply can be matched by actual buying demand.
The technology roadmap may look promising in the long run, but you shouldn’t keep holding on through a trade indefinitely.
Lao He will continue monitoring the market in real time and share updates in the chatroom on specific trades and key take-profit levels.
#tia #celestia #模块化 #Anthropic上市次日大跌,股价接近破发

2

·
--
🩸 Downside Momentum: $TIA Pullback Rejection Confirmed
📊 Market Context & Thesis:
Price encountered strong overhead rejection at the 50 EMA on the 1-hour chart, fully aligning with the broader 4-hour downtrend. The inability to reclaim higher levels signals persistent distribution by sellers.
• Funding: -0.0043% (Neutral) • Next: 0h 58m
• Open Interest (OI): $10.90M
• 24h Volume: $16.67M
• 24h Range: 0.3369 — 0.357 (-1.0%)
🎯 Entry: 0.34760
🛑 Stop-Loss: 0.35421 (-1.90%)
✅ Take-Profit: 0.33438 (+3.80%)
⚖️ Risk/Reward: 1:2.0
🚫 Invalidation Rule: If a 1-hour candle closes above $0.35421 (+1.90%), this bearish thesis is invalidated. Cut position immediately.
⚖️ Risk Note: Moderate leverage recommended (3x–5x on Futures). Never risk more than 1–2% of total portfolio capital on a single setup.
📈 Strategy Track Record: WR 62% over 1976 trades
#TIA #FuturesTrading #CryptoTrading #BinanceSquare
⚠️ Not financial advice. Always manage your risk.
🩸 Downside Momentum: $TIA Pullback Rejection Confirmed
📊 Market Context & Thesis:
Price encountered strong overhead rejection at the 50 EMA on the 1-hour chart, fully aligning with the broader 4-hour downtrend. The inability to reclaim higher levels signals persistent distribution by sellers.
• Funding: -0.0043% (Neutral) • Next: 0h 58m
• Open Interest (OI): $10.90M
• 24h Volume: $16.67M
• 24h Range: 0.3369 — 0.357 (-1.0%)
🎯 Entry: 0.34760
🛑 Stop-Loss: 0.35421 (-1.90%)
✅ Take-Profit: 0.33438 (+3.80%)
⚖️ Risk/Reward: 1:2.0
🚫 Invalidation Rule: If a 1-hour candle closes above $0.35421 (+1.90%), this bearish thesis is invalidated. Cut position immediately.
⚖️ Risk Note: Moderate leverage recommended (3x–5x on Futures). Never risk more than 1–2% of total portfolio capital on a single setup.
📈 Strategy Track Record: WR 62% over 1976 trades
#TIA #FuturesTrading #CryptoTrading #BinanceSquare
⚠️ Not financial advice. Always manage your risk.
📊 Market Context & Thesis:
Price encountered strong overhead rejection at the 50 EMA on the 1-hour chart, fully aligning with the broader 4-hour downtrend. The inability to reclaim higher levels signals persistent distribution by sellers.
• Funding: -0.0043% (Neutral) • Next: 0h 58m
• Open Interest (OI): $10.90M
• 24h Volume: $16.67M
• 24h Range: 0.3369 — 0.357 (-1.0%)
🎯 Entry: 0.34760
🛑 Stop-Loss: 0.35421 (-1.90%)
✅ Take-Profit: 0.33438 (+3.80%)
⚖️ Risk/Reward: 1:2.0
🚫 Invalidation Rule: If a 1-hour candle closes above $0.35421 (+1.90%), this bearish thesis is invalidated. Cut position immediately.
⚖️ Risk Note: Moderate leverage recommended (3x–5x on Futures). Never risk more than 1–2% of total portfolio capital on a single setup.
📈 Strategy Track Record: WR 62% over 1976 trades
#TIA #FuturesTrading #CryptoTrading #BinanceSquare
⚠️ Not financial advice. Always manage your risk.
53

Friends, a great opportunity to make money today #easy_money #easyearn #Easy_To_Earn Don't forget to subscribe!!!
TIA – short 🔴
🔸Leverage: 17x
🔸Entry: 0.3335-0.3438
🔸Take profit: 0.3305
🔸Stop loss: 0.3538
Margin: cross
#TIA $TIA
{spot}(TIAUSDT)
Friends, a great opportunity to make money today #easy_money #easyearn #Easy_To_Earn Don't forget to subscribe!!!
TIA – short 🔴
🔸Leverage: 17x
🔸Entry: 0.3335-0.3438
🔸Take profit: 0.3305
🔸Stop loss: 0.3538
Margin: cross
#TIA $TIA
TIA – short 🔴
🔸Leverage: 17x
🔸Entry: 0.3335-0.3438
🔸Take profit: 0.3305
🔸Stop loss: 0.3538
Margin: cross
#TIA $TIA

1
780

·
--
What problems arise if a block only provides the result but not the transaction data?
First, what it is: data availability sampling (DAS) lets nodes randomly download a small portion of block data. If repeated samples are successful, they can confirm with extremely high probability that the full data has been published.
Why it matters: Rollup security depends on data availability. When transaction data is public, anyone can recompute the state, submit a fraud proof, or withdraw funds independently if the sequencer goes down.
$TIA is the native token of Celestia, a public blockchain specializing in data availability.
Invest according to your own risk tolerance, and leave yourself a way out.
#TIA
What problems arise if a block only provides the result but not the transaction data?
First, what it is: data availability sampling (DAS) lets nodes randomly download a small portion of block data. If repeated samples are successful, they can confirm with extremely high probability that the full data has been published.
Why it matters: Rollup security depends on data availability. When transaction data is public, anyone can recompute the state, submit a fraud proof, or withdraw funds independently if the sequencer goes down.
$TIA is the native token of Celestia, a public blockchain specializing in data availability.
Invest according to your own risk tolerance, and leave yourself a way out.
#TIA
First, what it is: data availability sampling (DAS) lets nodes randomly download a small portion of block data. If repeated samples are successful, they can confirm with extremely high probability that the full data has been published.
Why it matters: Rollup security depends on data availability. When transaction data is public, anyone can recompute the state, submit a fraud proof, or withdraw funds independently if the sequencer goes down.
$TIA is the native token of Celestia, a public blockchain specializing in data availability.
Invest according to your own risk tolerance, and leave yourself a way out.
#TIA
3

·
--
Let's talk about data availability.
If block producers publish only the block header but withhold some transaction data, others can't check whether the results are valid.
It's worth thinking one step further: requiring every node to download all the data raises the barrier to running a node as blocks get larger; sampling lets each node download only a small amount, so data capacity can continue to grow.
When comparing Layer 2 solutions, look at where the transaction data is stored: Ethereum, an independent data availability network, or an off-chain committee. Each has different security assumptions.
$TIA is the native token of Celestia, a public blockchain dedicated to data availability.
#TIA
Let's talk about data availability.
If block producers publish only the block header but withhold some transaction data, others can't check whether the results are valid.
It's worth thinking one step further: requiring every node to download all the data raises the barrier to running a node as blocks get larger; sampling lets each node download only a small amount, so data capacity can continue to grow.
When comparing Layer 2 solutions, look at where the transaction data is stored: Ethereum, an independent data availability network, or an off-chain committee. Each has different security assumptions.
$TIA is the native token of Celestia, a public blockchain dedicated to data availability.
#TIA
If block producers publish only the block header but withhold some transaction data, others can't check whether the results are valid.
It's worth thinking one step further: requiring every node to download all the data raises the barrier to running a node as blocks get larger; sampling lets each node download only a small amount, so data capacity can continue to grow.
When comparing Layer 2 solutions, look at where the transaction data is stored: Ethereum, an independent data availability network, or an off-chain committee. Each has different security assumptions.
$TIA is the native token of Celestia, a public blockchain dedicated to data availability.
#TIA
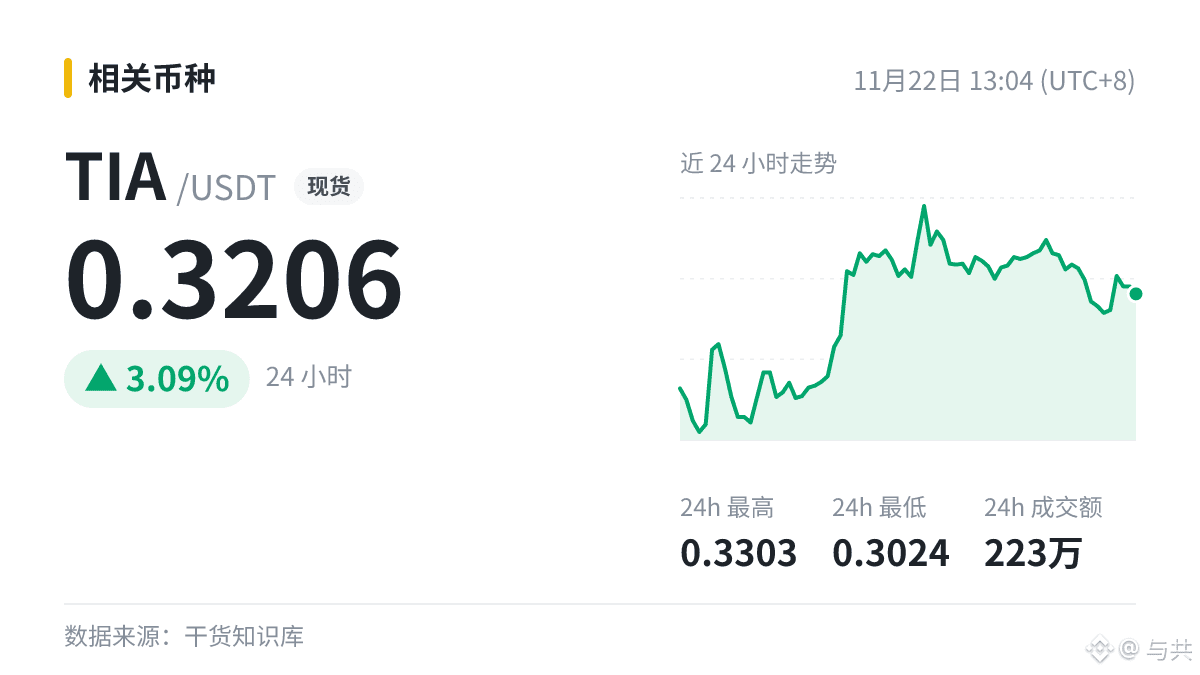
2

·
--
🚨$TIA at $0.31… the market is selling it as if it were dead… while the network is moving.🤔
The price fell to around $0.311 and broke below the September low of $0.3211, with the daily RSI below 30 for the first time since the sell-off began.
But what some people don’t see: v11 has passed the 90% voting-power threshold and aims to restrict 41,963 at-risk accounts following the Keplr/Web3Aut incident.
This isn’t just an upgrade… it’s an attempt to protect the network and restore confidence.
What’s next for TIA$?
Successful activation of v11, and network stability after the update.
A price recovery to the $0.3722 area, the first real resistance.
Real growth in Fibre and data usage, because the market doesn’t reward news… it rewards demand.
Distant targets (speculative, not guarantees):
$0.44 as a first target if the price regains momentum.
$0.55 as a second target if adoption continues.
$0.68 as a third target if a genuine reversal takes place with improvement ]$BTC
But the truth is: TIA is technically weak and near its low, and the risk is still present.
Don’t chase the bottom… watch the activation, then watch what happens afterward.
{future}(TIAUSDT)
💬 Will TIA return to $0.68… or is $0.26 the next stop?
#tia #crypto
🚨$TIA at $0.31… the market is selling it as if it were dead… while the network is moving.🤔
The price fell to around $0.311 and broke below the September low of $0.3211, with the daily RSI below 30 for the first time since the sell-off began.
But what some people don’t see: v11 has passed the 90% voting-power threshold and aims to restrict 41,963 at-risk accounts following the Keplr/Web3Aut incident.
This isn’t just an upgrade… it’s an attempt to protect the network and restore confidence.
What’s next for TIA$?
Successful activation of v11, and network stability after the update.
A price recovery to the $0.3722 area, the first real resistance.
Real growth in Fibre and data usage, because the market doesn’t reward news… it rewards demand.
Distant targets (speculative, not guarantees):
$0.44 as a first target if the price regains momentum.
$0.55 as a second target if adoption continues.
$0.68 as a third target if a genuine reversal takes place with improvement ]$BTC
But the truth is: TIA is technically weak and near its low, and the risk is still present.
Don’t chase the bottom… watch the activation, then watch what happens afterward.
💬 Will TIA return to $0.68… or is $0.26 the next stop?
#tia #crypto
The price fell to around $0.311 and broke below the September low of $0.3211, with the daily RSI below 30 for the first time since the sell-off began.
But what some people don’t see: v11 has passed the 90% voting-power threshold and aims to restrict 41,963 at-risk accounts following the Keplr/Web3Aut incident.
This isn’t just an upgrade… it’s an attempt to protect the network and restore confidence.
What’s next for TIA$?
Successful activation of v11, and network stability after the update.
A price recovery to the $0.3722 area, the first real resistance.
Real growth in Fibre and data usage, because the market doesn’t reward news… it rewards demand.
Distant targets (speculative, not guarantees):
$0.44 as a first target if the price regains momentum.
$0.55 as a second target if adoption continues.
$0.68 as a third target if a genuine reversal takes place with improvement ]$BTC
But the truth is: TIA is technically weak and near its low, and the risk is still present.
Don’t chase the bottom… watch the activation, then watch what happens afterward.
💬 Will TIA return to $0.68… or is $0.26 the next stop?
#tia #crypto
1
26

·
--
TIA is at a crossroads again
[Short] Current price: 0.325100. The chart shows which way it could go.
Here’s the conclusion first: short at the current price of 0.325100, with a stop-loss at 0.332069. If it moves above that, admit you were wrong.
· 0.3124 below is support, where buyers may step in; 0.3419 above is resistance, where selling pressure may emerge
How to trade (short):
· Entry: Short immediately at the current price of 0.325300
· Stop: 0.332069 (cut the loss at 2.1%; don’t hold and hope)
· Take profit: 0.312400 (first target; take half off when it gets there)
· Position: Start with 1–2% of your capital; don’t go all in
(Win rates are based on historical data and aren’t guaranteed; if you copy this trade, always use a stop-loss and control your position size.)
After doing this for so many years, I’ve come to believe one thing more and more.
$TIA is down -4.3%, and lots of people are asking whether they can buy the dip. There’s still room below 0.3251, so don’t rush to play the hero. The short-term range is clear: support at 0.3124, resistance at 0.3419. If you’re shorting, use resistance as your line of defense. Take half off at 0.3124, then see if the rest can push down to 0.2937.
24-hour volume is 1.4M and trading activity is holding up, which suggests the money hasn’t left.
I opened a short myself at the current price of 0.3251, with a stop-loss at 0.3321, using a small position to test it.
If it plunges straight through 0.3124, that means the short was right—but remember to move the stop-loss near your entry price. Don’t let a winning trade turn into a losing one.
24h: -4.3%.
The 20-day moving average at 0.3282 is already overhead. If the rebound can’t get past it, the bears are in control.
Position check: the current price is 3.9% from support and 5.2% from resistance. There isn’t enough room here to cover the risk, so don’t enter now—work out the numbers first, then decide how much to trade.
If 0.3124 can’t hold either, watch the area around 0.3124 to the downside—that’s the next stop.
If you agree, give this a like so more people can see it.
#TIA #Cryptocurrency
[Live Market Scan · $TIA] (1-hour primary setup + 4H filter)
4H trend: Strongly bearish | 1-hour pattern: [Stair-step pattern] confirmed
Long/short score: 4 points (RSI stabilizing +1 | Near EMA20 +1 | Top reversal +2)
Current price: 0.3251 RSI: 45.42 Support: 0.3124 / Resistance: 0.3419
Conclusion: Short setup confirmed → Short recommended
$TIA
TIA is at a crossroads again
[Short] Current price: 0.325100. The chart shows which way it could go.
Here’s the conclusion first: short at the current price of 0.325100, with a stop-loss at 0.332069. If it moves above that, admit you were wrong.
· 0.3124 below is support, where buyers may step in; 0.3419 above is resistance, where selling pressure may emerge
How to trade (short):
· Entry: Short immediately at the current price of 0.325300
· Stop: 0.332069 (cut the loss at 2.1%; don’t hold and hope)
· Take profit: 0.312400 (first target; take half off when it gets there)
· Position: Start with 1–2% of your capital; don’t go all in
(Win rates are based on historical data and aren’t guaranteed; if you copy this trade, always use a stop-loss and control your position size.)
After doing this for so many years, I’ve come to believe one thing more and more.
$TIA is down -4.3%, and lots of people are asking whether they can buy the dip. There’s still room below 0.3251, so don’t rush to play the hero. The short-term range is clear: support at 0.3124, resistance at 0.3419. If you’re shorting, use resistance as your line of defense. Take half off at 0.3124, then see if the rest can push down to 0.2937.
24-hour volume is 1.4M and trading activity is holding up, which suggests the money hasn’t left.
I opened a short myself at the current price of 0.3251, with a stop-loss at 0.3321, using a small position to test it.
If it plunges straight through 0.3124, that means the short was right—but remember to move the stop-loss near your entry price. Don’t let a winning trade turn into a losing one.
24h: -4.3%.
The 20-day moving average at 0.3282 is already overhead. If the rebound can’t get past it, the bears are in control.
Position check: the current price is 3.9% from support and 5.2% from resistance. There isn’t enough room here to cover the risk, so don’t enter now—work out the numbers first, then decide how much to trade.
If 0.3124 can’t hold either, watch the area around 0.3124 to the downside—that’s the next stop.
If you agree, give this a like so more people can see it.
#TIA #Cryptocurrency
[Live Market Scan · $TIA ] (1-hour primary setup + 4H filter)
4H trend: Strongly bearish | 1-hour pattern: [Stair-step pattern] confirmed
Long/short score: 4 points (RSI stabilizing +1 | Near EMA20 +1 | Top reversal +2)
Current price: 0.3251 RSI: 45.42 Support: 0.3124 / Resistance: 0.3419
Conclusion: Short setup confirmed → Short recommended
$TIA
[Short] Current price: 0.325100. The chart shows which way it could go.
Here’s the conclusion first: short at the current price of 0.325100, with a stop-loss at 0.332069. If it moves above that, admit you were wrong.
· 0.3124 below is support, where buyers may step in; 0.3419 above is resistance, where selling pressure may emerge
How to trade (short):
· Entry: Short immediately at the current price of 0.325300
· Stop: 0.332069 (cut the loss at 2.1%; don’t hold and hope)
· Take profit: 0.312400 (first target; take half off when it gets there)
· Position: Start with 1–2% of your capital; don’t go all in
(Win rates are based on historical data and aren’t guaranteed; if you copy this trade, always use a stop-loss and control your position size.)
After doing this for so many years, I’ve come to believe one thing more and more.
$TIA is down -4.3%, and lots of people are asking whether they can buy the dip. There’s still room below 0.3251, so don’t rush to play the hero. The short-term range is clear: support at 0.3124, resistance at 0.3419. If you’re shorting, use resistance as your line of defense. Take half off at 0.3124, then see if the rest can push down to 0.2937.
24-hour volume is 1.4M and trading activity is holding up, which suggests the money hasn’t left.
I opened a short myself at the current price of 0.3251, with a stop-loss at 0.3321, using a small position to test it.
If it plunges straight through 0.3124, that means the short was right—but remember to move the stop-loss near your entry price. Don’t let a winning trade turn into a losing one.
24h: -4.3%.
The 20-day moving average at 0.3282 is already overhead. If the rebound can’t get past it, the bears are in control.
Position check: the current price is 3.9% from support and 5.2% from resistance. There isn’t enough room here to cover the risk, so don’t enter now—work out the numbers first, then decide how much to trade.
If 0.3124 can’t hold either, watch the area around 0.3124 to the downside—that’s the next stop.
If you agree, give this a like so more people can see it.
#TIA #Cryptocurrency
[Live Market Scan · $TIA ] (1-hour primary setup + 4H filter)
4H trend: Strongly bearish | 1-hour pattern: [Stair-step pattern] confirmed
Long/short score: 4 points (RSI stabilizing +1 | Near EMA20 +1 | Top reversal +2)
Current price: 0.3251 RSI: 45.42 Support: 0.3124 / Resistance: 0.3419
Conclusion: Short setup confirmed → Short recommended
$TIA
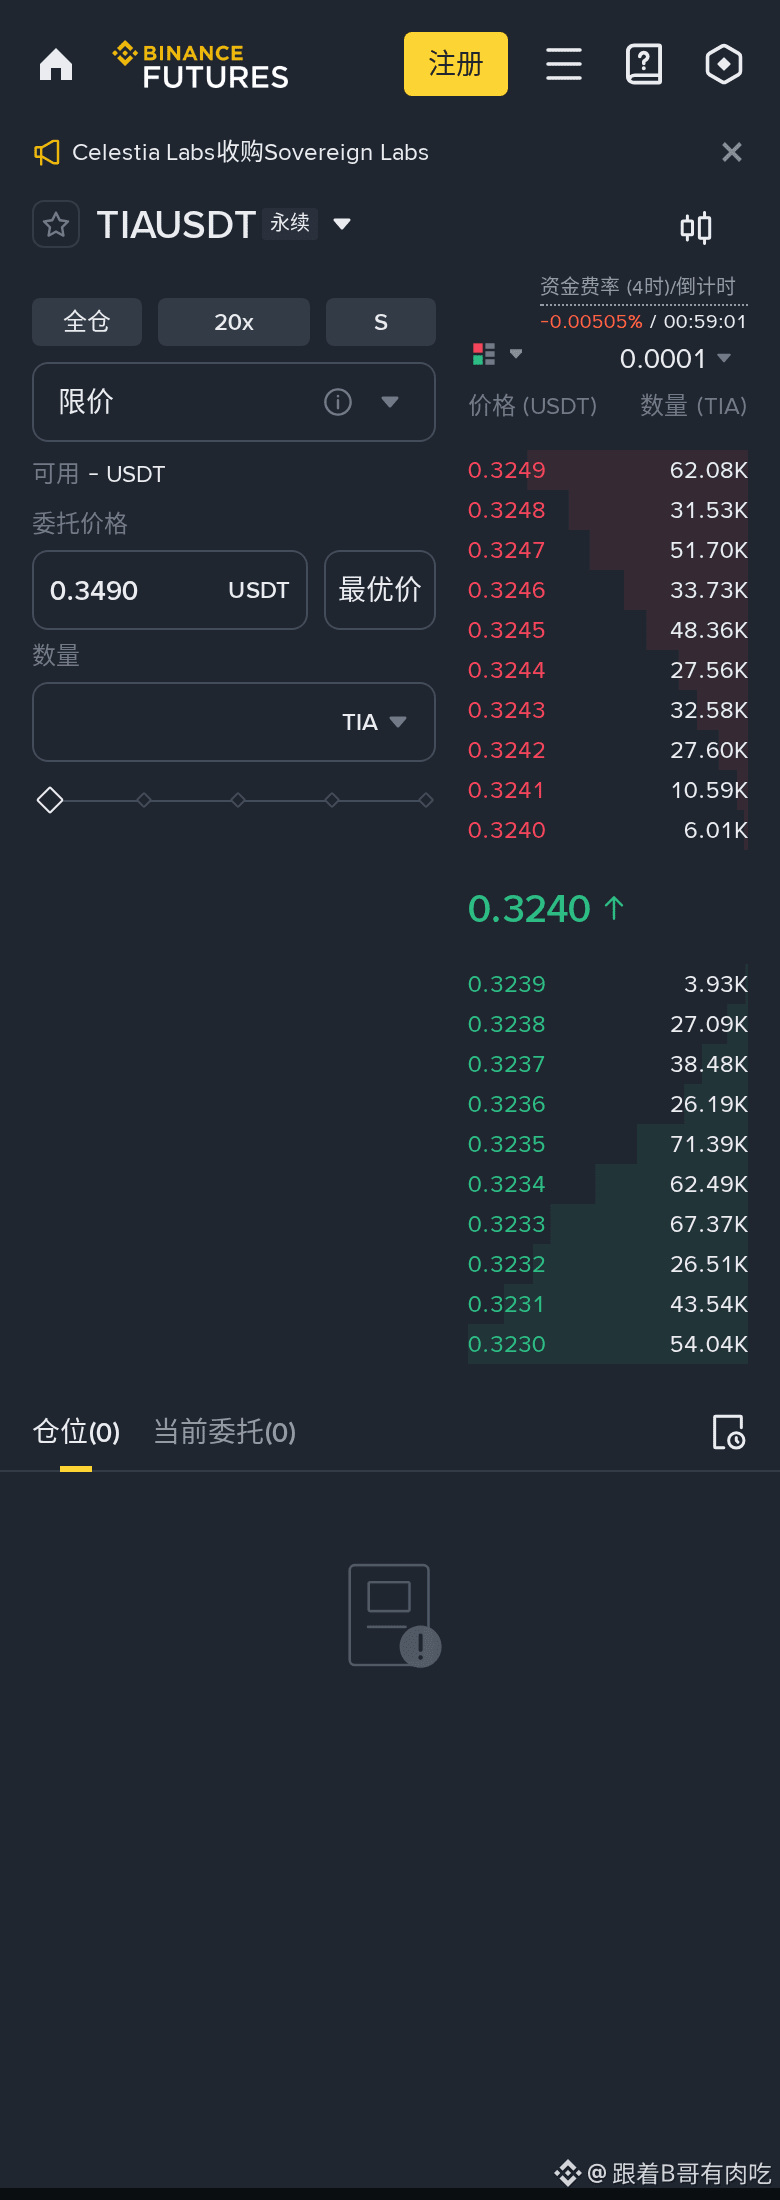
252
Log in to explore more content
Join global crypto users on Binance Square
⚡️ Get latest and useful information about crypto.
💬 Trusted by the world’s largest crypto exchange.
👍 Discover real insights from verified creators.
Email / Phone number
Trending Topics
1
#BTCReboundsAbove$60KAmidWhaleDipBuying
71,189 views
325 Discussing
2
#SolanaSets2027RoadmapToDoubleComputeCapacity
55,412 views
952 Discussing
3
#CaliforniaNvidiaProbeExaminesPotentialCriminalViolations
14,841 views
130 Discussing
4
#BlackRockLaunchesHKDollarDigitalLiquidityFund
45,667 views
731 Discussing
5
#NvidiaLoses$2.7TrillionInMonthAndAHalf
76,144 views
309 Discussing
6
#GlobalStocksFaceLongestLosingStreakSince2023
563,198 views
3,459 Discussing
7
#BlackRockIBITPostsRecord$541MSingleDayOutflow
93,329 views
186 Discussing
8
#AnthropicPlungesTowardIPOPriceonDay2
311,738 views
2,322 Discussing
9
#TwentyOneCapitalAdds172.25BTC
164,804 views
1,637 Discussing
10
#HKBillWouldExcludeTokenizedDepositsFromVirtualAssets
18,173 views
105 Discussing