
#spread
spread
9,260 views
271 Discussing
Hot
Latest

·
--
Article
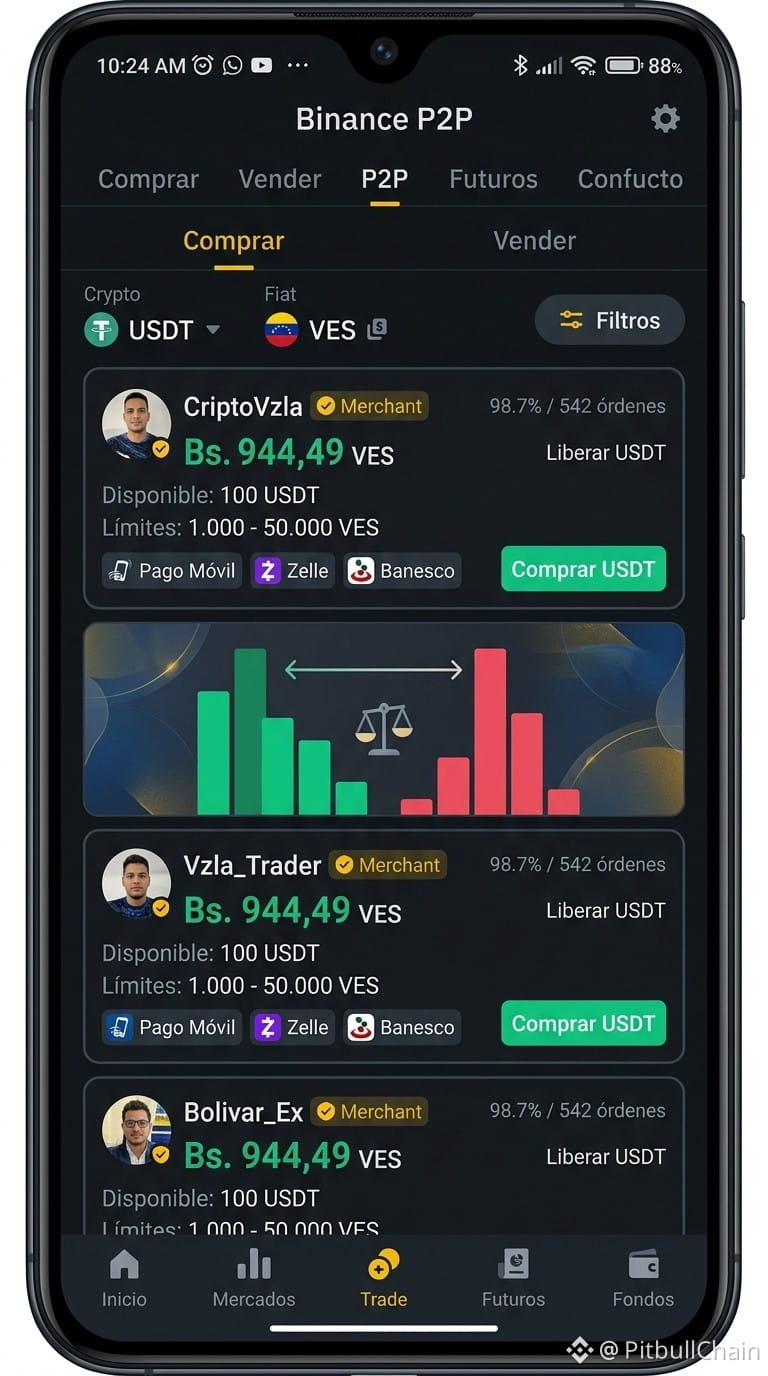
What is the spread in P2P? A guide to calculate it using real data in Venezuela Live P2P Radar Capture: 27/8/2026, 6:30:14 p. m.
USDT/VES reference Bs. 958.64
Buy USDT Bs. 958.64
USDT sale Bs. 918.53
BCV Bs. 791.32
Premium vs BCV 21.14%
P2P spread 4.37%
Observed offers 239
Verify current data in P2P Radar
The spread is one of the most important concepts you need to master to trade in Venezuela’s P2P market. In this guide, we’ll explain what it is, how to calculate it step by step, and why the global spread (that you see in the P2P Radar) is different from the order book spread on Binance. We’ll use real data captured on August 27, 2026.
What is the spread in P2P? A guide to calculate it using real data in Venezuela
Live P2P Radar Capture: 27/8/2026, 6:30:14 p. m.
USDT/VES reference Bs. 958.64
Buy USDT Bs. 958.64
USDT sale Bs. 918.53
BCV Bs. 791.32
Premium vs BCV 21.14%
P2P spread 4.37%
Observed offers 239
Verify current data in P2P Radar
The spread is one of the most important concepts you need to master to trade in Venezuela’s P2P market. In this guide, we’ll explain what it is, how to calculate it step by step, and why the global spread (that you see in the P2P Radar) is different from the order book spread on Binance. We’ll use real data captured on August 27, 2026.
USDT/VES reference Bs. 958.64
Buy USDT Bs. 958.64
USDT sale Bs. 918.53
BCV Bs. 791.32
Premium vs BCV 21.14%
P2P spread 4.37%
Observed offers 239
Verify current data in P2P Radar
The spread is one of the most important concepts you need to master to trade in Venezuela’s P2P market. In this guide, we’ll explain what it is, how to calculate it step by step, and why the global spread (that you see in the P2P Radar) is different from the order book spread on Binance. We’ll use real data captured on August 27, 2026.
·
--
P2P today: other platforms widen the spread by Bs. 139 in difference📊 P2P today: other platforms widen the spread by Bs. 139 in difference
Date: Thursday, September 17, 2026 · Live Radar P2P data: buy Bs. 970.31 · sell Bs. 925.17 · BCV Bs. N/A · premium N/A%
This Thursday, September 17, begins with a two-speed P2P market: the aggregated reference stands at Bs. 970.31 on the buy side and Bs. 925.17 on the sell side, while other platforms pull away from the rest with readings that don't match the other exchanges. The BCV did not publish a rate today, so the P2P premium is without an official benchmark, and operators are using the previous close and the depth of each order book to guide themselves.
P2P today: other platforms widen the spread by Bs. 139 in difference
📊 P2P today: other platforms widen the spread by Bs. 139 in difference
Date: Thursday, September 17, 2026 · Live Radar P2P data: buy Bs. 970.31 · sell Bs. 925.17 · BCV Bs. N/A · premium N/A%
This Thursday, September 17, begins with a two-speed P2P market: the aggregated reference stands at Bs. 970.31 on the buy side and Bs. 925.17 on the sell side, while other platforms pull away from the rest with readings that don't match the other exchanges. The BCV did not publish a rate today, so the P2P premium is without an official benchmark, and operators are using the previous close and the depth of each order book to guide themselves.
Date: Thursday, September 17, 2026 · Live Radar P2P data: buy Bs. 970.31 · sell Bs. 925.17 · BCV Bs. N/A · premium N/A%
This Thursday, September 17, begins with a two-speed P2P market: the aggregated reference stands at Bs. 970.31 on the buy side and Bs. 925.17 on the sell side, while other platforms pull away from the rest with readings that don't match the other exchanges. The BCV did not publish a rate today, so the P2P premium is without an official benchmark, and operators are using the previous close and the depth of each order book to guide themselves.
6
·
--
Article
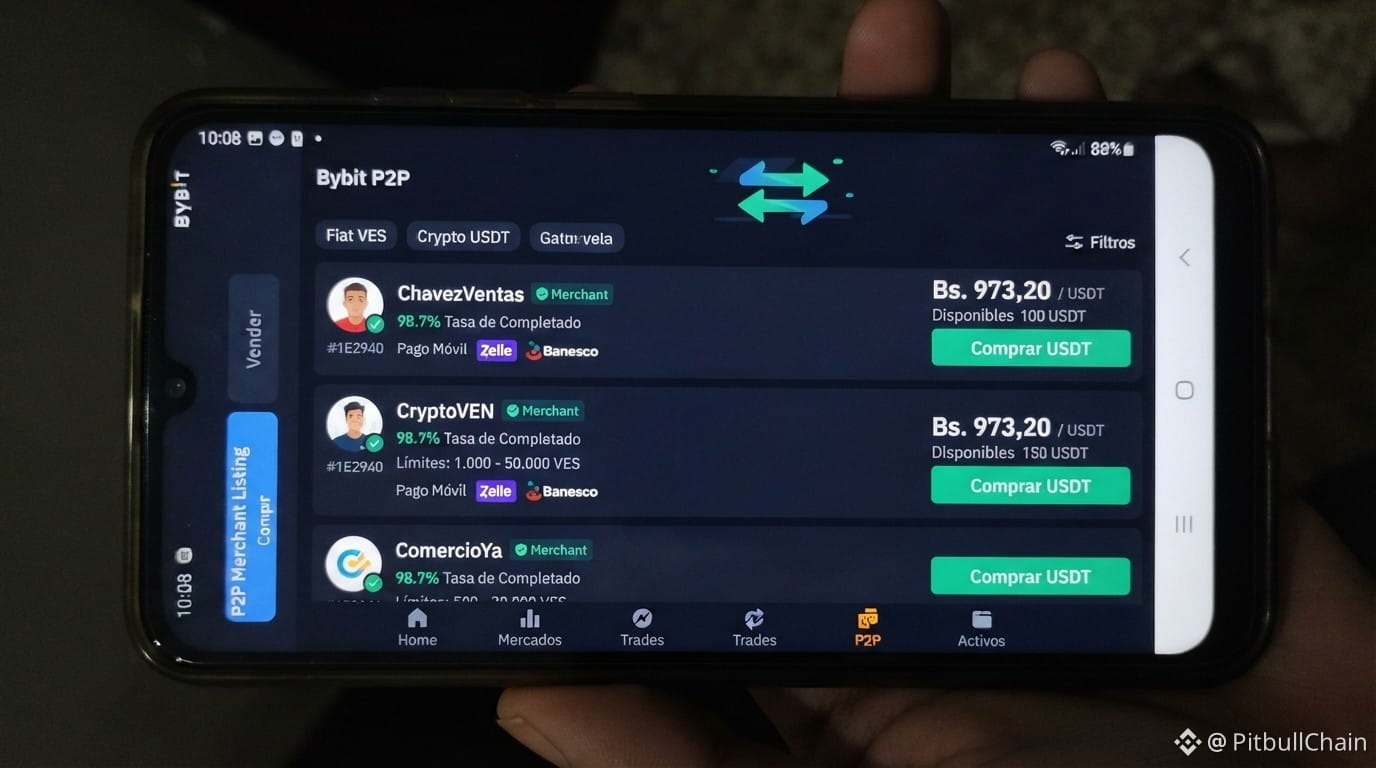
USDT P2P spread in Venezuela: what it is and how it affects youThe P2P market (person-to-person) for USDT in Venezuela has become the main channel for moving digital dollars. But there’s an invisible cost that many people overlook: the spread — that is, the difference between what you pay for your USDT when you sell and what they charge you when you buy. In practice, that gap can eat up a significant part of your operation. What is the spread in P2P? The spread is the gap between the buy price (the highest price a buyer is willing to pay) and the sell price (the lowest price a seller accepts). In the USDT P2P market with bolívares, this translates into two different prices: the one you see when you want to buy USDT and the one you see when you want to sell USDT. Fact: According to data captured by PitbullChain Radar on September 8, 2026, the average price to buy USDT is 978.37 Bs., while the price to sell it is 945.24 Bs. Calculation: The difference is 33.13 Bs., which equals 3.5% over the selling price. Interpretation: If you sell 100 USDT, you receive 94,524 Bs. If you buy them back, you pay 97,837 Bs. That loss of 3,313 Bs. is the cost of the spread. Why is the spread so high in Venezuela? There isn’t just one reason. The spread reflects the market’s health: its liquidity, competition between advertisers, the payment methods available, and the regulatory context. Liquidity: When there are many active buyers and sellers, the spread tends to be smaller. In Radar’s data, the total volume of buy offers is 516,669 USDT and the sell volume is 179,769 USDT, showing an imbalance that puts pressure on prices. Payment methods: Banks with greater presence, such as Banesco, Pago Móvil, or Banco de Venezuela, tend to have lower spreads. PitbullChain’s traffic light indicates that Banesco has an average spread of 0.91%, while other channels exceed 1.18%. Counterparty risk: In an unregulated market, advertisers charge more to compensate for the risk that the transfer may not be completed or that reversals may occur. Legal framework and changes: The perception of sanctions or controls can lead sellers to demand an additional premium. How does the spread affect you when buying or selling? The spread is a transaction cost. You don’t see it as a commission, but you pay it every time you switch between USDT and bolívares. If you sell USDT: The price you receive is always lower than what’s published as the “market price.” If you sell 1,000 USDT at the average P2P exchange rate, you’ll receive 945,237 Bs., not the 978,370 Bs. shown as a reference. If you buy USDT: You’ll pay the higher price on the seller’s side. When buying 1,000 USDT, you need 978,370 Bs., about 33,133 Bs. more than what you would receive if you sold them immediately. That balance goes to the market makers or intermediaries who post both sides. The problem gets worse when the spread is high. A 3.5% spread is high compared with markets like Binance P2P for other coins, where it’s usually below 1%. In Radar’s order book, the best bid (buy) is 970 Bs. and the best ask (sell) is 971 Bs., resulting in a spread of only about 0.1% in the best published offers. The difference from the average spread happens because not all listings have competitive prices or sufficient depth. Factors that move the spread in real time The spread isn’t static. It changes based on supply and demand, time of day, the availability of mobile payments, and the entry or exit of large players. Liquidity by bank: Radar’s data for this moment shows that Banco de Venezuela has a spread of 0.44%, the lowest among the main ones. Meanwhile, Otro método or Pago Móvil exceed 1.1%. If you have an account with a bank that has better depth, you can get better prices. Time of day: During high-activity hours, like mornings or paydays, there are more listings and the spread tends to compress. In the early-morning hours, liquidity drops and spreads widen. BCV intervention: Even though the BCV doesn’t operate directly in P2P, the official exchange rate (814.69 Bs. right now) serves as a reference to calculate the USDT premium, which today is 20%. When that premium rises, volatility also rises, and the spread often increases too. How to use Radar data to reduce the impact of the spread Compare prices between exchanges: The 3.5% spread shown by Radar is a weighted average. On Binance, the effective spread between the best buy and sell offers is only 1 Bs. (0.1%). You don’t always need to take the first listing you see. Check the bank’s depth: If you use a bank with low liquidity, the prices are likely to be less competitive. Review PitbullChain’s traffic light: The tool classifies the market by colors. Today it’s yellow, with a score of 65, which indicates moderate conditions. Take advantage of liquidity and spread alerts. Consider large amounts carefully: In P2P, listings with high limits often have better prices. For example, a buy order for 74,101 USDT is listed at 969.64 Bs., with a spread of only about 0.1% compared with the best sell of 971 Bs. Avoid trading when the traffic light is red: If the spread exceeds 5% and liquidity drops, it’s better to wait or use another method. In conclusion, the spread is a key indicator of the efficiency of the P2P market. Knowing it, measuring it, and comparing it helps you make more informed decisions. It’s not about predicting the exchange rate, but about understanding how much each operation costs you and choosing the most favorable time and channel.
USDT P2P spread in Venezuela: what it is and how it affects you
The P2P market (person-to-person) for USDT in Venezuela has become the main channel for moving digital dollars. But there’s an invisible cost that many people overlook: the spread — that is, the difference between what you pay for your USDT when you sell and what they charge you when you buy. In practice, that gap can eat up a significant part of your operation. What is the spread in P2P? The spread is the gap between the buy price (the highest price a buyer is willing to pay) and the sell price (the lowest price a seller accepts). In the USDT P2P market with bolívares, this translates into two different prices: the one you see when you want to buy USDT and the one you see when you want to sell USDT. Fact: According to data captured by PitbullChain Radar on September 8, 2026, the average price to buy USDT is 978.37 Bs., while the price to sell it is 945.24 Bs. Calculation: The difference is 33.13 Bs., which equals 3.5% over the selling price. Interpretation: If you sell 100 USDT, you receive 94,524 Bs. If you buy them back, you pay 97,837 Bs. That loss of 3,313 Bs. is the cost of the spread. Why is the spread so high in Venezuela? There isn’t just one reason. The spread reflects the market’s health: its liquidity, competition between advertisers, the payment methods available, and the regulatory context. Liquidity: When there are many active buyers and sellers, the spread tends to be smaller. In Radar’s data, the total volume of buy offers is 516,669 USDT and the sell volume is 179,769 USDT, showing an imbalance that puts pressure on prices. Payment methods: Banks with greater presence, such as Banesco, Pago Móvil, or Banco de Venezuela, tend to have lower spreads. PitbullChain’s traffic light indicates that Banesco has an average spread of 0.91%, while other channels exceed 1.18%. Counterparty risk: In an unregulated market, advertisers charge more to compensate for the risk that the transfer may not be completed or that reversals may occur. Legal framework and changes: The perception of sanctions or controls can lead sellers to demand an additional premium. How does the spread affect you when buying or selling? The spread is a transaction cost. You don’t see it as a commission, but you pay it every time you switch between USDT and bolívares. If you sell USDT: The price you receive is always lower than what’s published as the “market price.” If you sell 1,000 USDT at the average P2P exchange rate, you’ll receive 945,237 Bs., not the 978,370 Bs. shown as a reference. If you buy USDT: You’ll pay the higher price on the seller’s side. When buying 1,000 USDT, you need 978,370 Bs., about 33,133 Bs. more than what you would receive if you sold them immediately. That balance goes to the market makers or intermediaries who post both sides. The problem gets worse when the spread is high. A 3.5% spread is high compared with markets like Binance P2P for other coins, where it’s usually below 1%. In Radar’s order book, the best bid (buy) is 970 Bs. and the best ask (sell) is 971 Bs., resulting in a spread of only about 0.1% in the best published offers. The difference from the average spread happens because not all listings have competitive prices or sufficient depth. Factors that move the spread in real time The spread isn’t static. It changes based on supply and demand, time of day, the availability of mobile payments, and the entry or exit of large players. Liquidity by bank: Radar’s data for this moment shows that Banco de Venezuela has a spread of 0.44%, the lowest among the main ones. Meanwhile, Otro método or Pago Móvil exceed 1.1%. If you have an account with a bank that has better depth, you can get better prices. Time of day: During high-activity hours, like mornings or paydays, there are more listings and the spread tends to compress. In the early-morning hours, liquidity drops and spreads widen. BCV intervention: Even though the BCV doesn’t operate directly in P2P, the official exchange rate (814.69 Bs. right now) serves as a reference to calculate the USDT premium, which today is 20%. When that premium rises, volatility also rises, and the spread often increases too. How to use Radar data to reduce the impact of the spread Compare prices between exchanges: The 3.5% spread shown by Radar is a weighted average. On Binance, the effective spread between the best buy and sell offers is only 1 Bs. (0.1%). You don’t always need to take the first listing you see. Check the bank’s depth: If you use a bank with low liquidity, the prices are likely to be less competitive. Review PitbullChain’s traffic light: The tool classifies the market by colors. Today it’s yellow, with a score of 65, which indicates moderate conditions. Take advantage of liquidity and spread alerts. Consider large amounts carefully: In P2P, listings with high limits often have better prices. For example, a buy order for 74,101 USDT is listed at 969.64 Bs., with a spread of only about 0.1% compared with the best sell of 971 Bs. Avoid trading when the traffic light is red: If the spread exceeds 5% and liquidity drops, it’s better to wait or use another method. In conclusion, the spread is a key indicator of the efficiency of the P2P market. Knowing it, measuring it, and comparing it helps you make more informed decisions. It’s not about predicting the exchange rate, but about understanding how much each operation costs you and choosing the most favorable time and channel.
29
·
--
Article
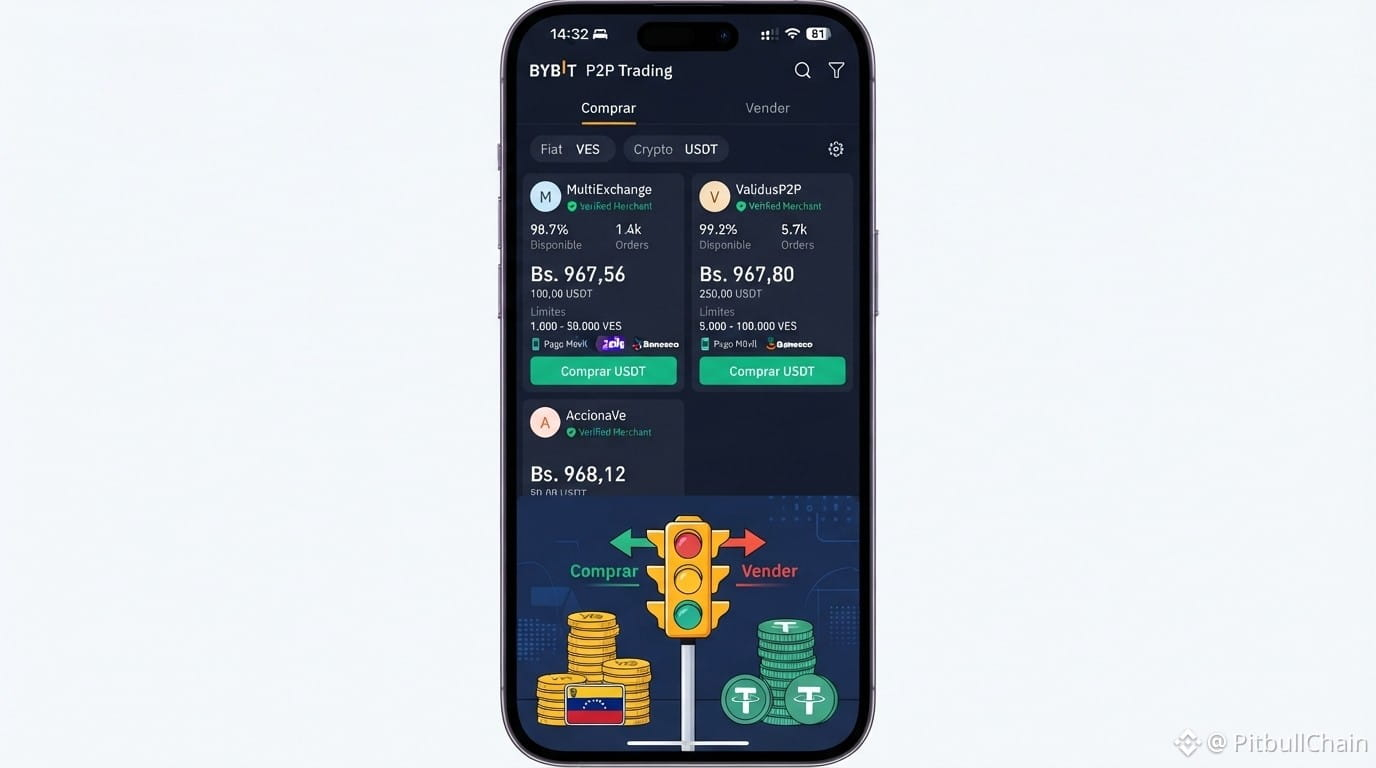
Spread in P2P: how much extra you pay when buying USDT in VenezuelaIn the Venezuelan P2P market, USDT has become a daily tool for preserving value and making payments. However, there is a silent gap that everyone who trades should understand: the spread. It is not just the difference between buy and sell prices, but the real cost you assume every time you exchange bolivars for cryptocurrencies and vice versa. In this guide, you will use real data captured by PitbullChain on September 7, 2026 at 04:00 UTC: the USDT buy price is Bs. 980.97, the sell price is Bs. 933.04, and the spread reaches Bs. 47.93, equivalent to 5.14% calculated over the sell price. What is the spread in the P2P market? The spread is the difference between the highest price a buyer offers for your USDT and the lowest price a seller asks for theirs. In practice, when you buy USDT you pay the higher price (the one sellers ask), and when you sell you receive the lower price (the one buyers offer). That difference is the spread and represents your immediate cost of participating in the market. According to PitbullChain's P2P Radar data: Buy USDT (acquire USDT with bolivars): the reference price is Bs. 980.97 per USDT. Sell USDT (receive bolivars in exchange): the reference price is Bs. 933.04 per USDT. Absolute spread: Bs. 47.93. Percentage spread: 5.14% over the sell price. If you trade in a market with high liquidity and multiple listings, the spread tends to shrink. If the market is thin or there is little competition, the spread widens and conditions move against you. How do you calculate the real cost of buying and selling USDT? The real cost is not just the spread: you must also consider the premium versus the official exchange rate, any fees charged by the platform or bank, and the time your funds remain locked. But the starting point is the spread, because it defines your theoretical loss if you complete a round trip at the same moment. The basic formula is: Real round-trip cost = Buy price − Sell price In the case of one USDT, that cost is Bs. 47.93. If you want to express it as a percentage of your initial capital, divide that value by the buy price and multiply by 100: (980.97 − 933.04) ÷ 980.97 × 100 = 4.89% That means that if you buy one USDT at Bs. 980.97 and sell it immediately at Bs. 933.04, you lose almost 4.9% of your initial investment. That is the true threshold you must overcome for your trade to make economic sense. Step-by-step numerical example with PitbullChain data Let's apply the concept with a simple example: buy 100 USDT and then sell them at the same moment, using the average prices from the P2P Radar. Step 1: Check the prices in PitbullChain's P2P Radar. The captured data indicate that the buy price is Bs. 980.97 and the sell price is Bs. 933.04. Step 2: Calculate how many bolivars you need to buy 100 USDT. You multiply 100 × 980.97 = 98,096.83 bolivars. Step 3: Calculate how many bolivars you would receive when selling those 100 USDT. You multiply 100 × 933.04 = 93,304.26 bolivars. Step 4: Get the difference (total spread). Subtract: 98,096.83 − 93,304.26 = 4,792.57 bolivars. That is the cost you assume when buying and selling immediately. Step 5: Convert that difference into a percentage. Divide the total spread by the capital invested: 4,792.57 ÷ 98,096.83 = 0.0489, that is, 4.89%. To recover that cost, the price would need to rise (or fall, if you are in the opposite position) more than 4.89% before you see profits. Concept Value in bolivars Capital needed to buy 100 USDT 98,096.83 Bolivars received when selling 100 USDT 93,304.26 Total spread (immediate loss) 4,792.57 Percentage real cost 4.89% What does the comparison with the BCV and the parallel market mean? The BCV published an official exchange rate of Bs. 813.74 per dollar. In the P2P market, the USDT buy price is Bs. 980.97. That creates a 20.55% premium over the BCV. This is relevant because it explains why many people see USDT as a way to access dollars without going through traditional banking requirements, but it also shows the extra cost you must assume. Meanwhile, the parallel market (according to Binance P2P) stood at Bs. 961.93, a value between the BCV and the USDT buy price on PitbullChain. PitbullChain's traffic light score was 71 (yellow) with the label “moderate caution”. The influencing factors are a high spread (score 20) and excellent liquidity (score 95). This means there are enough offers, but the cost to trade is high and you should compare before deciding. P2P traffic light: how to interpret the signals PitbullChain condenses market conditions into a status traffic light: Green: low spread, high liquidity, and favorable trading conditions. Yellow: moderate or high spread; it is advisable to compare between banks and exchanges so you do not overpay. Red: illiquidity, extreme spread, or payment method failures; trading under these conditions is risky. At the time of this analysis, the traffic light is yellow. The main alerts are sufficient liquidity in several banks and a high spread. Therefore, the recommended action is to compare prices across exchanges and verify the bank, reputation, and limits before executing any trade. Practical tips to reduce the impact of the spread Knowing the spread is not enough: you must learn to trade despite it. These are some suggestions based on the behavior of the Venezuelan P2P market: Get quotes before buying or selling. Use PitbullChain's P2P Radar to see the best buy offer and the best sell offer in real time without committing your funds. Check the spread by bank. Some banks such as Banco de Venezuela and Mercantil usually have a lower spread than others. In the data from September 7, Banco de Venezuela showed a spread of Bs. 9.00, while the overall average was higher. Assess whether the price aligns with the BCV or the parallel rate. If the premium over the BCV exceeds what is historically observed, it may be time to wait or look for another exchange. Consider arbitrage cautiously. Arbitrage between buying on one exchange and selling on another can be profitable when the spread is low and the amounts cover the fees. But it also involves more than one operation and counterparty risk. Use limit orders, not just market orders. When the market allows it, place your own offer at a price that guarantees a more favorable spread instead of accepting the best available price. Always calculate the round-trip cost. Before entering a trade, ask yourself how much you would need to earn to cover the spread and fees. This practice will help you make more informed decisions. The role of arbitrage in P2P spread When the spread between exchanges widens, some operators look for arbitrage opportunities: buy USDT on one platform at a lower price and sell it on another at a higher price. However, these opportunities quickly shrink as more players participate. PitbullChain offers tools such as the P2P Calculator, the Bank Comparator, and the Order Book to make that analysis easier. In the current order book, imbalances can be seen: buy volume reaches 1,258,106 USDT, while sell volume is much lower (153,421 USDT). This indicates that the market is dominated by buyers, which pushes prices upward. Understanding these flows will allow you to anticipate when the spread might narrow or widen. For example, if there are many more buyers than sellers, sellers may raise their prices and the spread increases. Final conclusions The spread is not an abstract concept or an irrelevant technical datum: it is the cost you pay every time you enter or exit the P2P market. In the Venezuelan context, with a premium above 20% versus the BCV, mastering it is essential so you do not erode your capital. Our figures come from PitbullChain's P2P Radar and the BCV, with a capture made on September 7, 2026. The traffic-light metric gives you a quick reading of conditions, but remember that the market changes constantly. Before your next trade, open the P2P Radar, review the buy and sell prices for your preferred bank, and apply the formula: buy price − sell price. That simple calculation will tell you how much you need to gain just to avoid losing.
Spread in P2P: how much extra you pay when buying USDT in Venezuela
In the Venezuelan P2P market, USDT has become a daily tool for preserving value and making payments. However, there is a silent gap that everyone who trades should understand: the spread. It is not just the difference between buy and sell prices, but the real cost you assume every time you exchange bolivars for cryptocurrencies and vice versa. In this guide, you will use real data captured by PitbullChain on September 7, 2026 at 04:00 UTC: the USDT buy price is Bs. 980.97, the sell price is Bs. 933.04, and the spread reaches Bs. 47.93, equivalent to 5.14% calculated over the sell price. What is the spread in the P2P market? The spread is the difference between the highest price a buyer offers for your USDT and the lowest price a seller asks for theirs. In practice, when you buy USDT you pay the higher price (the one sellers ask), and when you sell you receive the lower price (the one buyers offer). That difference is the spread and represents your immediate cost of participating in the market. According to PitbullChain's P2P Radar data: Buy USDT (acquire USDT with bolivars): the reference price is Bs. 980.97 per USDT. Sell USDT (receive bolivars in exchange): the reference price is Bs. 933.04 per USDT. Absolute spread: Bs. 47.93. Percentage spread: 5.14% over the sell price. If you trade in a market with high liquidity and multiple listings, the spread tends to shrink. If the market is thin or there is little competition, the spread widens and conditions move against you. How do you calculate the real cost of buying and selling USDT? The real cost is not just the spread: you must also consider the premium versus the official exchange rate, any fees charged by the platform or bank, and the time your funds remain locked. But the starting point is the spread, because it defines your theoretical loss if you complete a round trip at the same moment. The basic formula is: Real round-trip cost = Buy price − Sell price In the case of one USDT, that cost is Bs. 47.93. If you want to express it as a percentage of your initial capital, divide that value by the buy price and multiply by 100: (980.97 − 933.04) ÷ 980.97 × 100 = 4.89% That means that if you buy one USDT at Bs. 980.97 and sell it immediately at Bs. 933.04, you lose almost 4.9% of your initial investment. That is the true threshold you must overcome for your trade to make economic sense. Step-by-step numerical example with PitbullChain data Let's apply the concept with a simple example: buy 100 USDT and then sell them at the same moment, using the average prices from the P2P Radar. Step 1: Check the prices in PitbullChain's P2P Radar. The captured data indicate that the buy price is Bs. 980.97 and the sell price is Bs. 933.04. Step 2: Calculate how many bolivars you need to buy 100 USDT. You multiply 100 × 980.97 = 98,096.83 bolivars. Step 3: Calculate how many bolivars you would receive when selling those 100 USDT. You multiply 100 × 933.04 = 93,304.26 bolivars. Step 4: Get the difference (total spread). Subtract: 98,096.83 − 93,304.26 = 4,792.57 bolivars. That is the cost you assume when buying and selling immediately. Step 5: Convert that difference into a percentage. Divide the total spread by the capital invested: 4,792.57 ÷ 98,096.83 = 0.0489, that is, 4.89%. To recover that cost, the price would need to rise (or fall, if you are in the opposite position) more than 4.89% before you see profits. Concept Value in bolivars Capital needed to buy 100 USDT 98,096.83 Bolivars received when selling 100 USDT 93,304.26 Total spread (immediate loss) 4,792.57 Percentage real cost 4.89% What does the comparison with the BCV and the parallel market mean? The BCV published an official exchange rate of Bs. 813.74 per dollar. In the P2P market, the USDT buy price is Bs. 980.97. That creates a 20.55% premium over the BCV. This is relevant because it explains why many people see USDT as a way to access dollars without going through traditional banking requirements, but it also shows the extra cost you must assume. Meanwhile, the parallel market (according to Binance P2P) stood at Bs. 961.93, a value between the BCV and the USDT buy price on PitbullChain. PitbullChain's traffic light score was 71 (yellow) with the label “moderate caution”. The influencing factors are a high spread (score 20) and excellent liquidity (score 95). This means there are enough offers, but the cost to trade is high and you should compare before deciding. P2P traffic light: how to interpret the signals PitbullChain condenses market conditions into a status traffic light: Green: low spread, high liquidity, and favorable trading conditions. Yellow: moderate or high spread; it is advisable to compare between banks and exchanges so you do not overpay. Red: illiquidity, extreme spread, or payment method failures; trading under these conditions is risky. At the time of this analysis, the traffic light is yellow. The main alerts are sufficient liquidity in several banks and a high spread. Therefore, the recommended action is to compare prices across exchanges and verify the bank, reputation, and limits before executing any trade. Practical tips to reduce the impact of the spread Knowing the spread is not enough: you must learn to trade despite it. These are some suggestions based on the behavior of the Venezuelan P2P market: Get quotes before buying or selling. Use PitbullChain's P2P Radar to see the best buy offer and the best sell offer in real time without committing your funds. Check the spread by bank. Some banks such as Banco de Venezuela and Mercantil usually have a lower spread than others. In the data from September 7, Banco de Venezuela showed a spread of Bs. 9.00, while the overall average was higher. Assess whether the price aligns with the BCV or the parallel rate. If the premium over the BCV exceeds what is historically observed, it may be time to wait or look for another exchange. Consider arbitrage cautiously. Arbitrage between buying on one exchange and selling on another can be profitable when the spread is low and the amounts cover the fees. But it also involves more than one operation and counterparty risk. Use limit orders, not just market orders. When the market allows it, place your own offer at a price that guarantees a more favorable spread instead of accepting the best available price. Always calculate the round-trip cost. Before entering a trade, ask yourself how much you would need to earn to cover the spread and fees. This practice will help you make more informed decisions. The role of arbitrage in P2P spread When the spread between exchanges widens, some operators look for arbitrage opportunities: buy USDT on one platform at a lower price and sell it on another at a higher price. However, these opportunities quickly shrink as more players participate. PitbullChain offers tools such as the P2P Calculator, the Bank Comparator, and the Order Book to make that analysis easier. In the current order book, imbalances can be seen: buy volume reaches 1,258,106 USDT, while sell volume is much lower (153,421 USDT). This indicates that the market is dominated by buyers, which pushes prices upward. Understanding these flows will allow you to anticipate when the spread might narrow or widen. For example, if there are many more buyers than sellers, sellers may raise their prices and the spread increases. Final conclusions The spread is not an abstract concept or an irrelevant technical datum: it is the cost you pay every time you enter or exit the P2P market. In the Venezuelan context, with a premium above 20% versus the BCV, mastering it is essential so you do not erode your capital. Our figures come from PitbullChain's P2P Radar and the BCV, with a capture made on September 7, 2026. The traffic-light metric gives you a quick reading of conditions, but remember that the market changes constantly. Before your next trade, open the P2P Radar, review the buy and sell prices for your preferred bank, and apply the formula: buy price − sell price. That simple calculation will tell you how much you need to gain just to avoid losing.
41
·
--
Article
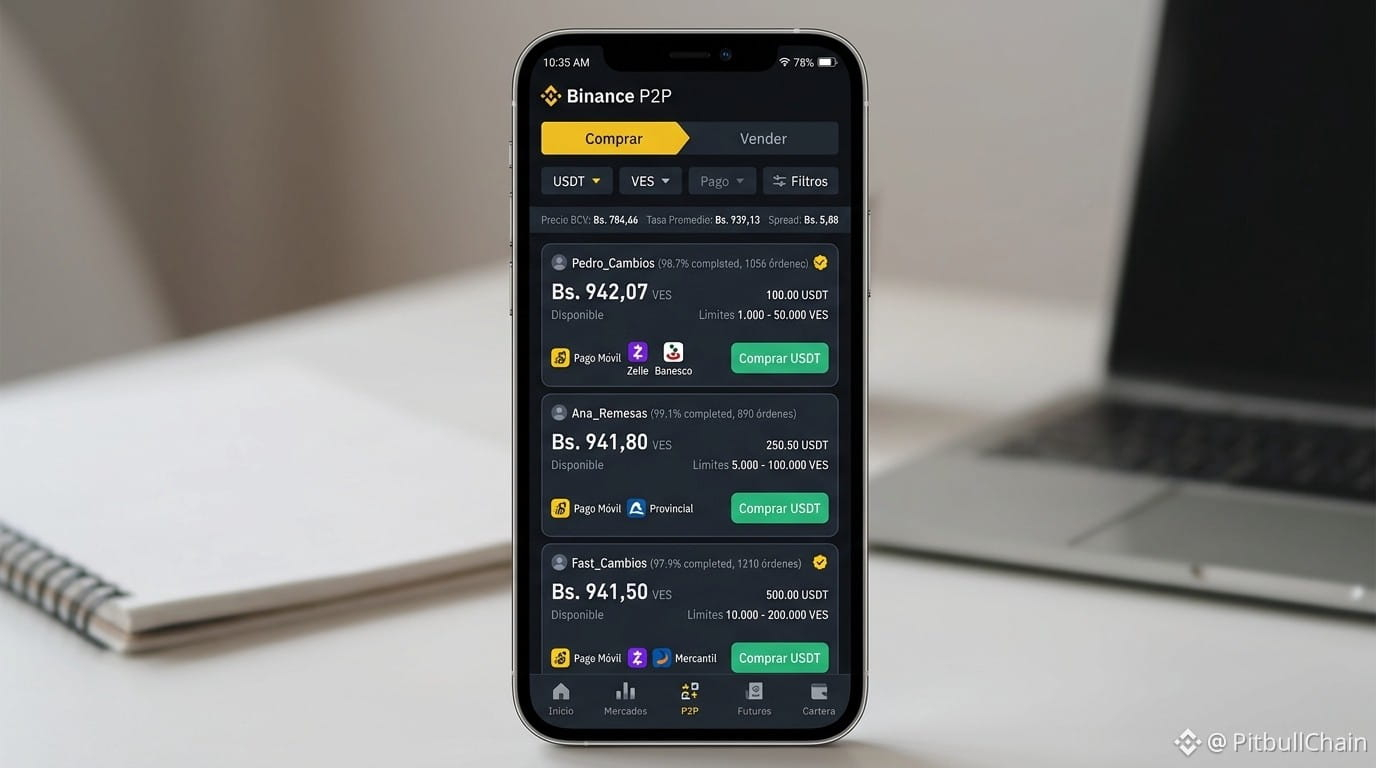
Order book spread vs P2P radar: where is real liquidity?In the Venezuelan P2P market, liquidity doesn’t look the same from the order book as it does from the P2P Radar. While the order book shows a tight spread of 0.04% (buy at 939.00 Bs and sell at 938.60 Bs), the average radar reports a spread of 8.30% (buy at 983.35 Bs and sell at 907.95 Bs). Which one reflects reality? The answer lies in depth and concentration by bank and exchange. Two measurements, two realities The order book takes the best available buy and sell offers at that moment. When the data was captured at 05:59 UTC on September 1, 2026, the best ask was 939.00 Bs and the best bid was 938.60 Bs, with a mid price of 938.80 Bs. This spread of 0.40 Bs (0.04%) indicates that if you trade at the top of the book, the cost to enter and exit is minimal. The P2P Radar, on the other hand, calculates the weighted average of all active offers across multiple exchanges. It includes ads with extreme prices: buyers willing to pay up to 983 Bs and sellers asking 908 Bs. That dispersion raises the average spread to 75.40 Bs (8.30%), a figure that reflects the user experience when they don’t filter for the best prices. The order book: depth and concentration by bank When analyzing the order book, we find key data: Total buy volume: 453,030.87 USDT (27 offers). Total sell volume: 112,261.47 USDT (25 offers). Imbalance: 60.28% toward the buy side. Liquidity is concentrated on the buy side, with large orders, especially at BancoDeVenezuela and BANK. For example, a single buy order of 76,870.62 USDT at 936.59 Bs and another of 49,569.86 USDT at 936.60 Bs dominate the bid side. This means that if you want to sell USDT quickly, there are buyers with real depth. On the sell side, the offers are more dispersed and smaller: the best sell order is 2,504.38 USDT at 939 Bs, followed by 4,559.50 USDT at 939.39 Bs. Sell depth is limited, which can cause slippage if you trade large amounts. The P2P radar: average offers and dispersion The radar aggregates 207 active offers, with an average USDT buy price of 983.35 Bs and a sell price of 907.95 Bs. This 8.30% gap doesn’t mean there is no liquidity—it means there is high price dispersion across banks and payment methods. For example, the Banesco bank has an average spread of 3.58%, while Pago Móvil (offers from other platforms) reaches 7.27%. In contrast, BancoDeVenezuela and Mercantil show spreads of 0.72% and 0.56%, respectively. This confirms that high-quality liquidity is concentrated in certain banks and exchanges. BancoDeVenezuela: the low-spread case The BancoDeVenezuela case deserves attention: its spread is only 0.72%, with an average buy price of 936.44 Bs and a sell price of 943.26 Bs, and 22 active offers. Inside the order book, BancoDeVenezuela orders appear on both the buy and sell sides. For example, there is a buy of 16,793.52 USDT at 938.10 Bs and a sell of 3,984.24 USDT at 943.50 Bs. This bank has an advantage: it’s enabled on Binance with multiple operators and flexible amounts. Its reduced spread indicates that market makers are active, leading to better prices for users trading with this method. The lesson: not all banks offer the same liquidity quality, and the radar hides that difference. Binance vs other exchanges: price differences In the order book, the exchanges present are Binance and other platforms. Binance concentrates most of the orders, with the best bid at 938.60 Bs and the best ask at 939.00 Bs. Other platforms, in contrast, show offers farther away: for example, a sale of 328 USDT at 949.99 Bs and a buy of 40,000 USDT at 933.50 Bs. This exchange-to-exchange difference is crucial. If a trader compares only the global radar, they’ll see a spread of 8.3%; but if they limit themselves to Binance and banks like BancoDeVenezuela, the effective spread drops to less than 1%. Even a divergence of up to 8.82% has been detected between Binance’s best offer and those of other exchanges like other platforms, according to opportunity data. Therefore, arbitrage between exchanges and banks remains viable, but it requires filtering for quality. Where is the real liquidity? Interpretation Real liquidity isn’t in the radar average, but in the places where the spread is narrow and depth is high. The order book shows strong demand for USDT (60% imbalance), mainly through BancoDeVenezuela and BANK. The supply is smaller, which explains why the sell price is higher and why the order book spread stays small only at the top. The P2P traffic light (yellow state, score 69) reinforces this interpretation: liquidity and bank availability receive high scores (95 and 95), but market depth is scored only 45. This means there are many offers, but few with large amounts and reasonable prices. The radar’s elevated spread is a symptom of that fragmentation. What the P2P traffic light means and how to use it The PitbullChain traffic light combines multiple metrics: spread (20 points), premium vs BCV (75), liquidity (95), depth (45), bank availability (95), volatility (80), freshness (100), and exchange health (95). The overall score of 69 points indicates mixed conditions. To trade in this environment, the practical recommendation is: Check the order book of your preferred exchange to see the real prices at the top of the book. Filter by BancoDeVenezuela or other banks with low spreads (Mercantil, BANK). Compare between Binance and other platforms, because the differences can exceed 1%. Don’t rely on the radar’s average spread; find liquidity at the depth levels. The real market liquidity for USDT/VES is where the spread compresses and the volume supports the trade. Being able to read the order book and the data by bank will give you an advantage that the radar average doesn’t show.
Order book spread vs P2P radar: where is real liquidity?
In the Venezuelan P2P market, liquidity doesn’t look the same from the order book as it does from the P2P Radar. While the order book shows a tight spread of 0.04% (buy at 939.00 Bs and sell at 938.60 Bs), the average radar reports a spread of 8.30% (buy at 983.35 Bs and sell at 907.95 Bs). Which one reflects reality? The answer lies in depth and concentration by bank and exchange. Two measurements, two realities The order book takes the best available buy and sell offers at that moment. When the data was captured at 05:59 UTC on September 1, 2026, the best ask was 939.00 Bs and the best bid was 938.60 Bs, with a mid price of 938.80 Bs. This spread of 0.40 Bs (0.04%) indicates that if you trade at the top of the book, the cost to enter and exit is minimal. The P2P Radar, on the other hand, calculates the weighted average of all active offers across multiple exchanges. It includes ads with extreme prices: buyers willing to pay up to 983 Bs and sellers asking 908 Bs. That dispersion raises the average spread to 75.40 Bs (8.30%), a figure that reflects the user experience when they don’t filter for the best prices. The order book: depth and concentration by bank When analyzing the order book, we find key data: Total buy volume: 453,030.87 USDT (27 offers). Total sell volume: 112,261.47 USDT (25 offers). Imbalance: 60.28% toward the buy side. Liquidity is concentrated on the buy side, with large orders, especially at BancoDeVenezuela and BANK. For example, a single buy order of 76,870.62 USDT at 936.59 Bs and another of 49,569.86 USDT at 936.60 Bs dominate the bid side. This means that if you want to sell USDT quickly, there are buyers with real depth. On the sell side, the offers are more dispersed and smaller: the best sell order is 2,504.38 USDT at 939 Bs, followed by 4,559.50 USDT at 939.39 Bs. Sell depth is limited, which can cause slippage if you trade large amounts. The P2P radar: average offers and dispersion The radar aggregates 207 active offers, with an average USDT buy price of 983.35 Bs and a sell price of 907.95 Bs. This 8.30% gap doesn’t mean there is no liquidity—it means there is high price dispersion across banks and payment methods. For example, the Banesco bank has an average spread of 3.58%, while Pago Móvil (offers from other platforms) reaches 7.27%. In contrast, BancoDeVenezuela and Mercantil show spreads of 0.72% and 0.56%, respectively. This confirms that high-quality liquidity is concentrated in certain banks and exchanges. BancoDeVenezuela: the low-spread case The BancoDeVenezuela case deserves attention: its spread is only 0.72%, with an average buy price of 936.44 Bs and a sell price of 943.26 Bs, and 22 active offers. Inside the order book, BancoDeVenezuela orders appear on both the buy and sell sides. For example, there is a buy of 16,793.52 USDT at 938.10 Bs and a sell of 3,984.24 USDT at 943.50 Bs. This bank has an advantage: it’s enabled on Binance with multiple operators and flexible amounts. Its reduced spread indicates that market makers are active, leading to better prices for users trading with this method. The lesson: not all banks offer the same liquidity quality, and the radar hides that difference. Binance vs other exchanges: price differences In the order book, the exchanges present are Binance and other platforms. Binance concentrates most of the orders, with the best bid at 938.60 Bs and the best ask at 939.00 Bs. Other platforms, in contrast, show offers farther away: for example, a sale of 328 USDT at 949.99 Bs and a buy of 40,000 USDT at 933.50 Bs. This exchange-to-exchange difference is crucial. If a trader compares only the global radar, they’ll see a spread of 8.3%; but if they limit themselves to Binance and banks like BancoDeVenezuela, the effective spread drops to less than 1%. Even a divergence of up to 8.82% has been detected between Binance’s best offer and those of other exchanges like other platforms, according to opportunity data. Therefore, arbitrage between exchanges and banks remains viable, but it requires filtering for quality. Where is the real liquidity? Interpretation Real liquidity isn’t in the radar average, but in the places where the spread is narrow and depth is high. The order book shows strong demand for USDT (60% imbalance), mainly through BancoDeVenezuela and BANK. The supply is smaller, which explains why the sell price is higher and why the order book spread stays small only at the top. The P2P traffic light (yellow state, score 69) reinforces this interpretation: liquidity and bank availability receive high scores (95 and 95), but market depth is scored only 45. This means there are many offers, but few with large amounts and reasonable prices. The radar’s elevated spread is a symptom of that fragmentation. What the P2P traffic light means and how to use it The PitbullChain traffic light combines multiple metrics: spread (20 points), premium vs BCV (75), liquidity (95), depth (45), bank availability (95), volatility (80), freshness (100), and exchange health (95). The overall score of 69 points indicates mixed conditions. To trade in this environment, the practical recommendation is: Check the order book of your preferred exchange to see the real prices at the top of the book. Filter by BancoDeVenezuela or other banks with low spreads (Mercantil, BANK). Compare between Binance and other platforms, because the differences can exceed 1%. Don’t rely on the radar’s average spread; find liquidity at the depth levels. The real market liquidity for USDT/VES is where the spread compresses and the volume supports the trade. Being able to read the order book and the data by bank will give you an advantage that the radar average doesn’t show.
24
·
--
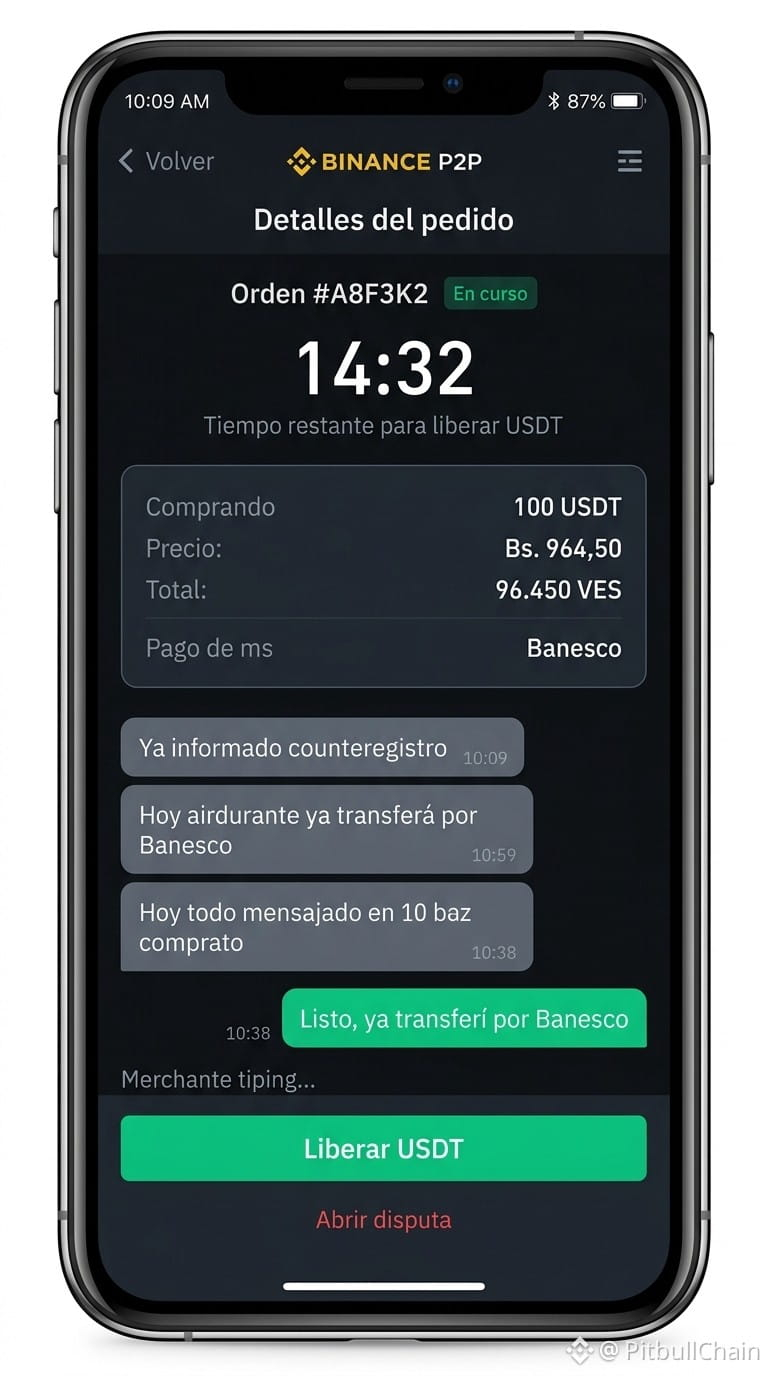
The BCV says the gap fell to 12.3%, but in the P2P the reality has another price: you buy at 964.50 and you sell at 905.64. If you do the subtraction, you get 58.86 Bs per USDT—a 6.50% spread that eats you up if you don’t look at both sides of the trade. And pay attention: the price is still 22.47% above the official one. With 249 active offers on Binance, there’s liquidity, but you also have to know how to read the market. Traders move about $44 million per day in this ecosystem, so the volume speaks for itself. My advice: compare before you hit the button, check the spread, and don’t get carried away just by the buy price. The street always has its own thermometer.
📊 Live rates and analysis at pitbullchain.com
#P2PVenezuela #Spread #USDT #BinanceSquare
The BCV says the gap fell to 12.3%, but in the P2P the reality has another price: you buy at 964.50 and you sell at 905.64. If you do the subtraction, you get 58.86 Bs per USDT—a 6.50% spread that eats you up if you don’t look at both sides of the trade. And pay attention: the price is still 22.47% above the official one. With 249 active offers on Binance, there’s liquidity, but you also have to know how to read the market. Traders move about $44 million per day in this ecosystem, so the volume speaks for itself. My advice: compare before you hit the button, check the spread, and don’t get carried away just by the buy price. The street always has its own thermometer.
📊 Live rates and analysis at pitbullchain.com
#P2PVenezuela #Spread #USDT #BinanceSquare
📊 Live rates and analysis at pitbullchain.com
#P2PVenezuela #Spread #USDT #BinanceSquare
38

·
--
$SPREAD REGISTERS US COMPANY – WHAT THIS MEANS FOR THE PROJECT 🎯
Market structure isn't always about price action. Sometimes the strongest signal comes from a project's legal framework.
Spreadefi's decision to formally incorporate in the United States after two years of product development adds a layer of transparency that institutions and serious capital look for. The team has been publicly active with consistent updates and conference participation—hallmarks of a project building for the long run.
This registration doesn't change the underlying technology, but it reduces counterparty uncertainty. Does a legal entity move the needle for your conviction in a DeFi project?
Not financial advice. Always manage your risk.
#SPREAD #DeFi #ProjectUpdate #Transparency #CryptoNews
🎯
$SPREAD REGISTERS US COMPANY – WHAT THIS MEANS FOR THE PROJECT 🎯
Market structure isn't always about price action. Sometimes the strongest signal comes from a project's legal framework.
Spreadefi's decision to formally incorporate in the United States after two years of product development adds a layer of transparency that institutions and serious capital look for. The team has been publicly active with consistent updates and conference participation—hallmarks of a project building for the long run.
This registration doesn't change the underlying technology, but it reduces counterparty uncertainty. Does a legal entity move the needle for your conviction in a DeFi project?
Not financial advice. Always manage your risk.
#SPREAD #DeFi #ProjectUpdate #Transparency #CryptoNews
🎯
Market structure isn't always about price action. Sometimes the strongest signal comes from a project's legal framework.
Spreadefi's decision to formally incorporate in the United States after two years of product development adds a layer of transparency that institutions and serious capital look for. The team has been publicly active with consistent updates and conference participation—hallmarks of a project building for the long run.
This registration doesn't change the underlying technology, but it reduces counterparty uncertainty. Does a legal entity move the needle for your conviction in a DeFi project?
Not financial advice. Always manage your risk.
#SPREAD #DeFi #ProjectUpdate #Transparency #CryptoNews
🎯
15

·
--
Liquidity and the price spread can affect your trade
Liquidity refers to how easily you can buy or sell an asset without significantly moving its price.
In markets with high liquidity, orders are typically available more easily, and the difference between the buy and sell prices may be smaller. This difference is known as the spread.
As for assets with low liquidity, you may enter at a higher price than you expected or exit at a lower price—especially when using a market order or executing a large amount.
Don’t look only at the rate of increase. Watch the trading volume, the order book, and the price spread.
A currency that rises quickly is not necessarily easy to exit from when you want to.
#السيولة #Spread #إدارة_المخاطر
$BTC
$BNB
$ETH
Liquidity and the price spread can affect your trade
Liquidity refers to how easily you can buy or sell an asset without significantly moving its price.
In markets with high liquidity, orders are typically available more easily, and the difference between the buy and sell prices may be smaller. This difference is known as the spread.
As for assets with low liquidity, you may enter at a higher price than you expected or exit at a lower price—especially when using a market order or executing a large amount.
Don’t look only at the rate of increase. Watch the trading volume, the order book, and the price spread.
A currency that rises quickly is not necessarily easy to exit from when you want to.
#السيولة #Spread #إدارة_المخاطر
$BTC
$BNB
$ETH
Liquidity refers to how easily you can buy or sell an asset without significantly moving its price.
In markets with high liquidity, orders are typically available more easily, and the difference between the buy and sell prices may be smaller. This difference is known as the spread.
As for assets with low liquidity, you may enter at a higher price than you expected or exit at a lower price—especially when using a market order or executing a large amount.
Don’t look only at the rate of increase. Watch the trading volume, the order book, and the price spread.
A currency that rises quickly is not necessarily easy to exit from when you want to.
#السيولة #Spread #إدارة_المخاطر
$BTC
$BNB
$ETH
170

MARGIN CALL DUE TO SPREAD: HOW THE MARKET MAKER TAKES YOU OUT DURING NEWS 📊💥
Important economic data is dropping (CPI or Fed rate). Your stop is set far away, position is insured. Suddenly there's a minute impulse, your stop isn’t hit, but you still get liquidated on a margin call. How does that happen?
• At the moment important news drops, liquidity from the order book completely vanishes — bots shut down. The difference between the best buy and sell price (spread) balloons to gigantic sizes.
• The exchange can liquidate you at the Ask/Bid price, which due to the spread skyrocketed, while on the chart the average price (Mark Price) stayed normal. Never hold positions during major news events.
👇 Open the ETH widget. Have you ever lost money on news whipsaws?
#Spread #Liquidation #Ethereum $ETH
{spot}(ETHUSDT)
#CryptoFREEMEN
MARGIN CALL DUE TO SPREAD: HOW THE MARKET MAKER TAKES YOU OUT DURING NEWS 📊💥
Important economic data is dropping (CPI or Fed rate). Your stop is set far away, position is insured. Suddenly there's a minute impulse, your stop isn’t hit, but you still get liquidated on a margin call. How does that happen?
• At the moment important news drops, liquidity from the order book completely vanishes — bots shut down. The difference between the best buy and sell price (spread) balloons to gigantic sizes.
• The exchange can liquidate you at the Ask/Bid price, which due to the spread skyrocketed, while on the chart the average price (Mark Price) stayed normal. Never hold positions during major news events.
👇 Open the ETH widget. Have you ever lost money on news whipsaws?
#Spread #Liquidation #Ethereum $ETH
#CryptoFREEMEN
Important economic data is dropping (CPI or Fed rate). Your stop is set far away, position is insured. Suddenly there's a minute impulse, your stop isn’t hit, but you still get liquidated on a margin call. How does that happen?
• At the moment important news drops, liquidity from the order book completely vanishes — bots shut down. The difference between the best buy and sell price (spread) balloons to gigantic sizes.
• The exchange can liquidate you at the Ask/Bid price, which due to the spread skyrocketed, while on the chart the average price (Mark Price) stayed normal. Never hold positions during major news events.
👇 Open the ETH widget. Have you ever lost money on news whipsaws?
#Spread #Liquidation #Ethereum $ETH
#CryptoFREEMEN
95

$SPREAD MAKES OFFICIAL MOVE — COMPANY NOW REGISTERED IN THE US 🔥
After two years of building and shipping on the DeFi side, Spreadefi just completed its U.S. incorporation. That’s a serious signal — most projects never get this far. The team is now operating under a transparent legal structure, publicly visible in U.S. registries. They’ve been showing up at conferences, publishing product updates, and building a community the whole time.
This move opens doors for partnerships and scaling that fly-by-night operations can’t touch. The question is whether the market will price in this long-term commitment. Are you keeping an eye on $SPREAD now?
Not financial advice. Always manage your risk.
#SPREAD #DeFi #Incorporation #Transparency #Crypto
🔥
$SPREAD MAKES OFFICIAL MOVE — COMPANY NOW REGISTERED IN THE US 🔥
After two years of building and shipping on the DeFi side, Spreadefi just completed its U.S. incorporation. That’s a serious signal — most projects never get this far. The team is now operating under a transparent legal structure, publicly visible in U.S. registries. They’ve been showing up at conferences, publishing product updates, and building a community the whole time.
This move opens doors for partnerships and scaling that fly-by-night operations can’t touch. The question is whether the market will price in this long-term commitment. Are you keeping an eye on $SPREAD now?
Not financial advice. Always manage your risk.
#SPREAD #DeFi #Incorporation #Transparency #Crypto
🔥
After two years of building and shipping on the DeFi side, Spreadefi just completed its U.S. incorporation. That’s a serious signal — most projects never get this far. The team is now operating under a transparent legal structure, publicly visible in U.S. registries. They’ve been showing up at conferences, publishing product updates, and building a community the whole time.
This move opens doors for partnerships and scaling that fly-by-night operations can’t touch. The question is whether the market will price in this long-term commitment. Are you keeping an eye on $SPREAD now?
Not financial advice. Always manage your risk.
#SPREAD #DeFi #Incorporation #Transparency #Crypto
🔥
12

🚨 $SPREAD HITS 12,000 USERS — LIQUIDITY INFRASTRUCTURE WAKING UP! 💥
📊 While the crowd chases the next green candle, the real signal is quietly compounding: 12,000 registered users on Spreadefi means liquidity providers are voting with their assets. Every new account adds fuel to the pool engine — and the team is scaling technical capacity to keep up with that demand. That’s not a pump; that’s a foundation being laid.
💡 The roadmap is stacked: a mobile app for iOS, upgraded UI, and automated allocation algorithms sharpening the yield curve. When user onboarding meets tech velocity, the flywheel starts spinning. The question isn’t whether liquidity floors matter — it’s who gets positioned before the next wave of participants floods in. 💬 Are you watching user growth as a leading indicator, or only staring at price action? 👇
⚠️ Not financial advice. Always manage your risk. 🛡️
🏷️ #SPREAD #LiquidityPools #DeFi #UserGrowth #Crypto
🦈 💎
🚨 $SPREAD HITS 12,000 USERS — LIQUIDITY INFRASTRUCTURE WAKING UP! 💥
📊 While the crowd chases the next green candle, the real signal is quietly compounding: 12,000 registered users on Spreadefi means liquidity providers are voting with their assets. Every new account adds fuel to the pool engine — and the team is scaling technical capacity to keep up with that demand. That’s not a pump; that’s a foundation being laid.
💡 The roadmap is stacked: a mobile app for iOS, upgraded UI, and automated allocation algorithms sharpening the yield curve. When user onboarding meets tech velocity, the flywheel starts spinning. The question isn’t whether liquidity floors matter — it’s who gets positioned before the next wave of participants floods in. 💬 Are you watching user growth as a leading indicator, or only staring at price action? 👇
⚠️ Not financial advice. Always manage your risk. 🛡️
🏷️ #SPREAD #LiquidityPools #DeFi #UserGrowth #Crypto
🦈 💎
📊 While the crowd chases the next green candle, the real signal is quietly compounding: 12,000 registered users on Spreadefi means liquidity providers are voting with their assets. Every new account adds fuel to the pool engine — and the team is scaling technical capacity to keep up with that demand. That’s not a pump; that’s a foundation being laid.
💡 The roadmap is stacked: a mobile app for iOS, upgraded UI, and automated allocation algorithms sharpening the yield curve. When user onboarding meets tech velocity, the flywheel starts spinning. The question isn’t whether liquidity floors matter — it’s who gets positioned before the next wave of participants floods in. 💬 Are you watching user growth as a leading indicator, or only staring at price action? 👇
⚠️ Not financial advice. Always manage your risk. 🛡️
🏷️ #SPREAD #LiquidityPools #DeFi #UserGrowth #Crypto
🦈 💎
15

·
--
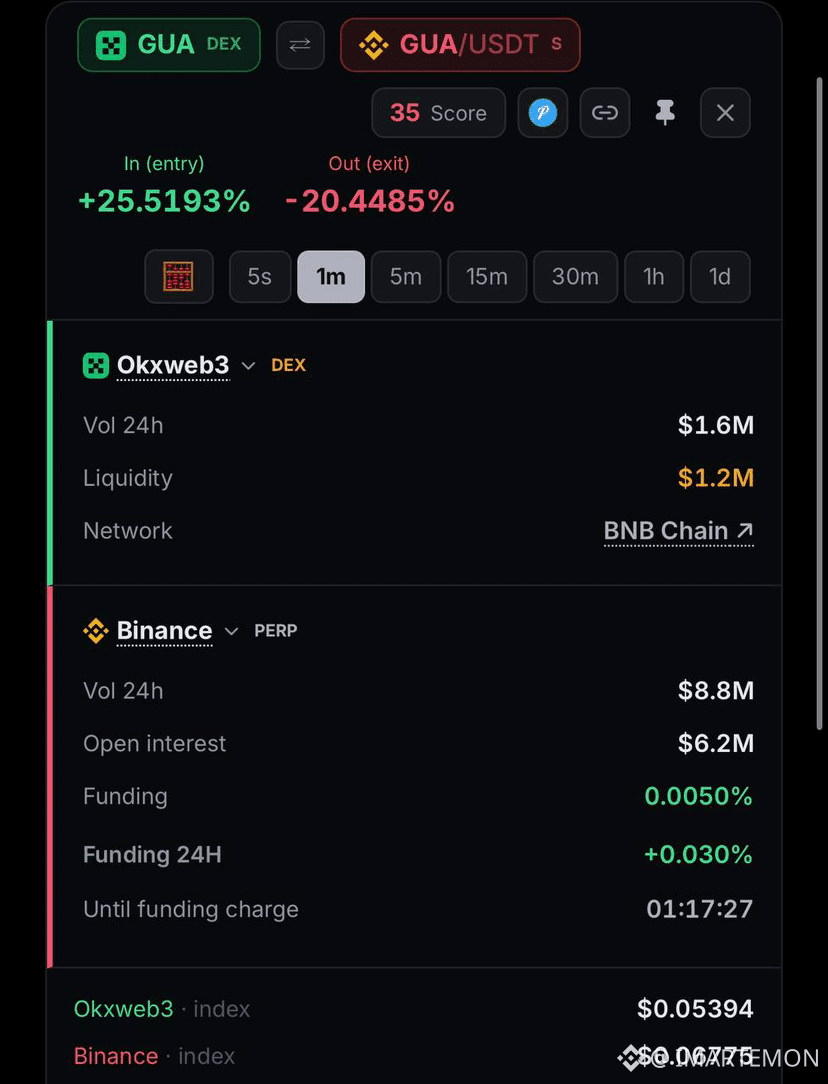
Free money? Not quite. But this DEX/PERP spread is the closest thing to it 👇
Sitting in this $GUA spread — my average entry is around 17-18%. Planning to add more if the spread goes above 35%.
IMO, anything 23%+ is a solid first entry (long spot on DEX + short perp on Binance).
⚠️ Key rules:
Keep your liquidation point on the hedge short FAR away. Funding won’t hurt you here.
That’s pretty much it — simple setup, just manage your risk.
DYOR.
#spread #arbitrage #dex
Free money? Not quite. But this DEX/PERP spread is the closest thing to it 👇
Sitting in this $GUA spread — my average entry is around 17-18%. Planning to add more if the spread goes above 35%.
IMO, anything 23%+ is a solid first entry (long spot on DEX + short perp on Binance).
⚠️ Key rules:
Keep your liquidation point on the hedge short FAR away. Funding won’t hurt you here.
That’s pretty much it — simple setup, just manage your risk.
DYOR.
#spread #arbitrage #dex
Sitting in this $GUA spread — my average entry is around 17-18%. Planning to add more if the spread goes above 35%.
IMO, anything 23%+ is a solid first entry (long spot on DEX + short perp on Binance).
⚠️ Key rules:
Keep your liquidation point on the hedge short FAR away. Funding won’t hurt you here.
That’s pretty much it — simple setup, just manage your risk.
DYOR.
#spread #arbitrage #dex
1
254

·
--
179
·
--
Article
Premium of P2P USDT vs BCV reaches 20.6%: market analysis Live P2P Radar Capture: 27/8/2026, 6:00:17 p. m.
USDT/VES reference Bs. 954.15
Buy USDT Bs. 954.15
Sell USDT Bs. 919.68
BCV Bs. 791.32
Premium vs BCV 20.58%
P2P spread 3.75%
Offers observed 231
Verify current data on P2P Radar
Venezuela’s P2P market continues to show a significant gap between the USDT price and the official dollar. According to data captured by PitbullChain’s P2P Radar on August 27, 2026 at 22:00 UTC, USDT P2P is trading at 954.1453 bolívares per unit, which represents a premium of 20.58% versus the BCV dollar, located at 791.3248 Bs. The difference is even more pronounced if we consider that the parallel dollar is at 945.97 Bs, very close to the USDT price.
Premium of P2P USDT vs BCV reaches 20.6%: market analysis
Live P2P Radar Capture: 27/8/2026, 6:00:17 p. m.
USDT/VES reference Bs. 954.15
Buy USDT Bs. 954.15
Sell USDT Bs. 919.68
BCV Bs. 791.32
Premium vs BCV 20.58%
P2P spread 3.75%
Offers observed 231
Verify current data on P2P Radar
Venezuela’s P2P market continues to show a significant gap between the USDT price and the official dollar. According to data captured by PitbullChain’s P2P Radar on August 27, 2026 at 22:00 UTC, USDT P2P is trading at 954.1453 bolívares per unit, which represents a premium of 20.58% versus the BCV dollar, located at 791.3248 Bs. The difference is even more pronounced if we consider that the parallel dollar is at 945.97 Bs, very close to the USDT price.
USDT/VES reference Bs. 954.15
Buy USDT Bs. 954.15
Sell USDT Bs. 919.68
BCV Bs. 791.32
Premium vs BCV 20.58%
P2P spread 3.75%
Offers observed 231
Verify current data on P2P Radar
Venezuela’s P2P market continues to show a significant gap between the USDT price and the official dollar. According to data captured by PitbullChain’s P2P Radar on August 27, 2026 at 22:00 UTC, USDT P2P is trading at 954.1453 bolívares per unit, which represents a premium of 20.58% versus the BCV dollar, located at 791.3248 Bs. The difference is even more pronounced if we consider that the parallel dollar is at 945.97 Bs, very close to the USDT price.
3
·
--
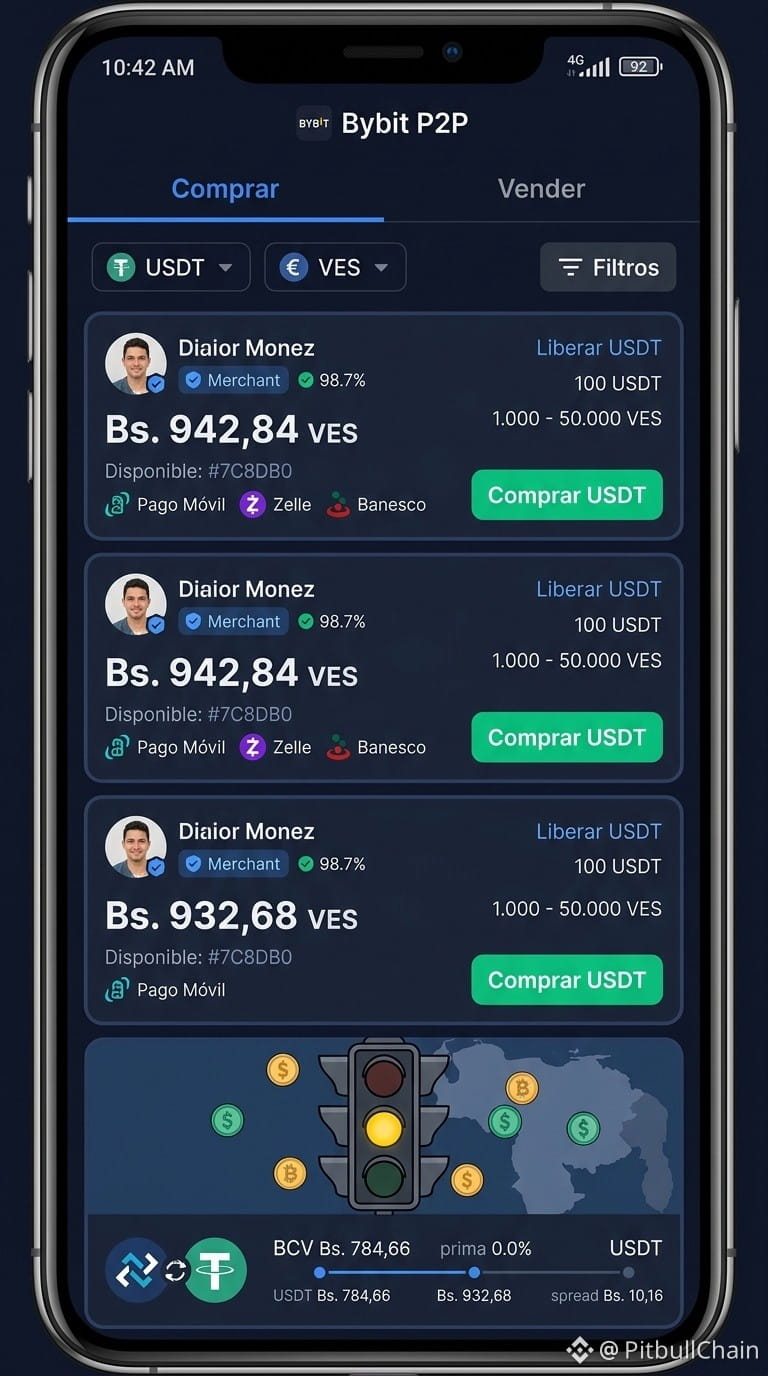
Article
USDT P2P: 20.88% premium vs BCV and a yellow traffic light Live P2P Radar screenshot: 28/8/2026, 5:00:16 a. m.
USDT/VES reference Bs. 956.96
Buy USDT Bs. 956.96
USDT sale Bs. 899.39
BCV Bs. 791.67
Premium vs BCV 20.88%
P2P spread 6.40%
Observed offers 199
Verify current data in P2P Radar
The Venezuelan P2P market starts on August 28, 2026 with a clear signal: the USDT premium versus BCV stands at 20.88%, while the spread between buy and sell reaches 6.4%. PitbullChain’s P2P traffic light, based on live data from the P2P Radar and official sources, turns on the yellow light with a score of 65/100. What lies behind this gap and what does it mean for those who trade cryptocurrencies in Venezuela?
USDT P2P: 20.88% premium vs BCV and a yellow traffic light
Live P2P Radar screenshot: 28/8/2026, 5:00:16 a. m.
USDT/VES reference Bs. 956.96
Buy USDT Bs. 956.96
USDT sale Bs. 899.39
BCV Bs. 791.67
Premium vs BCV 20.88%
P2P spread 6.40%
Observed offers 199
Verify current data in P2P Radar
The Venezuelan P2P market starts on August 28, 2026 with a clear signal: the USDT premium versus BCV stands at 20.88%, while the spread between buy and sell reaches 6.4%. PitbullChain’s P2P traffic light, based on live data from the P2P Radar and official sources, turns on the yellow light with a score of 65/100. What lies behind this gap and what does it mean for those who trade cryptocurrencies in Venezuela?
USDT/VES reference Bs. 956.96
Buy USDT Bs. 956.96
USDT sale Bs. 899.39
BCV Bs. 791.67
Premium vs BCV 20.88%
P2P spread 6.40%
Observed offers 199
Verify current data in P2P Radar
The Venezuelan P2P market starts on August 28, 2026 with a clear signal: the USDT premium versus BCV stands at 20.88%, while the spread between buy and sell reaches 6.4%. PitbullChain’s P2P traffic light, based on live data from the P2P Radar and official sources, turns on the yellow light with a score of 65/100. What lies behind this gap and what does it mean for those who trade cryptocurrencies in Venezuela?
1
·
--
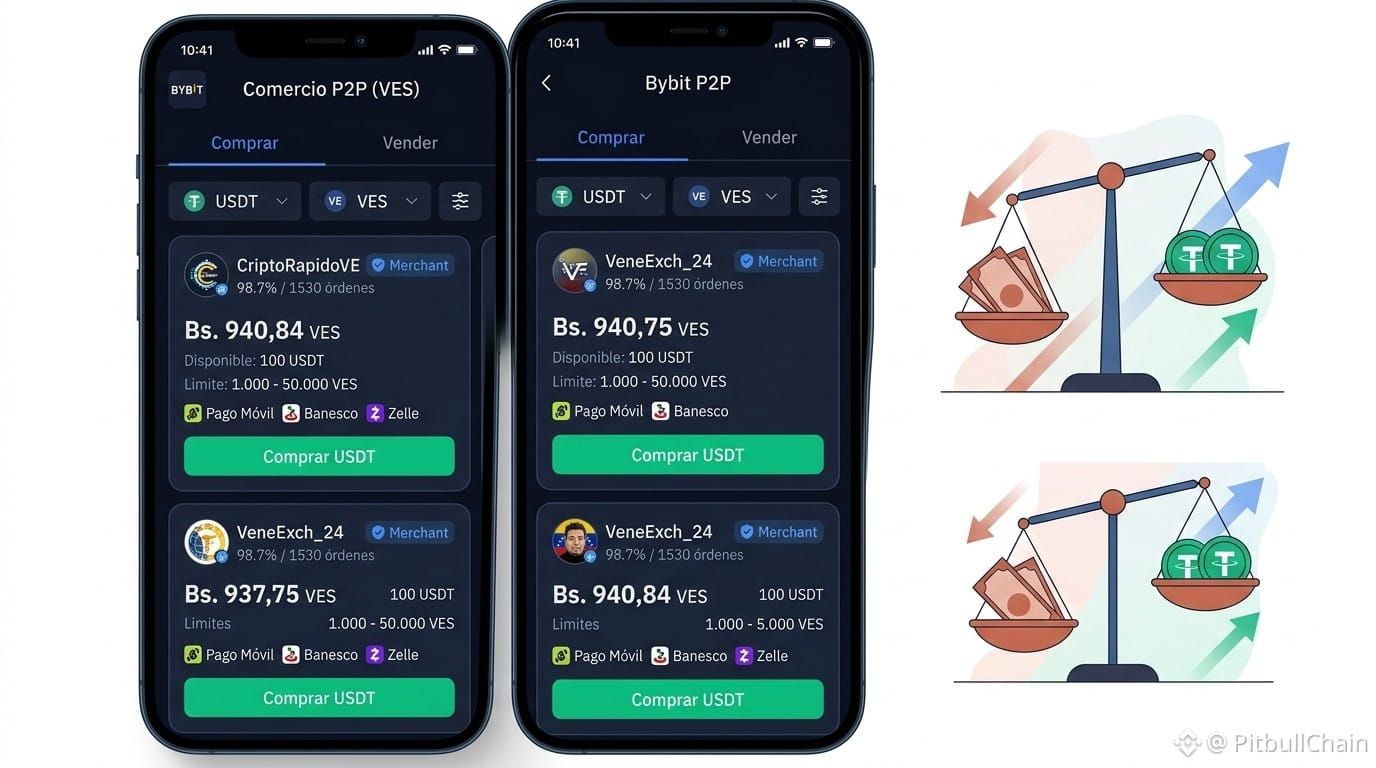
Article
Spread in P2P: what it is, how it’s calculated, and why it matters Live P2P Radar Capture: 28/8/2026, 10:00:13 a. m.
USDT/VES reference Bs. 950.34
Buy USDT Bs. 950.34
USDT sale Bs. 908.07
BCV Bs. 791.67
Premium vs BCV 20.04%
P2P spread 4.66%
Offers observed 237
Check current data on P2P Radar
If you’ve ever traded USDT for bolívares in the P2P market, you’re probably already aware that the price isn’t unique. According to PitbullChain’s P2P Radar, as of August 28, 2026 at 2:00 PM, buying USDT averages Bs. 950.34, while selling it would give you Bs. 908.07. That gap is the spread, and understanding it is key to not losing money along the way.
Spread in P2P: what it is, how it’s calculated, and why it matters
Live P2P Radar Capture: 28/8/2026, 10:00:13 a. m.
USDT/VES reference Bs. 950.34
Buy USDT Bs. 950.34
USDT sale Bs. 908.07
BCV Bs. 791.67
Premium vs BCV 20.04%
P2P spread 4.66%
Offers observed 237
Check current data on P2P Radar
If you’ve ever traded USDT for bolívares in the P2P market, you’re probably already aware that the price isn’t unique. According to PitbullChain’s P2P Radar, as of August 28, 2026 at 2:00 PM, buying USDT averages Bs. 950.34, while selling it would give you Bs. 908.07. That gap is the spread, and understanding it is key to not losing money along the way.
USDT/VES reference Bs. 950.34
Buy USDT Bs. 950.34
USDT sale Bs. 908.07
BCV Bs. 791.67
Premium vs BCV 20.04%
P2P spread 4.66%
Offers observed 237
Check current data on P2P Radar
If you’ve ever traded USDT for bolívares in the P2P market, you’re probably already aware that the price isn’t unique. According to PitbullChain’s P2P Radar, as of August 28, 2026 at 2:00 PM, buying USDT averages Bs. 950.34, while selling it would give you Bs. 908.07. That gap is the spread, and understanding it is key to not losing money along the way.
1
·
--
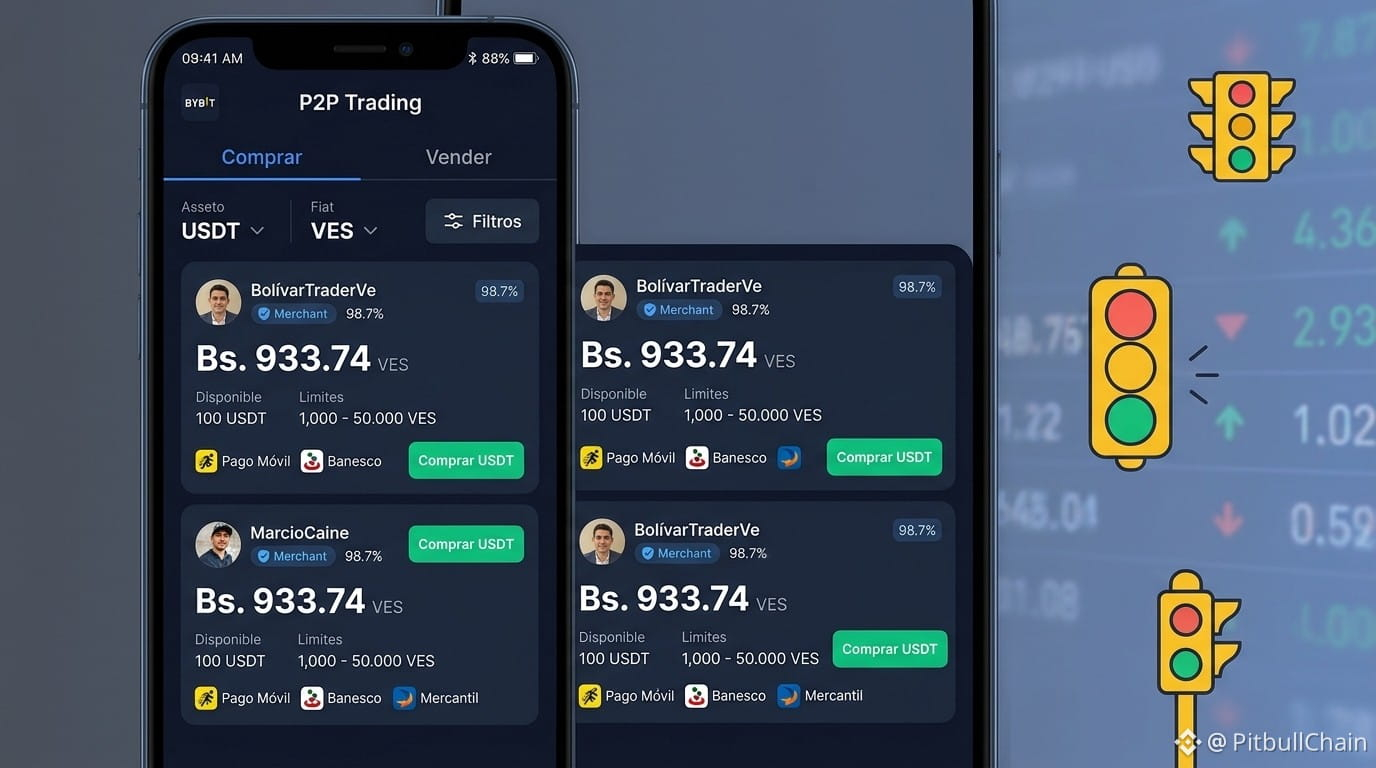
Article
P2P traffic light is yellow: 4.27% spread and high liquidity in the USDT/VES marketLive P2P Radar capture: 28/8/2026, 11:30:14 a.m.
USDT/VES reference Bs. 941.18
Buy USDT Bs. 941.18
USDT buy price Bs. 902.63
BCV Bs. 791.67
Premium vs BCV 18.89%
P2P spread 4.27%
Offers observed 254
Verify current data in P2P Radar
PitbullChain's P2P traffic light was set this Friday, August 28, 2026, to yellow (score: 69/100), which translates into "moderate caution" for the USDT/VES market. The signal comes with a 4.27% spread and high liquidity, with 254 active offers detected by the P2P Radar.
P2P traffic light is yellow: 4.27% spread and high liquidity in the USDT/VES market
Live P2P Radar capture: 28/8/2026, 11:30:14 a.m.
USDT/VES reference Bs. 941.18
Buy USDT Bs. 941.18
USDT buy price Bs. 902.63
BCV Bs. 791.67
Premium vs BCV 18.89%
P2P spread 4.27%
Offers observed 254
Verify current data in P2P Radar
PitbullChain's P2P traffic light was set this Friday, August 28, 2026, to yellow (score: 69/100), which translates into "moderate caution" for the USDT/VES market. The signal comes with a 4.27% spread and high liquidity, with 254 active offers detected by the P2P Radar.
USDT/VES reference Bs. 941.18
Buy USDT Bs. 941.18
USDT buy price Bs. 902.63
BCV Bs. 791.67
Premium vs BCV 18.89%
P2P spread 4.27%
Offers observed 254
Verify current data in P2P Radar
PitbullChain's P2P traffic light was set this Friday, August 28, 2026, to yellow (score: 69/100), which translates into "moderate caution" for the USDT/VES market. The signal comes with a 4.27% spread and high liquidity, with 254 active offers detected by the P2P Radar.
1
4
·
--
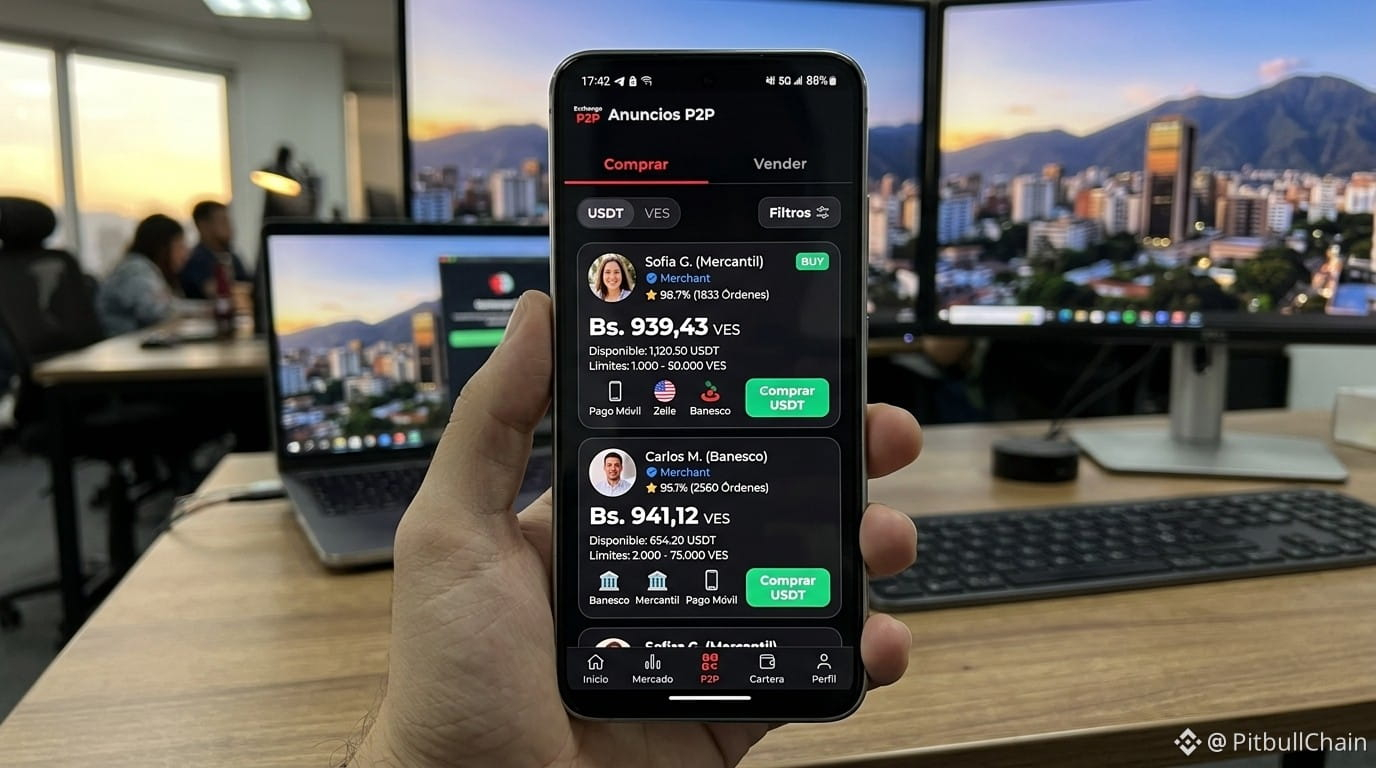
Article
Digital Dollar in Venezuela: A 2026 snapshot of the P2P market Live P2P Radar Capture: 28/8/2026, 10:30:12 a. m.
USDT/VES reference Bs. 948.34
Buy USDT Bs. 948.34
USDT sell price Bs. 908.79
BCV Bs. 791.67
Premium vs BCV 19.79%
P2P spread 4.35%
Offers observed 245
Verify current data in Radar P2P
The Venezuelan P2P market remains the main barometer of digital dollarization. As of August 28, 2026, PitbullChain's P2P Radar data shows that USDT is traded in bolívares with a premium of 19.79% over the official BCV dollar (791.67 Bs/USD), while the reference P2P rate stands at 948.34 Bs for buying and 908.79 Bs for selling. This mixed scenario —yellow light, with 69 points— requires traders to closely examine the spread and liquidity.
Digital Dollar in Venezuela: A 2026 snapshot of the P2P market
Live P2P Radar Capture: 28/8/2026, 10:30:12 a. m.
USDT/VES reference Bs. 948.34
Buy USDT Bs. 948.34
USDT sell price Bs. 908.79
BCV Bs. 791.67
Premium vs BCV 19.79%
P2P spread 4.35%
Offers observed 245
Verify current data in Radar P2P
The Venezuelan P2P market remains the main barometer of digital dollarization. As of August 28, 2026, PitbullChain's P2P Radar data shows that USDT is traded in bolívares with a premium of 19.79% over the official BCV dollar (791.67 Bs/USD), while the reference P2P rate stands at 948.34 Bs for buying and 908.79 Bs for selling. This mixed scenario —yellow light, with 69 points— requires traders to closely examine the spread and liquidity.
USDT/VES reference Bs. 948.34
Buy USDT Bs. 948.34
USDT sell price Bs. 908.79
BCV Bs. 791.67
Premium vs BCV 19.79%
P2P spread 4.35%
Offers observed 245
Verify current data in Radar P2P
The Venezuelan P2P market remains the main barometer of digital dollarization. As of August 28, 2026, PitbullChain's P2P Radar data shows that USDT is traded in bolívares with a premium of 19.79% over the official BCV dollar (791.67 Bs/USD), while the reference P2P rate stands at 948.34 Bs for buying and 908.79 Bs for selling. This mixed scenario —yellow light, with 69 points— requires traders to closely examine the spread and liquidity.
8
·
--
Article
P2P Spread USDT/VES: why the 4.2% is misleading and the real one is 0.04% Live P2P Radar Capture: 28/8/2026, 1:30:16 p. m.
USDT/VES reference Bs. 941.71
Buy USDT Bs. 941.71
USDT Sale Bs. 903.46
BCV Bs. 791.67
Premium vs BCV 18.95%
P2P Spread 4.23%
Observed offers 262
Verify current data in Radar P2P
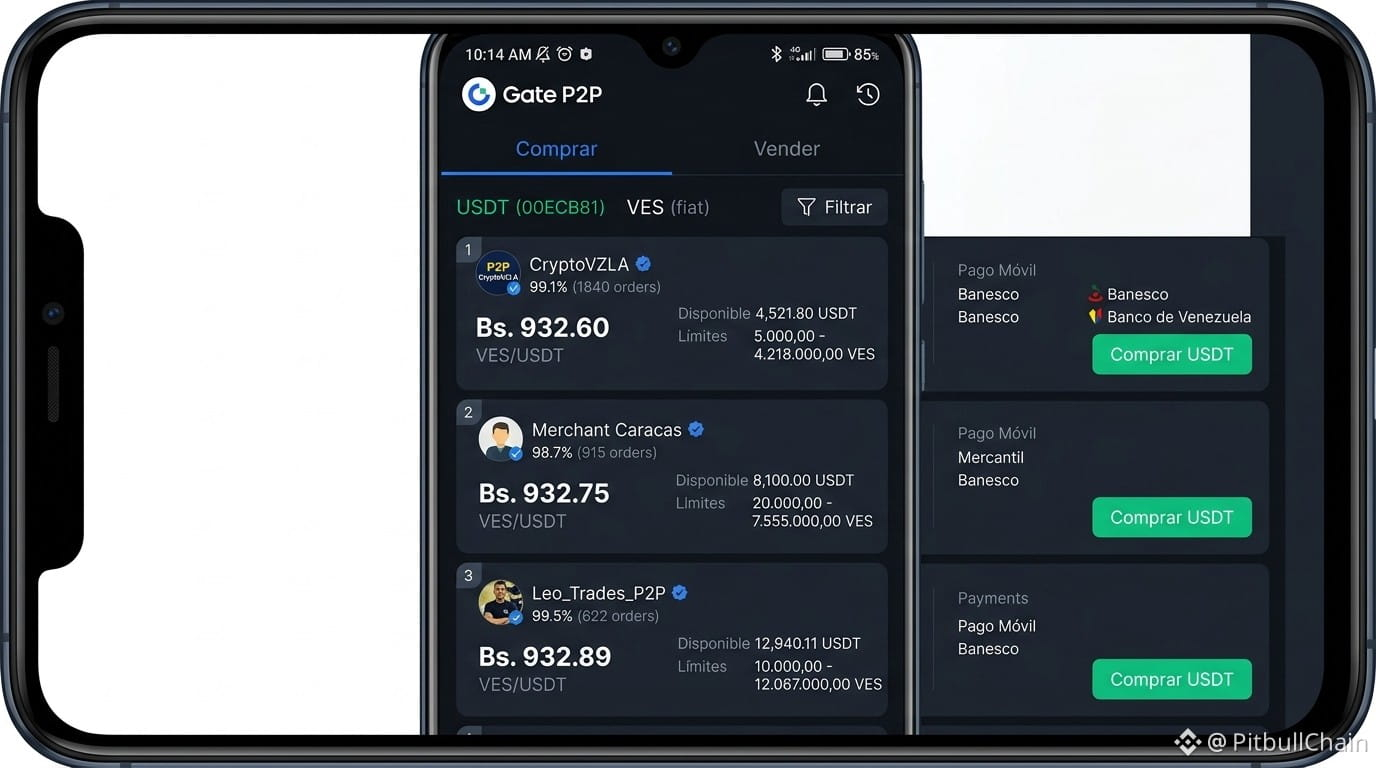
In the Venezuelan P2P market, not all prices are the same. While the P2P Radar shows an average spread of 4.23% between buying and selling USDT, the order book on Binance and other platforms reveals a real spread of just 0.04%. We analyze why this difference happens and which banks offer the best prices, with the premium over BCV as the backdrop.
P2P Spread USDT/VES: why the 4.2% is misleading and the real one is 0.04%
Live P2P Radar Capture: 28/8/2026, 1:30:16 p. m.
USDT/VES reference Bs. 941.71
Buy USDT Bs. 941.71
USDT Sale Bs. 903.46
BCV Bs. 791.67
Premium vs BCV 18.95%
P2P Spread 4.23%
Observed offers 262
Verify current data in Radar P2P
In the Venezuelan P2P market, not all prices are the same. While the P2P Radar shows an average spread of 4.23% between buying and selling USDT, the order book on Binance and other platforms reveals a real spread of just 0.04%. We analyze why this difference happens and which banks offer the best prices, with the premium over BCV as the backdrop.
USDT/VES reference Bs. 941.71
Buy USDT Bs. 941.71
USDT Sale Bs. 903.46
BCV Bs. 791.67
Premium vs BCV 18.95%
P2P Spread 4.23%
Observed offers 262
Verify current data in Radar P2P
In the Venezuelan P2P market, not all prices are the same. While the P2P Radar shows an average spread of 4.23% between buying and selling USDT, the order book on Binance and other platforms reveals a real spread of just 0.04%. We analyze why this difference happens and which banks offer the best prices, with the premium over BCV as the backdrop.
2
·
--
Article
P2P USDT/VES: yellow light, spread 4.36% and depth by bank Live P2P Radar capture: 28/8/2026, 4:00:18 p. m.
USDT/VES reference Bs. 942.16
Buy USDT Bs. 942.16
USDT sale Bs. 902.79
BCV Bs. 791.67
Premium vs BCV 19.01%
P2P spread 4.36%
Observed offers 79
Verify current data in P2P Radar
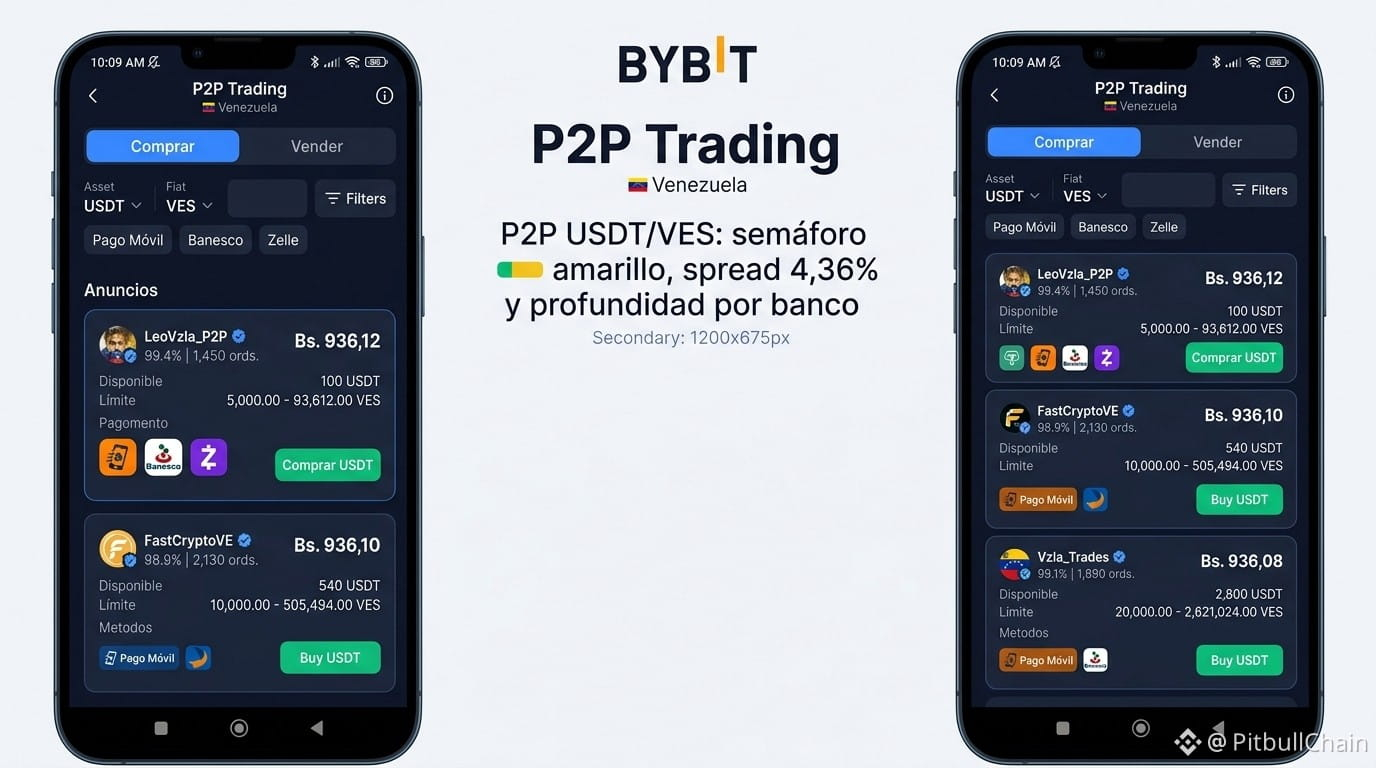
As of the close of August 28, 2026, the P2P USDT/VES market shows a yellow traffic light (score 69/100) and an aggregated spread of 4.36%. While liquidity is concentrated in Banesco and Pago Móvil, the order book shows an uneven distribution across the price levels 933-937. This analysis breaks down the verified data to understand what this means when executing large orders.
P2P USDT/VES: yellow light, spread 4.36% and depth by bank
Live P2P Radar capture: 28/8/2026, 4:00:18 p. m.
USDT/VES reference Bs. 942.16
Buy USDT Bs. 942.16
USDT sale Bs. 902.79
BCV Bs. 791.67
Premium vs BCV 19.01%
P2P spread 4.36%
Observed offers 79
Verify current data in P2P Radar
As of the close of August 28, 2026, the P2P USDT/VES market shows a yellow traffic light (score 69/100) and an aggregated spread of 4.36%. While liquidity is concentrated in Banesco and Pago Móvil, the order book shows an uneven distribution across the price levels 933-937. This analysis breaks down the verified data to understand what this means when executing large orders.
USDT/VES reference Bs. 942.16
Buy USDT Bs. 942.16
USDT sale Bs. 902.79
BCV Bs. 791.67
Premium vs BCV 19.01%
P2P spread 4.36%
Observed offers 79
Verify current data in P2P Radar
As of the close of August 28, 2026, the P2P USDT/VES market shows a yellow traffic light (score 69/100) and an aggregated spread of 4.36%. While liquidity is concentrated in Banesco and Pago Móvil, the order book shows an uneven distribution across the price levels 933-937. This analysis breaks down the verified data to understand what this means when executing large orders.
1
Log in to explore more content
Join global crypto users on Binance Square
⚡️ Get latest and useful information about crypto.
💬 Trusted by the world’s largest crypto exchange.
👍 Discover real insights from verified creators.
Email / Phone number
Trending Topics
1
#BOJRaisesRatesTo31YearHigh
49,146 views
962 Discussing
2
#BuffettStepsDownAsBerkshireChairman
19,902 views
429 Discussing
3
#XRPExchangeReservesHitSevenYearLow
24,989 views
423 Discussing
4
#HKCompletesFirstHKDStablecoinUseCase
57,869 views
938 Discussing
5
#VietnamPlansFirstCryptoLicensesIn2026
39,783 views
648 Discussing
6
#BTCBreaks80K
329,412 views
4,326 Discussing
7
#BitcoinMarketCapTopsTesla
61,329 views
956 Discussing
8
#SOLJumpsAbout10%
71,310 views
961 Discussing
9
#EthereumReclaims$2600
6,508 views
109 Discussing
10
#LineraShutsDownAfterFundraisingFallsShort
20,224 views
265 Discussing