

Trade with Bi Crypto
150 Posts

Trade with Bi Crypto
Report
Block User
5 Following
14 Followers
36 Liked
Posts

Article
USDC Liquidity Volatility: How Cautious Capital Flows Are Reshaping the Market#usdccirculationfallsabout800minsevendays
In the world of decentralized finance, if Bitcoin is a measure of long-term trends, then stablecoins are the market’s “lifeblood,” reflecting its purchasing power and the funds ready to be deployed. The fact that USDC’s circulating supply has fallen by around $800 million over the past seven days is more than just a technical figure—it is a clear signal that large investors are shifting their approach to risk management.
USDC Liquidity Volatility: How Cautious Capital Flows Are Reshaping the Market
#usdccirculationfallsabout800minsevendays
In the world of decentralized finance, if Bitcoin is a measure of long-term trends, then stablecoins are the market’s “lifeblood,” reflecting its purchasing power and the funds ready to be deployed. The fact that USDC’s circulating supply has fallen by around $800 million over the past seven days is more than just a technical figure—it is a clear signal that large investors are shifting their approach to risk management.
In the world of decentralized finance, if Bitcoin is a measure of long-term trends, then stablecoins are the market’s “lifeblood,” reflecting its purchasing power and the funds ready to be deployed. The fact that USDC’s circulating supply has fallen by around $800 million over the past seven days is more than just a technical figure—it is a clear signal that large investors are shifting their approach to risk management.
225

Article
#BackedNotBroken: When Resilience and Responsibility Define the Value of a Leader#backednotbroken:richardtengsaysusersbearnoloss
In the world of decentralized finance, the toughest test for an exchange isn't during bull markets, but in how it faces and handles crises when things go wrong. The #BackedNotBroken theme, along with CEO Richard Teng's emphatic declaration (“Users Bear No Loss”), is the clearest evidence of Binance's vast financial resources and its utmost commitment to its customers.
#BackedNotBroken: When Resilience and Responsibility Define the Value of a Leader
#backednotbroken:richardtengsaysusersbearnoloss
In the world of decentralized finance, the toughest test for an exchange isn't during bull markets, but in how it faces and handles crises when things go wrong. The #BackedNotBroken theme, along with CEO Richard Teng's emphatic declaration (“Users Bear No Loss”), is the clearest evidence of Binance's vast financial resources and its utmost commitment to its customers.
In the world of decentralized finance, the toughest test for an exchange isn't during bull markets, but in how it faces and handles crises when things go wrong. The #BackedNotBroken theme, along with CEO Richard Teng's emphatic declaration (“Users Bear No Loss”), is the clearest evidence of Binance's vast financial resources and its utmost commitment to its customers.
284

Article
A Comprehensive Look at Proof of Reserves: How Real-World Action Shapes Market Confidence#yihe:proofofreserves:10tokensat100%backing
In a cryptocurrency market highly sensitive to any security incident, making assets transparent is more than a technical announcement—it is a measure of a leading exchange’s integrity. Rather than staying silent or evading questions amid doubts, Binance’s leadership team, including co-founder Yi He and CEO Richard Teng, directly addressed the issue with concrete financial figures and technological solutions.
A Comprehensive Look at Proof of Reserves: How Real-World Action Shapes Market Confidence
#yihe:proofofreserves:10tokensat100%backing
In a cryptocurrency market highly sensitive to any security incident, making assets transparent is more than a technical announcement—it is a measure of a leading exchange’s integrity. Rather than staying silent or evading questions amid doubts, Binance’s leadership team, including co-founder Yi He and CEO Richard Teng, directly addressed the issue with concrete financial figures and technological solutions.
In a cryptocurrency market highly sensitive to any security incident, making assets transparent is more than a technical announcement—it is a measure of a leading exchange’s integrity. Rather than staying silent or evading questions amid doubts, Binance’s leadership team, including co-founder Yi He and CEO Richard Teng, directly addressed the issue with concrete financial figures and technological solutions.
423
Article
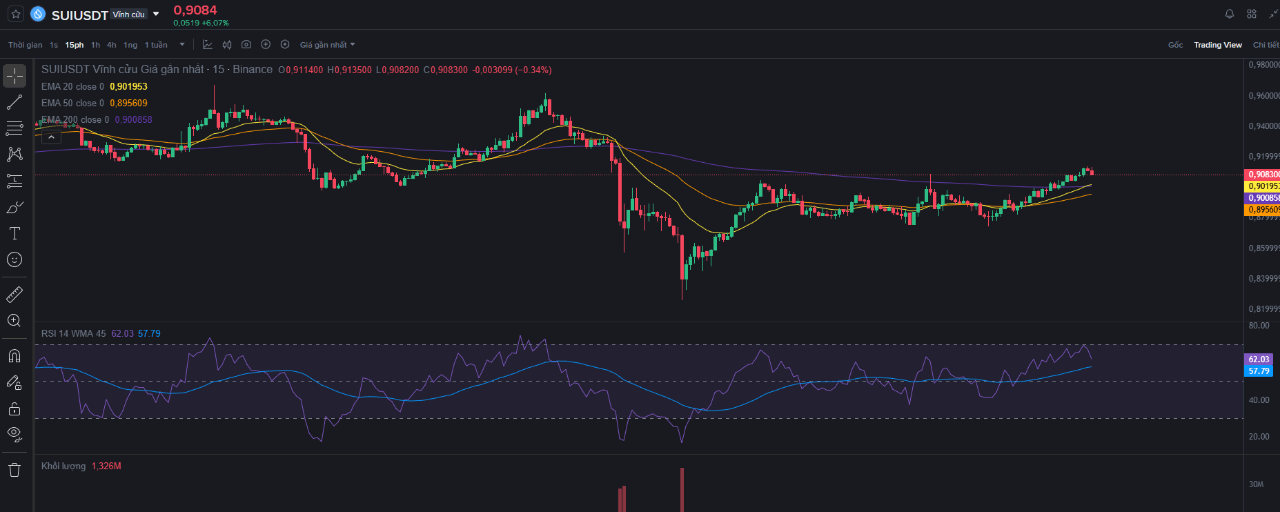
A Hands-On Look at SUIUSDT: When Are Conditions Right to Pull the Trigger on a SELL Trade?#SUI🔥
Hey traders! Over the past few days, I’ve seen tons of lively discussion on social media about where SUI is headed. Some are expecting a strong rally, while others are nervously bracing for a deep market crash.
But as hands-on traders, we don’t make wild guesses or trade based on crowd sentiment. Instead, let’s pull up the SUIUSDT chart and apply a rigorous top-down, multi-timeframe analysis to see what the big money is really up to!
A Hands-On Look at SUIUSDT: When Are Conditions Right to Pull the Trigger on a SELL Trade?
#SUI🔥
Hey traders! Over the past few days, I’ve seen tons of lively discussion on social media about where SUI is headed. Some are expecting a strong rally, while others are nervously bracing for a deep market crash.
But as hands-on traders, we don’t make wild guesses or trade based on crowd sentiment. Instead, let’s pull up the SUIUSDT chart and apply a rigorous top-down, multi-timeframe analysis to see what the big money is really up to!
301
Article
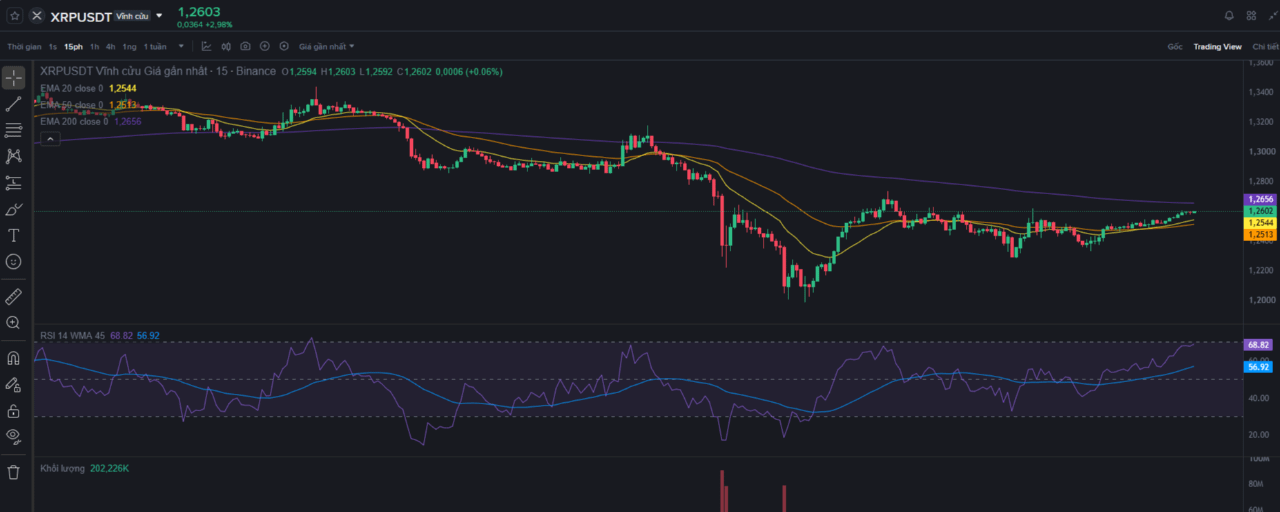
XRPUSDT: Decoding the Multi-Timeframe Structure & Strategy for Catching the Corrective Wave#Xrp🔥🔥
How’s everyone doing today? Have you hit the stop loss on any XRP trades yet? Over the past few days, I’ve received quite a few messages asking: “Has XRP started reversing upward yet, or will it keep falling?”
Actually, the answer isn't based on my guess or anyone else's—it’s right there on the price chart. Come on, open the XRPUSDT chart with me! Today, I’ll share my multi-timeframe perspective, from the Daily down to M15, to see where the truly safe entry point is.
XRPUSDT: Decoding the Multi-Timeframe Structure & Strategy for Catching the Corrective Wave
#Xrp🔥🔥
How’s everyone doing today? Have you hit the stop loss on any XRP trades yet? Over the past few days, I’ve received quite a few messages asking: “Has XRP started reversing upward yet, or will it keep falling?”
Actually, the answer isn't based on my guess or anyone else's—it’s right there on the price chart. Come on, open the XRPUSDT chart with me! Today, I’ll share my multi-timeframe perspective, from the Daily down to M15, to see where the truly safe entry point is.
123
Article
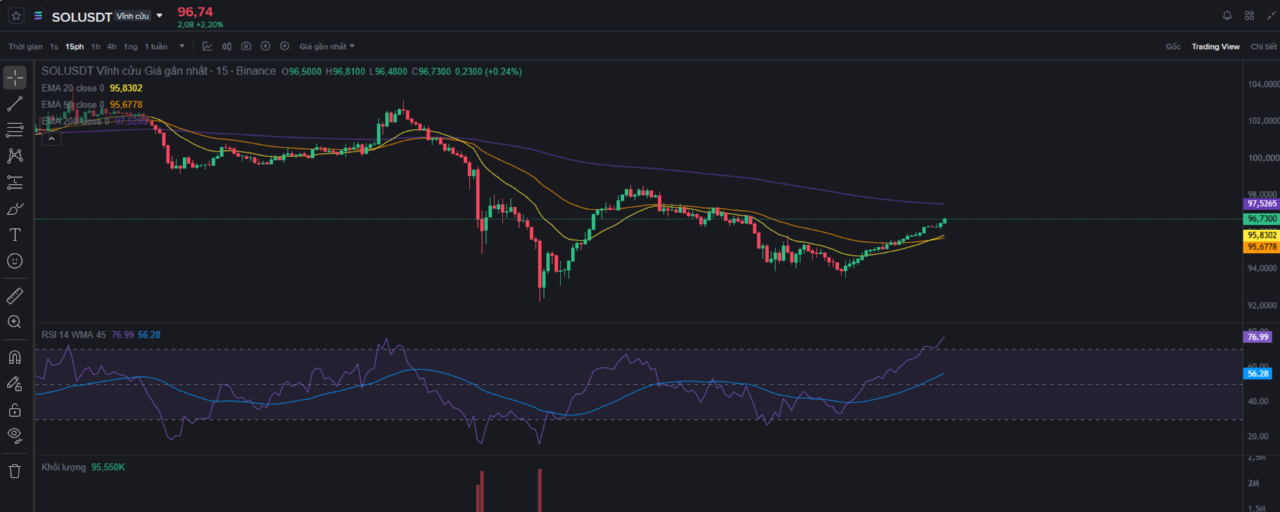
SOLUSDT: Key Resistance Zones & A Plan to Catch the Rebound or Anticipate a Trend Reversal#solana #TechnicalAnalysis
Trading is not about predicting the future, but managing probabilities within each value area. For SOLUSDT at the moment, FOMO-driven price chasing is a definite no-go. Instead, a disciplined trading plan—from identifying the direction on the daily chart, finding zones on H4, and looking for setups on H1, to pulling the trigger on M15—will help us isolate risk and optimize the risk-to-reward ratio. Below is a detailed roadmap for today’s trading session.
SOLUSDT: Key Resistance Zones & A Plan to Catch the Rebound or Anticipate a Trend Reversal
#solana #TechnicalAnalysis
Trading is not about predicting the future, but managing probabilities within each value area. For SOLUSDT at the moment, FOMO-driven price chasing is a definite no-go. Instead, a disciplined trading plan—from identifying the direction on the daily chart, finding zones on H4, and looking for setups on H1, to pulling the trigger on M15—will help us isolate risk and optimize the risk-to-reward ratio. Below is a detailed roadmap for today’s trading session.
Trading is not about predicting the future, but managing probabilities within each value area. For SOLUSDT at the moment, FOMO-driven price chasing is a definite no-go. Instead, a disciplined trading plan—from identifying the direction on the daily chart, finding zones on H4, and looking for setups on H1, to pulling the trigger on M15—will help us isolate risk and optimize the risk-to-reward ratio. Below is a detailed roadmap for today’s trading session.
160
Article
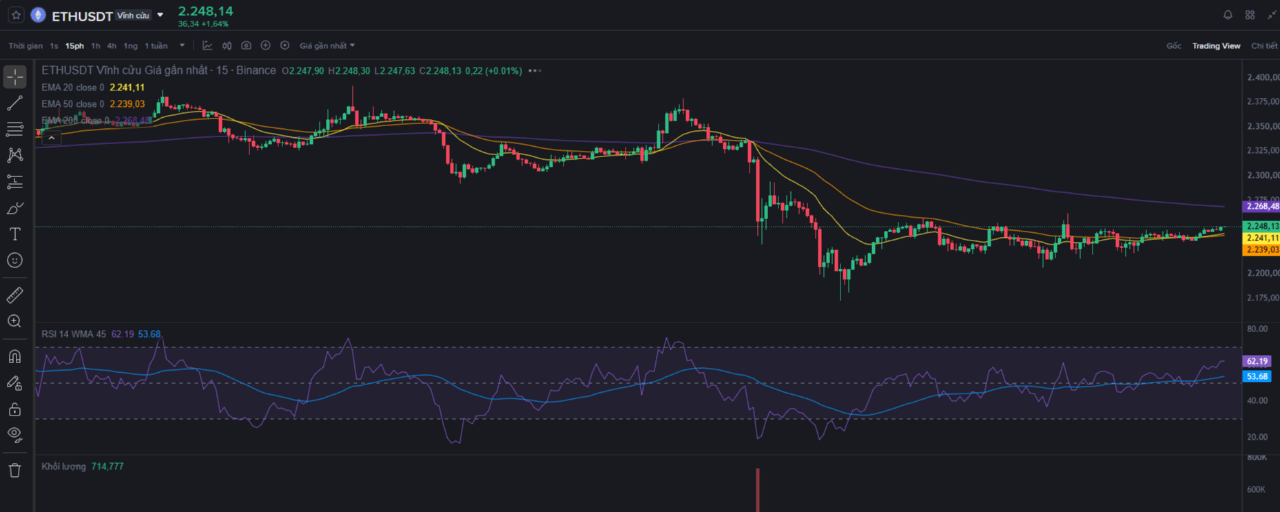
A Process-Driven ETH/USDT Trading Strategy: Patiently Wait for the Price Zone — Act Decisively at Entry#Ethereum
Selling pressure in the crypto market is no joke. ETH/USDT breaking below key central levels and approaching a sensitive price zone calls for an exceptionally clear-headed technical perspective. Rather than guessing the highs and lows, let’s allow the money flow and chart structure to speak through the multi-timeframe, trend-aligned trading strategy below.
1. Daily Timeframe (D) — Determine the Overall Direction and Price Position
A Process-Driven ETH/USDT Trading Strategy: Patiently Wait for the Price Zone — Act Decisively at Entry
#Ethereum
Selling pressure in the crypto market is no joke. ETH/USDT breaking below key central levels and approaching a sensitive price zone calls for an exceptionally clear-headed technical perspective. Rather than guessing the highs and lows, let’s allow the money flow and chart structure to speak through the multi-timeframe, trend-aligned trading strategy below.
1. Daily Timeframe (D) — Determine the Overall Direction and Price Position
160
Article
Patience Is the Only Advantage: A BTC/USDT Trading Scenario as the Market Approaches a Decisive Zone#bitcoin
The cryptocurrency market demands unwavering discipline and a logical approach that completely eliminates personal emotions. This article analyzes the market structure of the BTC/USDT pair using a multi-timeframe process, then develops a detailed trading plan and optimizes risk management.
1. Daily (D) Timeframe — Determining the Major Trend and Price Position
Trend and structure: The Daily timeframe is currently transitioning into a wide-ranging sideways phase and facing short-term corrective pressure following the preceding growth phase.
Patience Is the Only Advantage: A BTC/USDT Trading Scenario as the Market Approaches a Decisive Zone
#bitcoin
The cryptocurrency market demands unwavering discipline and a logical approach that completely eliminates personal emotions. This article analyzes the market structure of the BTC/USDT pair using a multi-timeframe process, then develops a detailed trading plan and optimizes risk management.
1. Daily (D) Timeframe — Determining the Major Trend and Price Position
Trend and structure: The Daily timeframe is currently transitioning into a wide-ranging sideways phase and facing short-term corrective pressure following the preceding growth phase.
160
Verified

Article
Binance Lists $PREDICT: A New Pillar for the BNB Chain Ecosystem or a Risky Gamble?#binancewilllistpredictpredict
The news that Binance has announced the listing of Predict (PREDICT) — a prominent decentralized prediction market protocol on BNB Chain — is becoming the hottest topic of discussion on Binance Square.
Amid the community’s immense expectations, the question for savvy investors is not simply, “Will $PREDICT pump at launch?” but rather, “Does this project’s valuation model and tokenomics design point to a genuine opportunity or a real risk?”
Binance Lists $PREDICT: A New Pillar for the BNB Chain Ecosystem or a Risky Gamble?
#binancewilllistpredictpredict
The news that Binance has announced the listing of Predict (PREDICT) — a prominent decentralized prediction market protocol on BNB Chain — is becoming the hottest topic of discussion on Binance Square.
Amid the community’s immense expectations, the question for savvy investors is not simply, “Will $PREDICT pump at launch?” but rather, “Does this project’s valuation model and tokenomics design point to a genuine opportunity or a real risk?”
1
791

Article
The Balance of Power in the U.S. Midterm Elections: Supply-Demand Dynamics and a Pivotal Moment for Global Financial Markets#usmidtermelections
As U.S. politics enters the decisive phase of the midterm elections, capital flows in global financial markets are also anxiously tracking every development. This is not simply a race for seats on Capitol Hill, but a watershed event that will determine whether U.S. economic policies continue to accelerate or hit the brakes in the face of opposition.
The Balance of Power in the U.S. Midterm Elections: Supply-Demand Dynamics and a Pivotal Moment for Global Financial Markets
#usmidtermelections
As U.S. politics enters the decisive phase of the midterm elections, capital flows in global financial markets are also anxiously tracking every development. This is not simply a race for seats on Capitol Hill, but a watershed event that will determine whether U.S. economic policies continue to accelerate or hit the brakes in the face of opposition.
As U.S. politics enters the decisive phase of the midterm elections, capital flows in global financial markets are also anxiously tracking every development. This is not simply a race for seats on Capitol Hill, but a watershed event that will determine whether U.S. economic policies continue to accelerate or hit the brakes in the face of opposition.
115
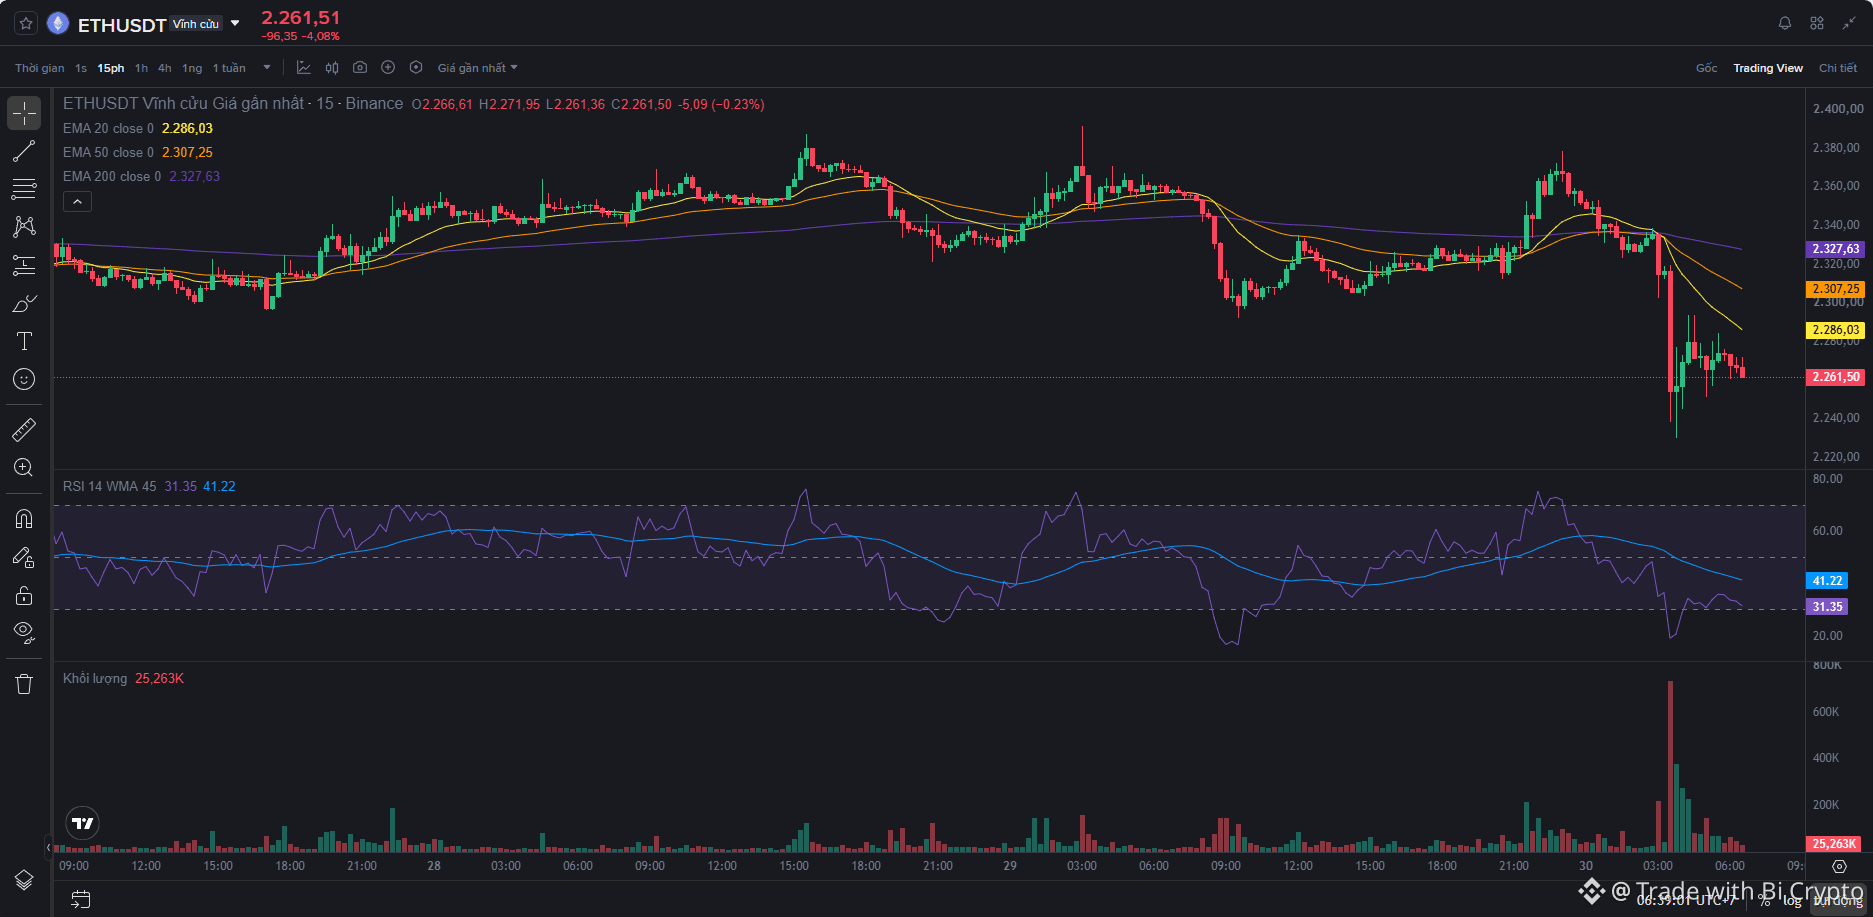
📊 ETH/USDT: Retesting the Lower Boundary of Higher-Timeframe Support – Opportunity or Risk?
#Ethereum
The market just saw a sharp crash, pushing ETH back near $2,262 as selling volume surged. Instead of panicking, let’s break down the multi-timeframe structure to find a safe point of action.
🔍 Technical Analysis
Higher Timeframes (Daily / H4):
Daily: In a medium-term pullback phase, with price currently testing a strong support area that coincides with the Daily 200 EMA (around $2,325).
H4: The short-term bearish structure has brought price close to the potential demand zone at $2,200–$2,250. Watch this area for a price reaction.
Lower Timeframes (H1 / M15):
Status: Following the sharp dump, the lower timeframes are moving sideways in consolidation. No reversal structure has appeared yet (no Higher Low or bullish BOS). Do not try to catch a falling knife before confirmation.
🛡️ Trading Plan & Risk Management
Long Setup:
Condition: The $2,200–$2,250 support zone holds, and an H1 candle shows a long lower wick.
Confirmation (M15): Wait for a Higher Low to form and for price to break the short-term high, supported by volume.
Entry: Around the M15 confirmation zone | SL: Below $2,150 | TP: Toward $2,350–$2,400 (minimum R:R of 1:2).
Capital management: Risk no more than 1–2% of your account. Without M15 confirmation, stay out of the market.
#TechnicalAnalysis #BinanceSquare
{future}(BTCUSDT)
{future}(ETHUSDT)
📊 ETH/USDT: Retesting the Lower Boundary of Higher-Timeframe Support – Opportunity or Risk?
#Ethereum
The market just saw a sharp crash, pushing ETH back near $2,262 as selling volume surged. Instead of panicking, let’s break down the multi-timeframe structure to find a safe point of action.
🔍 Technical Analysis
Higher Timeframes (Daily / H4):
Daily: In a medium-term pullback phase, with price currently testing a strong support area that coincides with the Daily 200 EMA (around $2,325).
H4: The short-term bearish structure has brought price close to the potential demand zone at $2,200–$2,250. Watch this area for a price reaction.
Lower Timeframes (H1 / M15):
Status: Following the sharp dump, the lower timeframes are moving sideways in consolidation. No reversal structure has appeared yet (no Higher Low or bullish BOS). Do not try to catch a falling knife before confirmation.
🛡️ Trading Plan & Risk Management
Long Setup:
Condition: The $2,200–$2,250 support zone holds, and an H1 candle shows a long lower wick.
Confirmation (M15): Wait for a Higher Low to form and for price to break the short-term high, supported by volume.
Entry: Around the M15 confirmation zone | SL: Below $2,150 | TP: Toward $2,350–$2,400 (minimum R:R of 1:2).
Capital management: Risk no more than 1–2% of your account. Without M15 confirmation, stay out of the market.
#TechnicalAnalysis #BinanceSquare
494
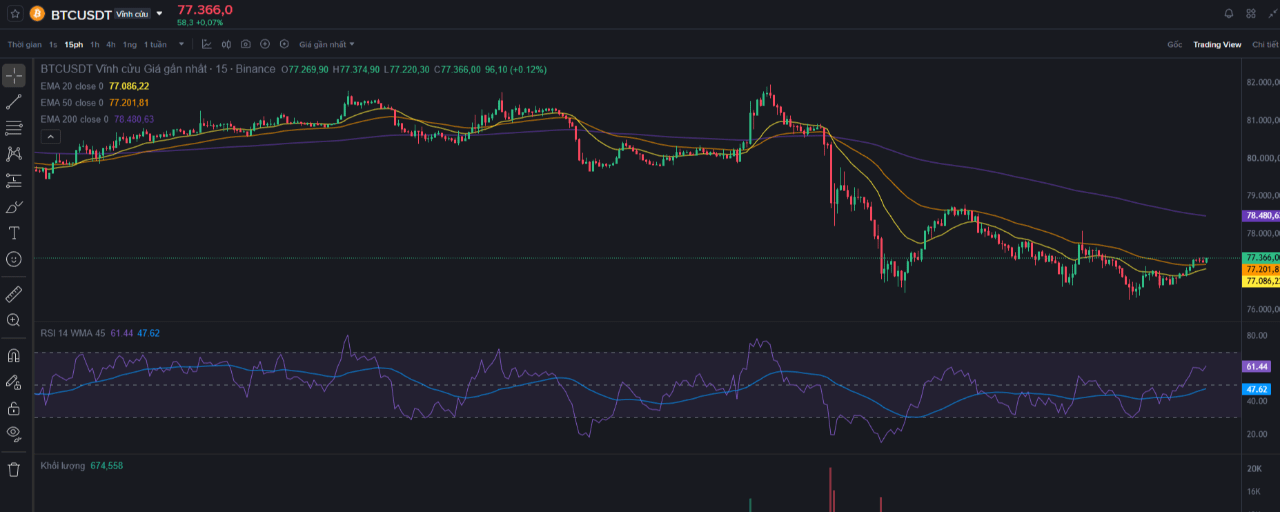
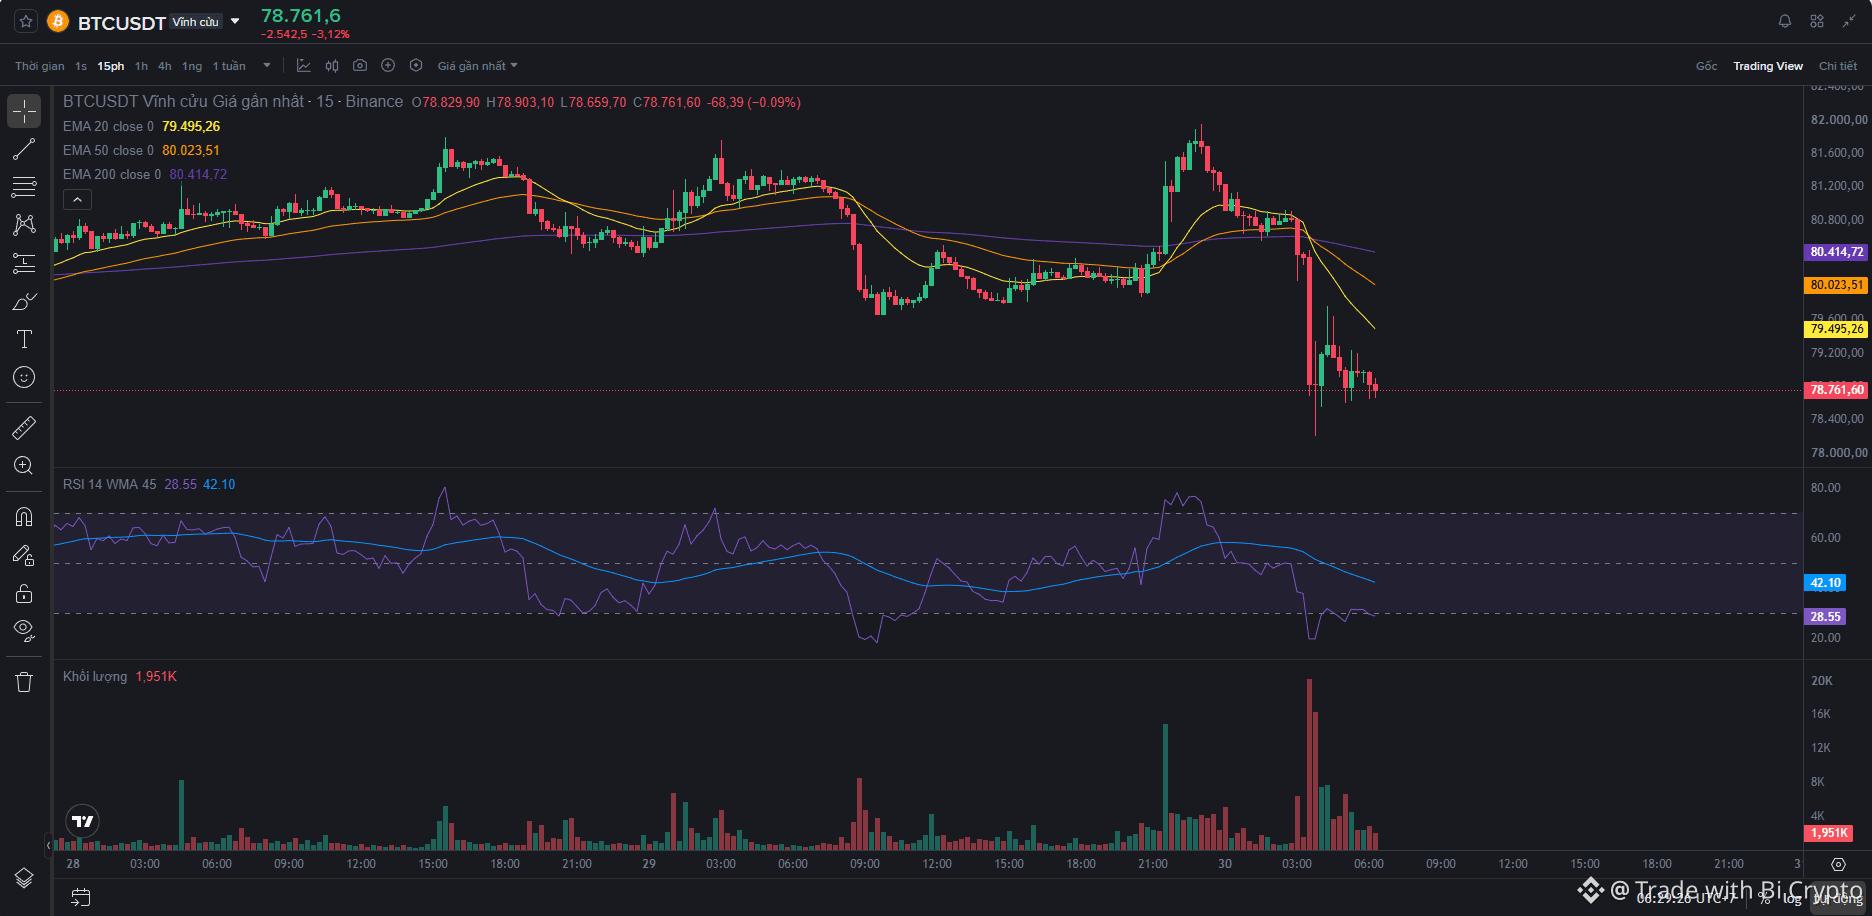
📊 BTC/USDT: A Critical Test of the Key Support Zone – Catch a Rebound or Wait for Confirmation?
#bitcoin
The market just saw a sharp shakeout, pushing Bitcoin (BTC) back toward $78,730 and triggering short-term liquidity pressure. Instead of panic-buying the dip, let’s break down the multi-timeframe market structure to identify a safer point of action.
🔍 Technical Thesis & Solid Evidence
Higher Timeframes (Daily / H4):
Trend & Price Zone: The Daily chart is in a medium-term pullback, but price is currently holding directly above a strong support zone that converges with the Daily 200 EMA (around $76,690).
Structure: H4 has reached a potential demand zone at $76,500–$78,000, where large flows often react and create an accumulation zone.
Lower Timeframes (H1 / M15):
Current State: After the sharp dump, lower timeframes are moving sideways, with no reversal signals yet (no Higher Low structure or bullish BOS). Therefore, chasing a buy at this point is very risky.
🛡️ Action Plan & Risk Management
Patience is the key to survival. My personal trading plan follows the principle: “Wait for confirmation before committing funds.”
Long Setup:
Condition: Wait for price to react and form a reversal pattern (long lower wick/Engulfing) in the $76,800–$78,000 zone, with M15 structure confirmation.
Expected Entry: Around the confirmation zone or when there is a signal of an upward turn.
Stop Loss (SL): Place it firmly below the nearest structural low (below $76,400).
Take Profit (TP): Target H1/H4 EMA resistance around $80,500–$81,800 (minimum R:R of 1:2).
Position sizing: Strictly limit risk to a maximum of 1–2% of the account per trade.
{future}(BTCUSDT)
📊 BTC/USDT: A Critical Test of the Key Support Zone – Catch a Rebound or Wait for Confirmation?
#bitcoin
The market just saw a sharp shakeout, pushing Bitcoin (BTC) back toward $78,730 and triggering short-term liquidity pressure. Instead of panic-buying the dip, let’s break down the multi-timeframe market structure to identify a safer point of action.
🔍 Technical Thesis & Solid Evidence
Higher Timeframes (Daily / H4):
Trend & Price Zone: The Daily chart is in a medium-term pullback, but price is currently holding directly above a strong support zone that converges with the Daily 200 EMA (around $76,690).
Structure: H4 has reached a potential demand zone at $76,500–$78,000, where large flows often react and create an accumulation zone.
Lower Timeframes (H1 / M15):
Current State: After the sharp dump, lower timeframes are moving sideways, with no reversal signals yet (no Higher Low structure or bullish BOS). Therefore, chasing a buy at this point is very risky.
🛡️ Action Plan & Risk Management
Patience is the key to survival. My personal trading plan follows the principle: “Wait for confirmation before committing funds.”
Long Setup:
Condition: Wait for price to react and form a reversal pattern (long lower wick/Engulfing) in the $76,800–$78,000 zone, with M15 structure confirmation.
Expected Entry: Around the confirmation zone or when there is a signal of an upward turn.
Stop Loss (SL): Place it firmly below the nearest structural low (below $76,400).
Take Profit (TP): Target H1/H4 EMA resistance around $80,500–$81,800 (minimum R:R of 1:2).
Position sizing: Strictly limit risk to a maximum of 1–2% of the account per trade.
470

Article
The Wave of Infrastructure Upgrades & Bitcoin’s Enduring Vitality: A Technical Perspective for Long-Term Investors#bitcoincore32.1raisespeerconnectionlimit
In the world of decentralized finance, prices reflect short-term sentiment, but technology and infrastructure are what determine an asset’s survival. As institutional capital increasingly demands greater security and stability, quiet improvements at the base protocol layer—such as the Bitcoin Core 32.1 upgrade, which expands the peer connection limit to 200—mark a milestone affirming the network’s longevity and capacity for self-improvement.
The Wave of Infrastructure Upgrades & Bitcoin’s Enduring Vitality: A Technical Perspective for Long-Term Investors
#bitcoincore32.1raisespeerconnectionlimit
In the world of decentralized finance, prices reflect short-term sentiment, but technology and infrastructure are what determine an asset’s survival. As institutional capital increasingly demands greater security and stability, quiet improvements at the base protocol layer—such as the Bitcoin Core 32.1 upgrade, which expands the peer connection limit to 200—mark a milestone affirming the network’s longevity and capacity for self-improvement.
In the world of decentralized finance, prices reflect short-term sentiment, but technology and infrastructure are what determine an asset’s survival. As institutional capital increasingly demands greater security and stability, quiet improvements at the base protocol layer—such as the Bitcoin Core 32.1 upgrade, which expands the peer connection limit to 200—mark a milestone affirming the network’s longevity and capacity for self-improvement.
146

Article
The Fed’s Interest Rate Wall & Bitcoin’s Liquidity Challenge in Q4 2026#fedwatch
As cheap money gradually retreats from global markets, cryptocurrencies are no longer an “isolated oasis” beyond the reach of macroeconomic forces. The U.S. Federal Reserve’s (Fed) recent decision to keep interest rates elevated at 3.75%–4.00% is more than just a reported figure—it signals that the pressure of quantitative tightening will continue to weigh on investors through the final stretch of the year.
The Fed’s Interest Rate Wall & Bitcoin’s Liquidity Challenge in Q4 2026
#fedwatch
As cheap money gradually retreats from global markets, cryptocurrencies are no longer an “isolated oasis” beyond the reach of macroeconomic forces. The U.S. Federal Reserve’s (Fed) recent decision to keep interest rates elevated at 3.75%–4.00% is more than just a reported figure—it signals that the pressure of quantitative tightening will continue to weigh on investors through the final stretch of the year.
As cheap money gradually retreats from global markets, cryptocurrencies are no longer an “isolated oasis” beyond the reach of macroeconomic forces. The U.S. Federal Reserve’s (Fed) recent decision to keep interest rates elevated at 3.75%–4.00% is more than just a reported figure—it signals that the pressure of quantitative tightening will continue to weigh on investors through the final stretch of the year.
389
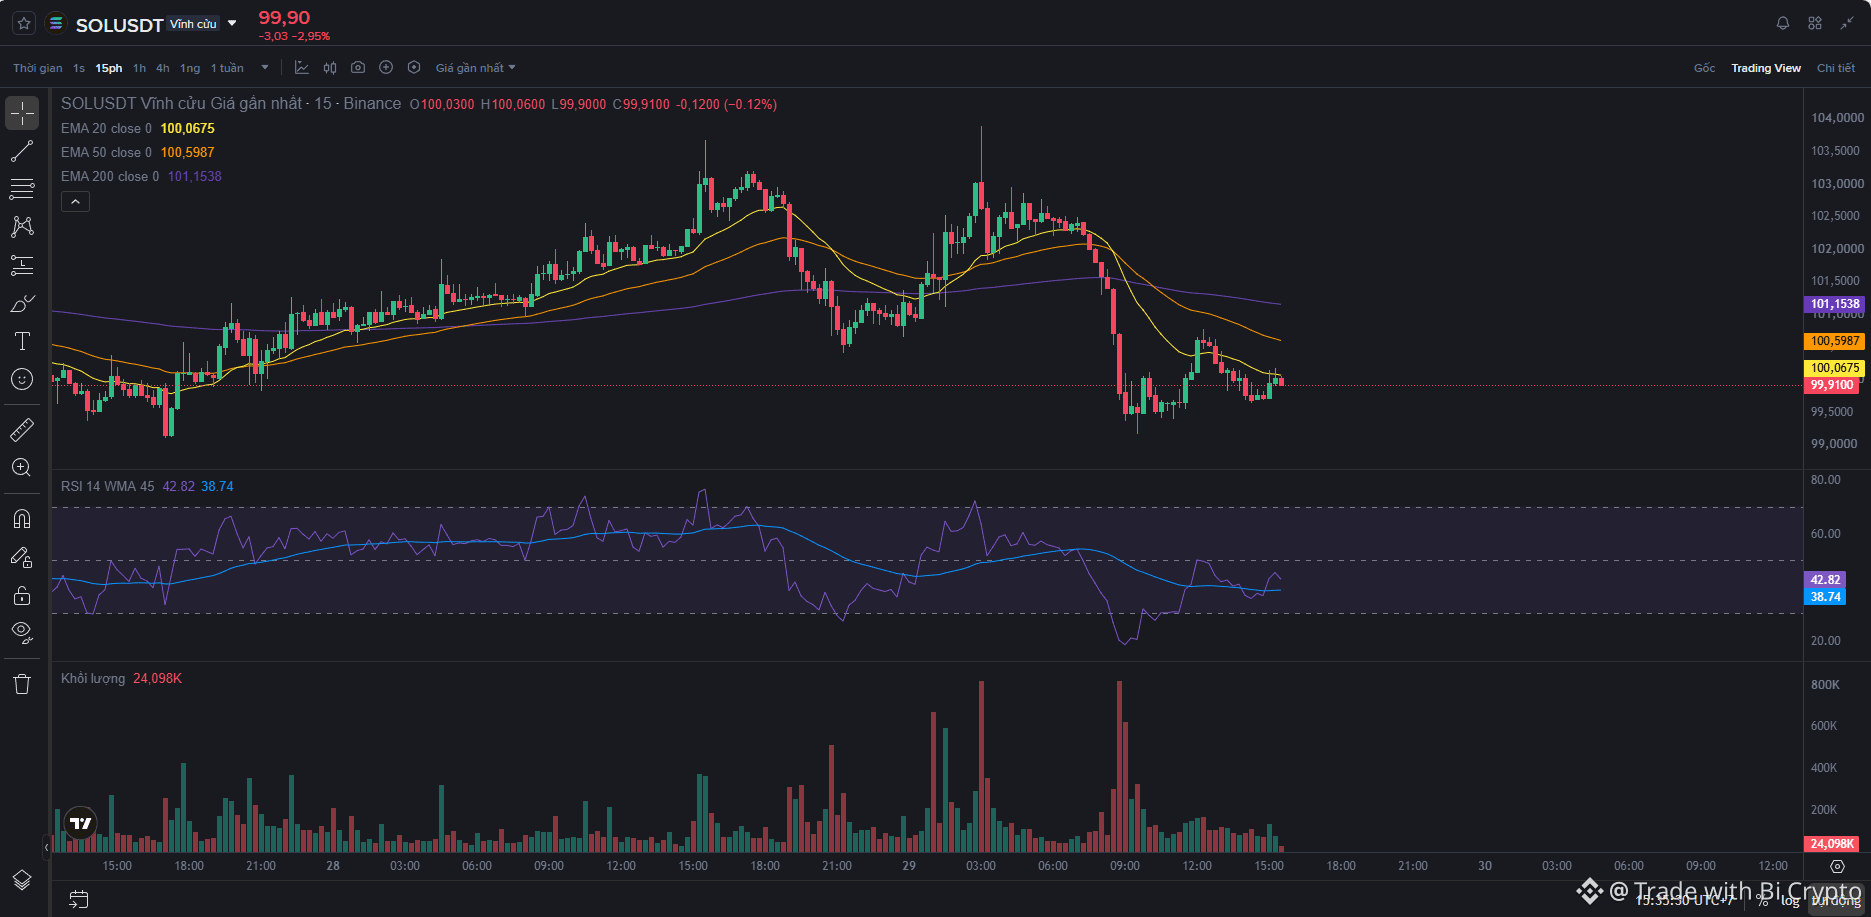
SOL/USDT Technical Analysis: Trading Opportunity at a Key Support Zone
The cryptocurrency market demands discipline, not emotional trading. For the SOL/USDT pair, price action is now approaching important structural zones, making a multi-timeframe perspective essential for optimizing the risk-to-reward ratio (R:R).
1. Technical Thesis & Evidence
Daily (D) & H4 Timeframes (Bias & Price Zones): On the Daily timeframe, $SOL is consolidating around $99.93, near the 200 EMA (~$98.63). The H4 timeframe shows a short-term downtrend with lower highs, identifying a potential resistance (Supply Zone) around the confluence zone of $101.5–$102.5.
H1 & M15 Timeframes (Confirmation & Execution): Price is attempting a modest recovery and testing the EMA cluster on the H1 timeframe. Be patient and wait for price to retest the $101.0–$101.5 area, then look for rejection signals or a reversal structure on M15 before entering a trade.
2. Risk Management & Trading Plan
Entry Zone: Look to sell if price tests the $101.00–$101.30 area and a confirmation signal appears on a lower timeframe.
Stop Loss: Set at $102.30 (above the resistance zone and the M15 200 EMA).
Take Profit: Target the Daily support zone around $98.50–$99.00 (ensuring a minimum R:R of 1:2). Always manage your capital carefully to protect your account.
What’s your take on SOL’s current recovery? Will the $98–$99 support zone hold, or will sellers continue to dominate? Share your thoughts in the comments below!
Please Like and Share this post to support me, and Follow the channel for ongoing updates on real-time trade setups!
{future}(SOLUSDT)
SOL/USDT Technical Analysis: Trading Opportunity at a Key Support Zone
The cryptocurrency market demands discipline, not emotional trading. For the SOL/USDT pair, price action is now approaching important structural zones, making a multi-timeframe perspective essential for optimizing the risk-to-reward ratio (R:R).
1. Technical Thesis & Evidence
Daily (D) & H4 Timeframes (Bias & Price Zones): On the Daily timeframe, $SOL is consolidating around $99.93, near the 200 EMA (~$98.63). The H4 timeframe shows a short-term downtrend with lower highs, identifying a potential resistance (Supply Zone) around the confluence zone of $101.5–$102.5.
H1 & M15 Timeframes (Confirmation & Execution): Price is attempting a modest recovery and testing the EMA cluster on the H1 timeframe. Be patient and wait for price to retest the $101.0–$101.5 area, then look for rejection signals or a reversal structure on M15 before entering a trade.
2. Risk Management & Trading Plan
Entry Zone: Look to sell if price tests the $101.00–$101.30 area and a confirmation signal appears on a lower timeframe.
Stop Loss: Set at $102.30 (above the resistance zone and the M15 200 EMA).
Take Profit: Target the Daily support zone around $98.50–$99.00 (ensuring a minimum R:R of 1:2). Always manage your capital carefully to protect your account.
What’s your take on SOL’s current recovery? Will the $98–$99 support zone hold, or will sellers continue to dominate? Share your thoughts in the comments below!
Please Like and Share this post to support me, and Follow the channel for ongoing updates on real-time trade setups!
102
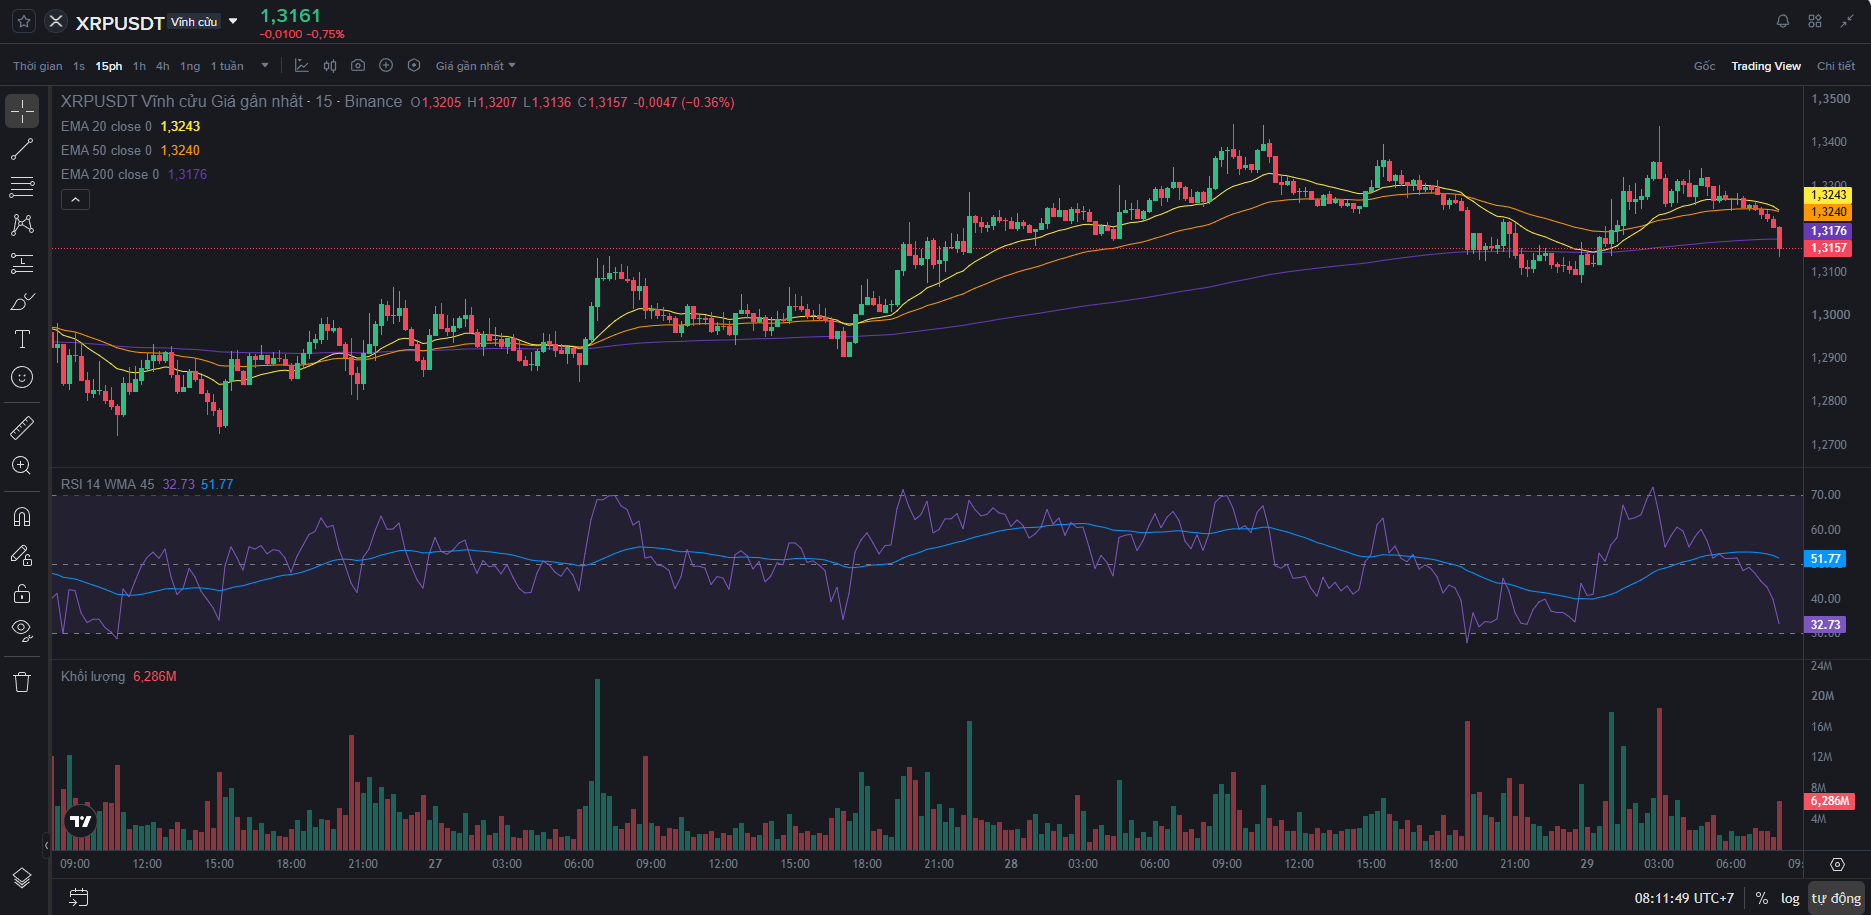
📊 XRP/USDT: Range Compression Right Against Support — Waiting for a Breakout or a Liquidity Trap?
Higher timeframes (D/H4) — Strategic range:
Daily: $XRP is trading around $1.3168 USD, below the key EMA cluster (EMA 20, 50, and 200, ranging from $1.3388 to $1.3777). Market structure remains in a sideways accumulation phase, holding close to the previous low’s support zone.
H4: Price is being capped by strong resistance at the H4 EMA 200, around $1.3562. The potential supply zone lies at $1.3500–$1.3650 USD, with a demand zone below at $1.2600–$1.2800 USD.
Lower timeframes (H1/M15) — Choppy signals and a wait-and-see approach:
H1 & M15: The short-term chart is compressing within a narrow range. RSI is hovering in neutral territory, and trading volume has yet to spike. Price is currently in no-man’s-land, with no confirmation of significant capital flows.
🎯 Action plan & personal risk management
Point of interest (POI): Patiently wait for price to reach the strategic range boundaries instead of trading in the current middle ground.
Short scenario: Wait for price to rebound to $1.3500–$1.3600 USD and show a rejection candle. Hard stop-loss above $1.3750 USD.
Long scenario: Wait for price to sweep down into the $1.2600–$1.2800 USD support zone and show signs of buying strength. Stop-loss below $1.2450 USD.
Principle: Maintain a 1:2 R:R ratio and manage position sizing carefully.
Note: This post shares a personal trading journal and is not financial investment advice. Risk management always comes first.
💬 Discussion: What do you think XRP will do—break out of this consolidation range and move up to test the strong resistance above, or make a deeper sweep down into the support zone? Share your thoughts below!
{future}(XRPUSDT)
📊 XRP/USDT: Range Compression Right Against Support — Waiting for a Breakout or a Liquidity Trap?
Higher timeframes (D/H4) — Strategic range:
Daily: $XRP is trading around $1.3168 USD, below the key EMA cluster (EMA 20, 50, and 200, ranging from $1.3388 to $1.3777). Market structure remains in a sideways accumulation phase, holding close to the previous low’s support zone.
H4: Price is being capped by strong resistance at the H4 EMA 200, around $1.3562. The potential supply zone lies at $1.3500–$1.3650 USD, with a demand zone below at $1.2600–$1.2800 USD.
Lower timeframes (H1/M15) — Choppy signals and a wait-and-see approach:
H1 & M15: The short-term chart is compressing within a narrow range. RSI is hovering in neutral territory, and trading volume has yet to spike. Price is currently in no-man’s-land, with no confirmation of significant capital flows.
🎯 Action plan & personal risk management
Point of interest (POI): Patiently wait for price to reach the strategic range boundaries instead of trading in the current middle ground.
Short scenario: Wait for price to rebound to $1.3500–$1.3600 USD and show a rejection candle. Hard stop-loss above $1.3750 USD.
Long scenario: Wait for price to sweep down into the $1.2600–$1.2800 USD support zone and show signs of buying strength. Stop-loss below $1.2450 USD.
Principle: Maintain a 1:2 R:R ratio and manage position sizing carefully.
Note: This post shares a personal trading journal and is not financial investment advice. Risk management always comes first.
💬 Discussion: What do you think XRP will do—break out of this consolidation range and move up to test the strong resistance above, or make a deeper sweep down into the support zone? Share your thoughts below!
301
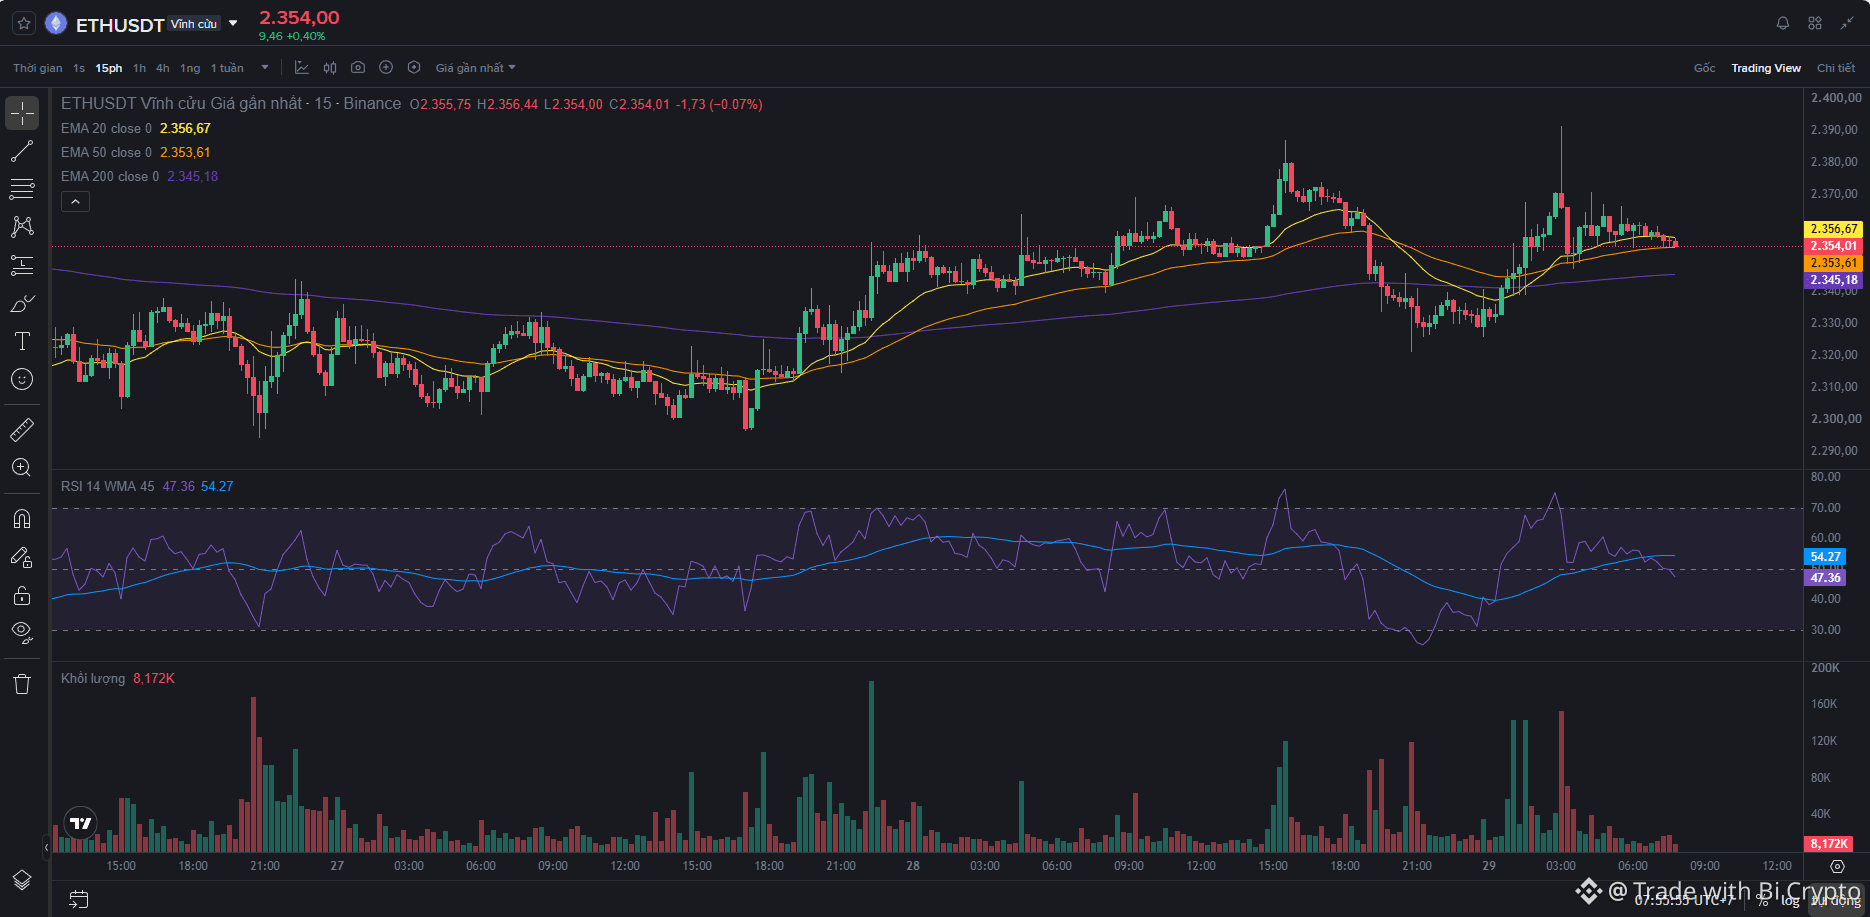
⚡ ETH/USDT: Testing the Daily 200 EMA — Opportunity or Trap?
Structure & Price Zone: The Daily timeframe is testing near the 200 EMA (around $2,326 USD), while H4 and H1 are consolidating in a tug-of-war around the $2,320–$2,350 USD demand zone.
Trading Plan: Prioritize looking for a Long when M15 shows signs of buying pressure (a candle with a long lower wick or a break of the short-term bearish structure); take-profit targets are around $2,420–$2,480 USD.
Risk Management: Set the stop loss (SL) firmly below $2,310 USD—if this level breaks, the structure is invalidated, so accept the loss and stay out.
This is a personal trading-journal perspective and absolutely not financial investment advice.
Are you leaning Long or Short on this move? Share your thoughts below!
#Ethereum
123
Article
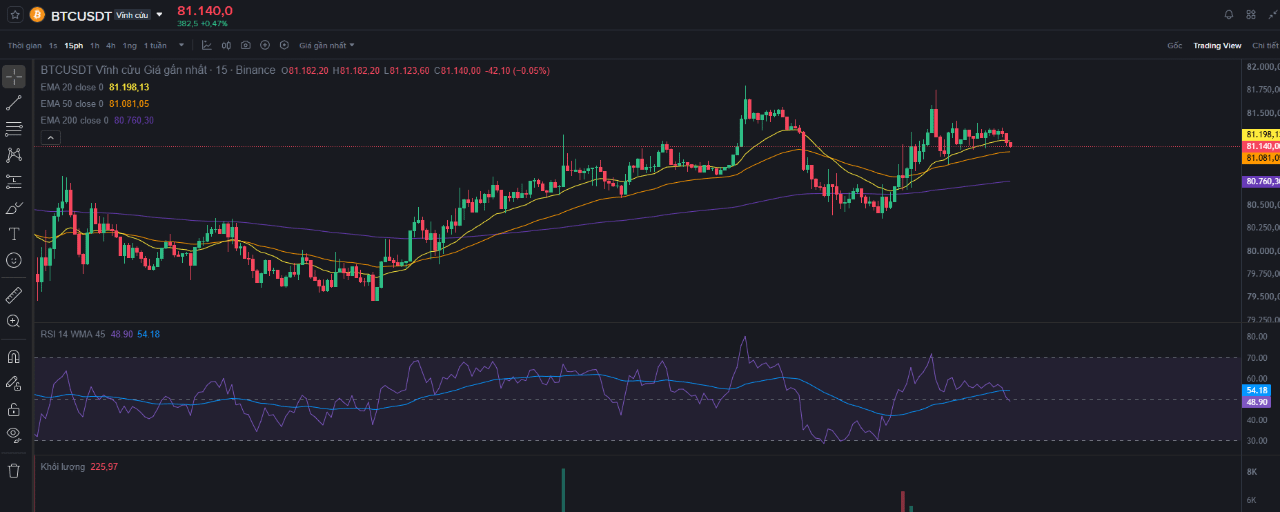
BTC/USDT Technical Outlook: Patiently Wait for the Golden Price Zone or Rush to Chase the Market?#bitcoin
Hello, Binance Square community!
As an individual trader, what I value most in this market has never been a winning trade, but the discipline to wait for the right structural entry point. Today, I’d like to share my perspective and trading plan for the BTC/USDT pair, based on my familiar multi-timeframe analysis approach.
1. Entry thesis & trading scenario
Trend / Scenario: Look for a long on a pullback when the price retests a strong support zone. Absolutely do not FOMO and chase the price in no-man’s-land.
BTC/USDT Technical Outlook: Patiently Wait for the Golden Price Zone or Rush to Chase the Market?
#bitcoin
Hello, Binance Square community!
As an individual trader, what I value most in this market has never been a winning trade, but the discipline to wait for the right structural entry point. Today, I’d like to share my perspective and trading plan for the BTC/USDT pair, based on my familiar multi-timeframe analysis approach.
1. Entry thesis & trading scenario
Trend / Scenario: Look for a long on a pullback when the price retests a strong support zone. Absolutely do not FOMO and chase the price in no-man’s-land.
236

Article
GOOGLE’S CHALLENGE: PROTECTING ITS SEARCH “EMPIRE” AND THE QUEST FOR AI PROFITS#cangoogledefinditscore
Just after Microsoft’s AI spending picture sent shockwaves through the market, Wall Street has turned its attention to the next hot spot: Google (Alphabet). In today’s business landscape, the balance between protecting its core business and accepting short-term financial volatility is a make-or-break test for the tech giant.
Here is a detailed analysis of Google’s challenges and opportunities in the AI era.
GOOGLE’S CHALLENGE: PROTECTING ITS SEARCH “EMPIRE” AND THE QUEST FOR AI PROFITS
#cangoogledefinditscore
Just after Microsoft’s AI spending picture sent shockwaves through the market, Wall Street has turned its attention to the next hot spot: Google (Alphabet). In today’s business landscape, the balance between protecting its core business and accepting short-term financial volatility is a make-or-break test for the tech giant.
Here is a detailed analysis of Google’s challenges and opportunities in the AI era.
2
12.7k
Verified

Article
EARNINGS SEASON & MICROSOFT’S AI SPENDING CONUNDRUM#canmicrosoftdeliveronai
Wall Street and the global investment community are caught in an unprecedented tug-of-war: on one hand, they marvel at record revenues; on the other, they are deeply uneasy about the staggering rate at which money is being "burned" on artificial intelligence. Microsoft’s (MSFT) latest quarterly earnings report has put the question "Will AI really deliver commensurate returns, or is it just a spending bubble?" at the center of debate across every financial forum.
EARNINGS SEASON & MICROSOFT’S AI SPENDING CONUNDRUM
#canmicrosoftdeliveronai
Wall Street and the global investment community are caught in an unprecedented tug-of-war: on one hand, they marvel at record revenues; on the other, they are deeply uneasy about the staggering rate at which money is being "burned" on artificial intelligence. Microsoft’s (MSFT) latest quarterly earnings report has put the question "Will AI really deliver commensurate returns, or is it just a spending bubble?" at the center of debate across every financial forum.
Wall Street and the global investment community are caught in an unprecedented tug-of-war: on one hand, they marvel at record revenues; on the other, they are deeply uneasy about the staggering rate at which money is being "burned" on artificial intelligence. Microsoft’s (MSFT) latest quarterly earnings report has put the question "Will AI really deliver commensurate returns, or is it just a spending bubble?" at the center of debate across every financial forum.
3
16.1k
Log in to explore more content
Join global crypto users on Binance Square
⚡️ Get latest and useful information about crypto.
💬 Trusted by the world’s largest crypto exchange.
👍 Discover real insights from verified creators.
Email / Phone number
Trending Topics
BinanceProcesses$4.65BWithdrawals
0 views
1 Discussing
Binance Processes $4.65 Billion in Withdrawals After Reopening, Net Outflow of $3.64 Billion Equals 2.1% of Its $171 Billion in Assets
Binance News
·5 Likes
·839 views
WithdrawalsBack: 15 networks live
2,267 views
66 Discussing
BinanceUpdatesProofofReservesAddresses
56,703 views
1,004 Discussing