
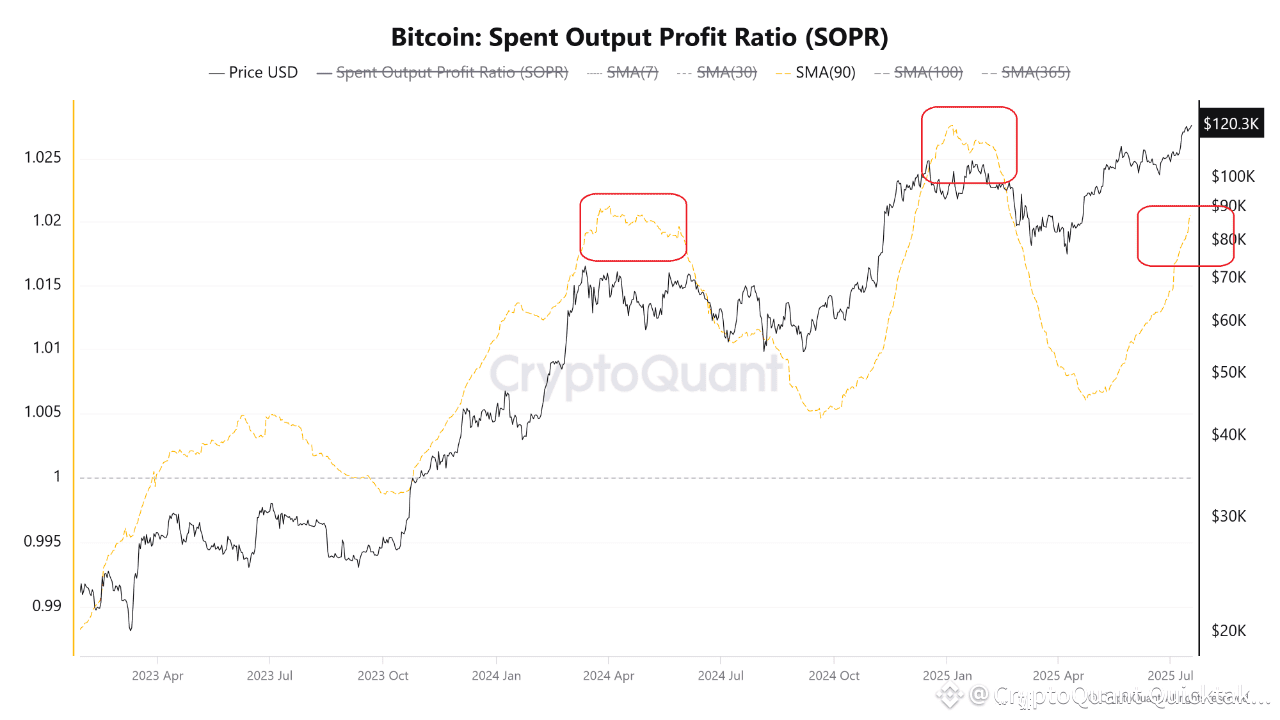
Every time the 90‑day SOPR pushed into the 1.02‑1.03 band, price rolled over ‑10 ~ ‑20 % within a couple of weeks.
We’re back at ≈ 1.018 and climbing. A fresh tag of 1.02 would flash the same “profit‑taking overheated” signal.
Reading the chart
Date 90‑d SOPR peak Price reaction
Mar–Apr 2024 1.02‑1.03 ‑18 % in 14 days
Feb–Mar 2025 1.026 ‑12 % in 10 days
Now (Jul 2025) 1.018 → rising TBD
Above 1.00 = coins moving in profit. At ~1.02 the market historically tips from orderly selling to crowded profit‑taking.
Context
Spot‑ETF demand still strong; price challenging $120 K.
If funding rates spike while SOPR > 1.02, forced long liquidations have followed.
Exchange balances keep trending lower, so any dip is more about leverage flush than “whales dumping.”
My playbook (not advice)
Keep the long‑term stack, but let 20‑30 % tactical capital breathe—trim or hedge if SOPR clears 1.02.
History says the real buy window opens when the 90‑day line sinks back below 1.00.
Big picture is still bullish (ETF + macro tailwinds), so I’m treating sharp pullbacks as accumulation zones.
TL;DR
90‑day SOPR is inches from 1.02. That level has preceded quick 10‑20 % shake‑outs twice already this cycle. Tighten risk, watch for the reset, reload when the heat cools.
Written by 우민규 Woominkyu
