
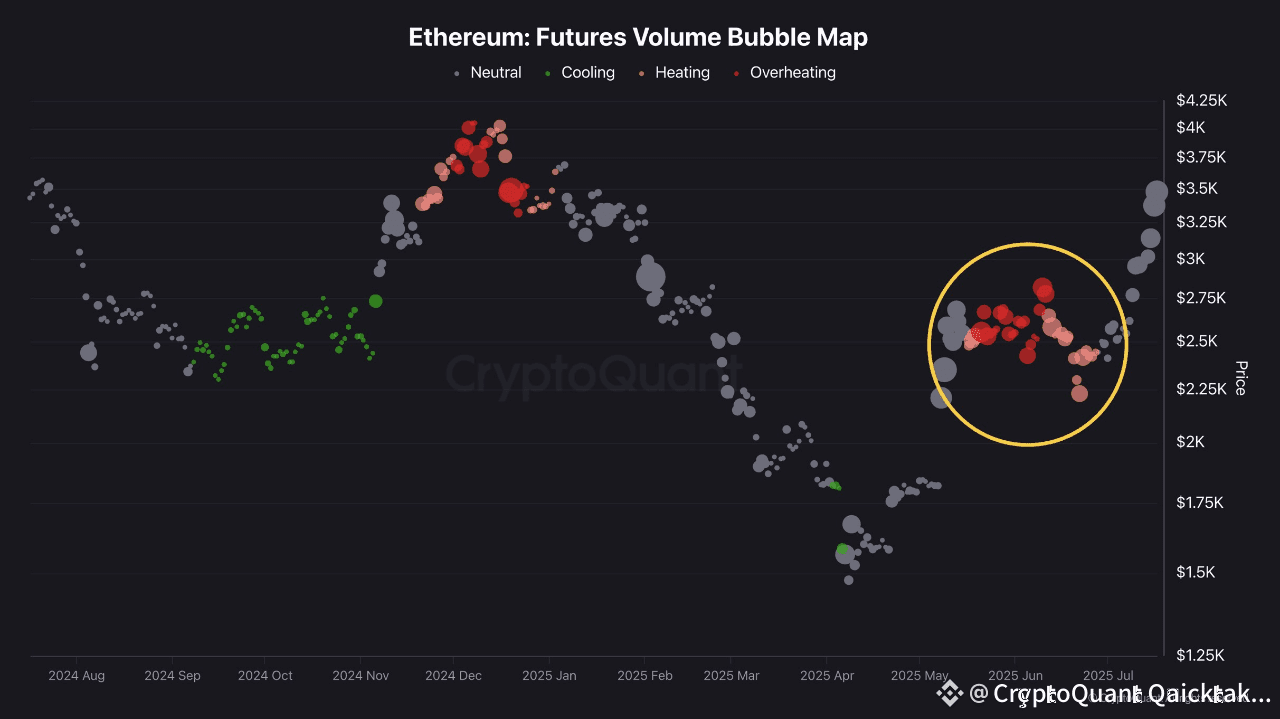
Ethereum’s recent rally appears to be primarily driven by activity in the futures market.
The Ethereum Futures Volume Bubble Map clearly highlights overheating in the areas marked with yellow circles. During this period, a surge in futures trading volume signaled short-term market overheating, leading to an increase in Ethereum’s price. This suggests that leveraged trading has been the primary catalyst behind the recent upward price movement.
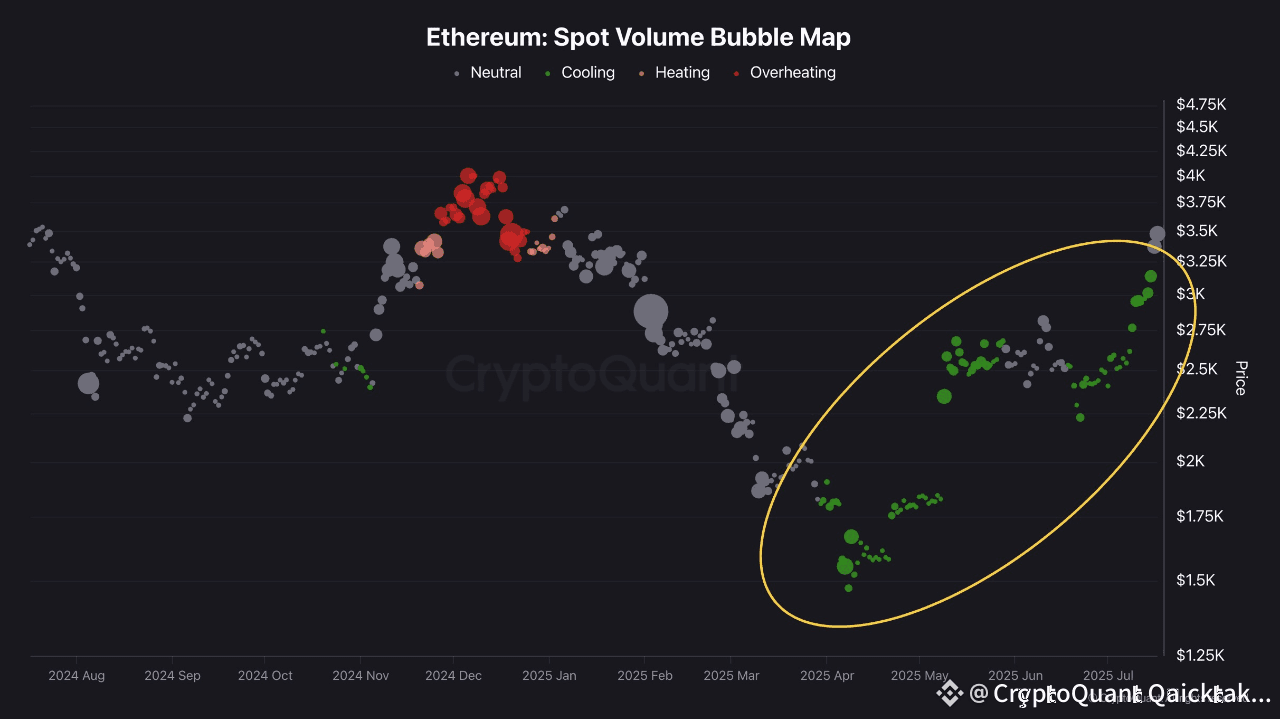
In contrast, the Ethereum Spot Volume Bubble Map presents a different picture. Despite the sharp price rise, spot volume has remained relatively stable without signs of overheating, indicating a cooling phase. This reflects the current absence of significant spot market buying pressure. Should spot demand increase going forward, it could further support Ethereum’s upward momentum.
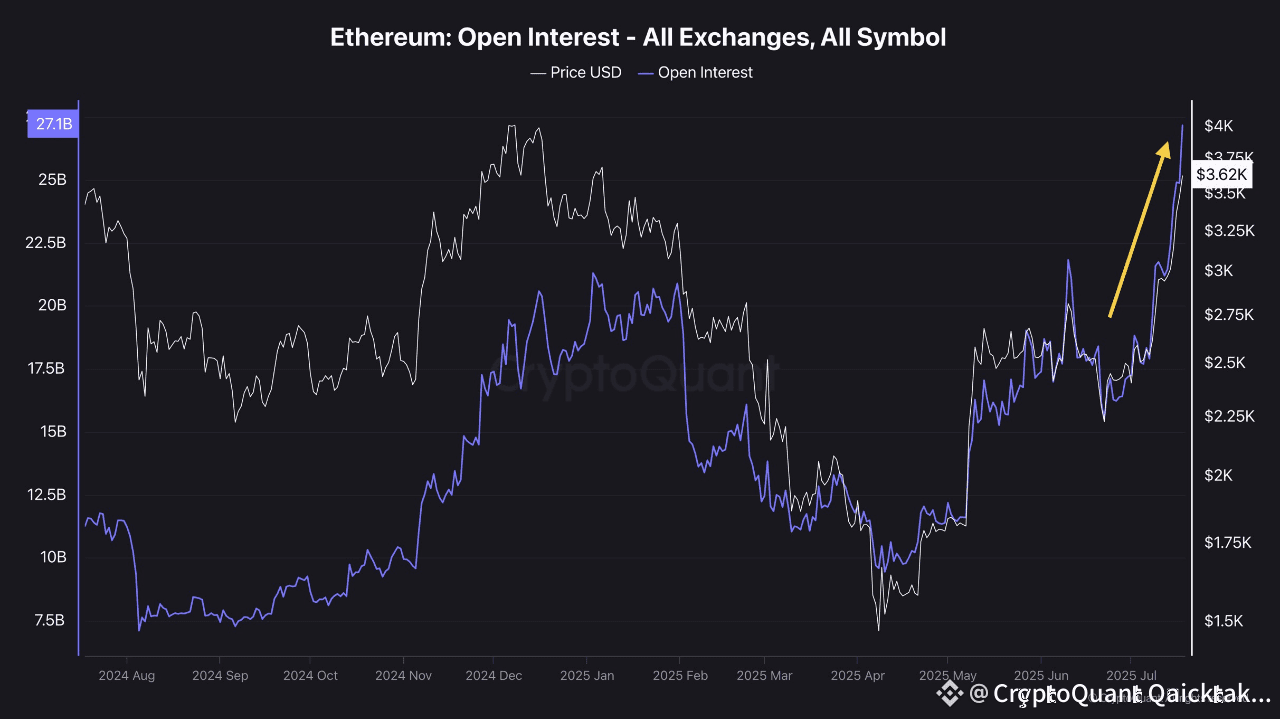
Additionally, Ethereum Open Interest (OI) has surged to reach new all-time highs. This reinforces the view that the futures market is currently the key driver behind Ethereum’s price action.
In summary, Ethereum’s current rally is being led by the futures market. The key question now is whether this speculative momentum will transition into genuine demand from the spot market. If spot buying accelerates, Ethereum’s rally could broaden into a wider altcoin market surge. Therefore, investors should carefully monitor not only futures market dynamics but also signs of increasing spot demand.
Written by Avocado_onchain
