
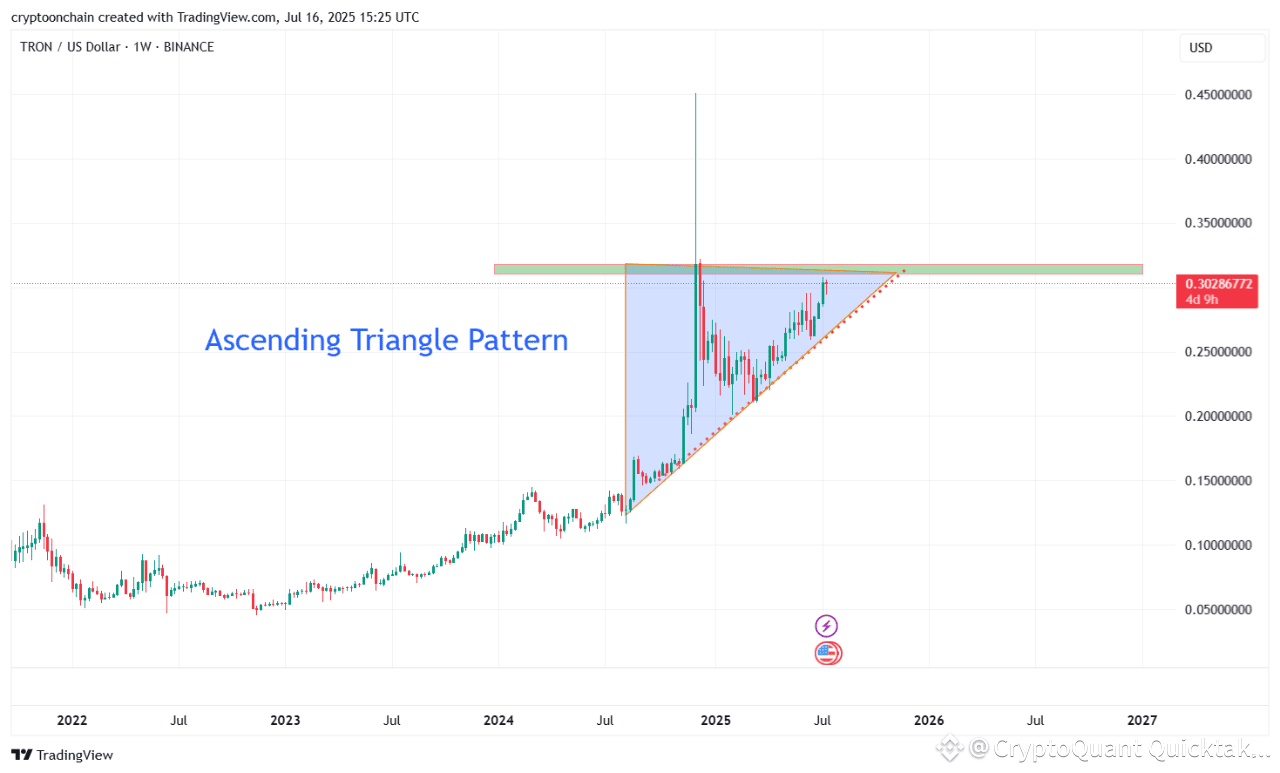
The TRX/USDT weekly chart shows TRON pushing up against a key resistance zone near $0.32, while forming a classic ascending triangle pattern right below this level. This bullish formation often signals building momentum among buyers and increases the probability of a breakout above resistance.
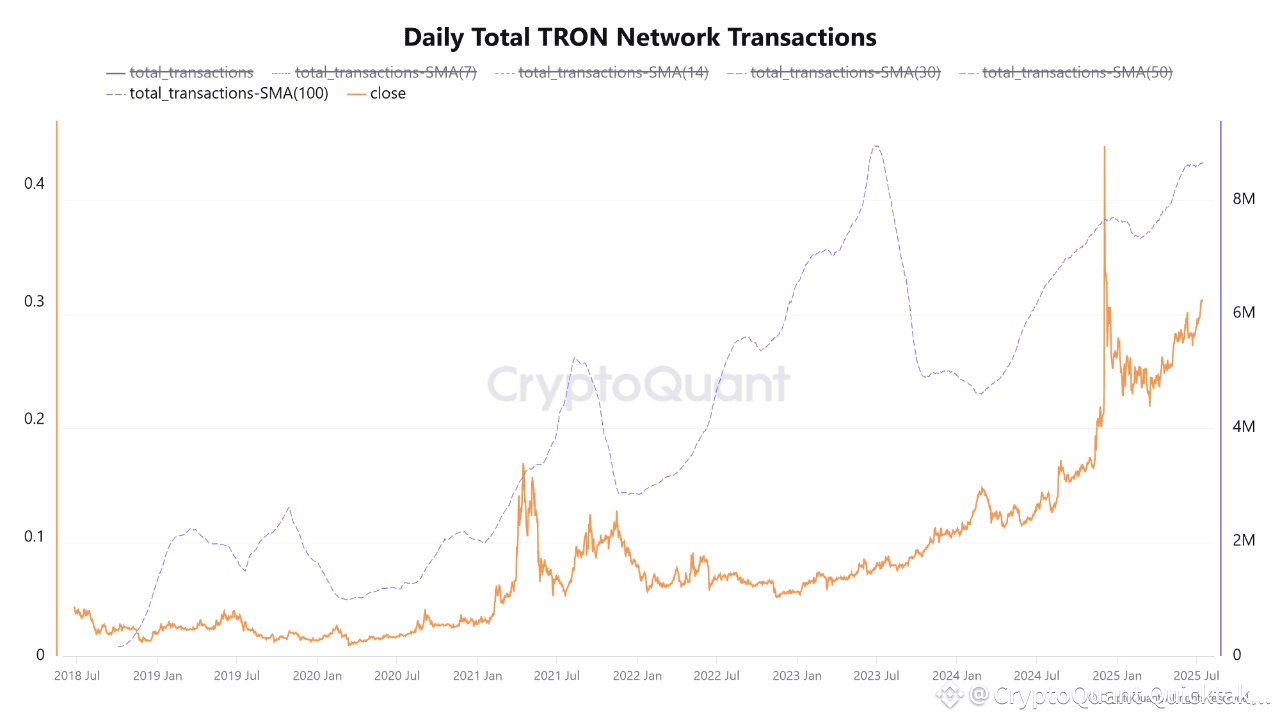
What makes the case for a potential breakout even stronger is the robust on-chain activity. Daily transaction counts on the TRON network have surged above 9 million, and, according to CryptoQuant data, the 100-day moving average of transactions is also hovering near all-time highs. This sharp growth highlights both expanding user engagement and sustained demand for the network’s utility. Historically, such increases in network activity can provide the fuel necessary for the next major price move—especially when occurring in tandem with well-defined technical patterns.
If TRX manages to decisively break above the $0.32 resistance with meaningful trading volume, there is considerable potential for the start of a new bullish leg in the medium term. However, traders should remain cautious of the risk of fake-outs or temporary pullbacks following the initial breakout attempt.
Summary:
The combination of an ascending triangle pattern and record-high on-chain activity substantially increases the odds of a successful breakout for TRON. Still, final confirmation will require a clear and sustained move above the $0.32 level.
Written by CryptoOnchain
