

TOPGEON
1.3k Posts

TOPGEON
Report
Block User
@YourHandle | Crypto Passion | Airdrop Enthusiast | Trade Signals | Join me on Binance Square for crypto insights and profitable strategies | $TOPGEON
Occasional Trader
3.5 Years
4 Following
7.4K+ Followers
4.3K+ Liked
Posts
All
Quotes
Videos
PINNED
·
--
Meet Top Pigeon 🐦🕶️
He buys every top.
He never learns.
He's still smiling.
We've all been this pigeon. Now he has a coin.
$TOPGEON is live on @pumpdotfun
CA: EYqiFXZaAPGKw4wQXFqUPz4EUqmma7LHXATfx7Nypump
#solana #memecoin
Meet Top Pigeon 🐦🕶️
He buys every top.
He never learns.
He's still smiling.
We've all been this pigeon. Now he has a coin.
$TOPGEON is live on @pumpdotfun
CA: EYqiFXZaAPGKw4wQXFqUPz4EUqmma7LHXATfx7Nypump
#solana #memecoin
He buys every top.
He never learns.
He's still smiling.
We've all been this pigeon. Now he has a coin.
$TOPGEON is live on @pumpdotfun
CA: EYqiFXZaAPGKw4wQXFqUPz4EUqmma7LHXATfx7Nypump
#solana #memecoin
1
3
202
·
--
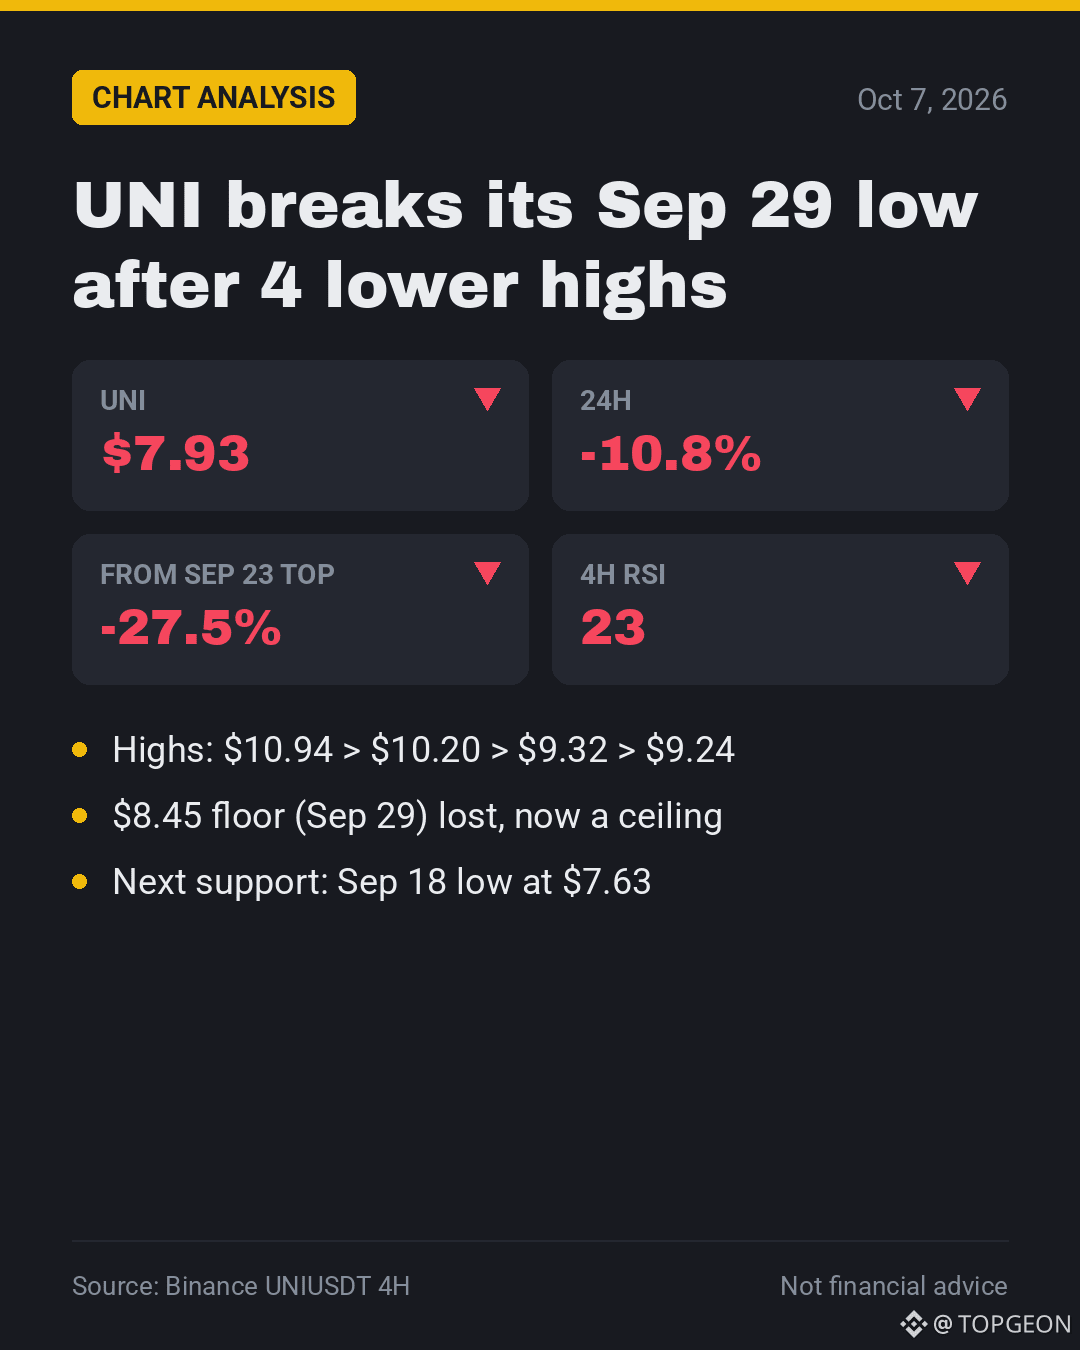
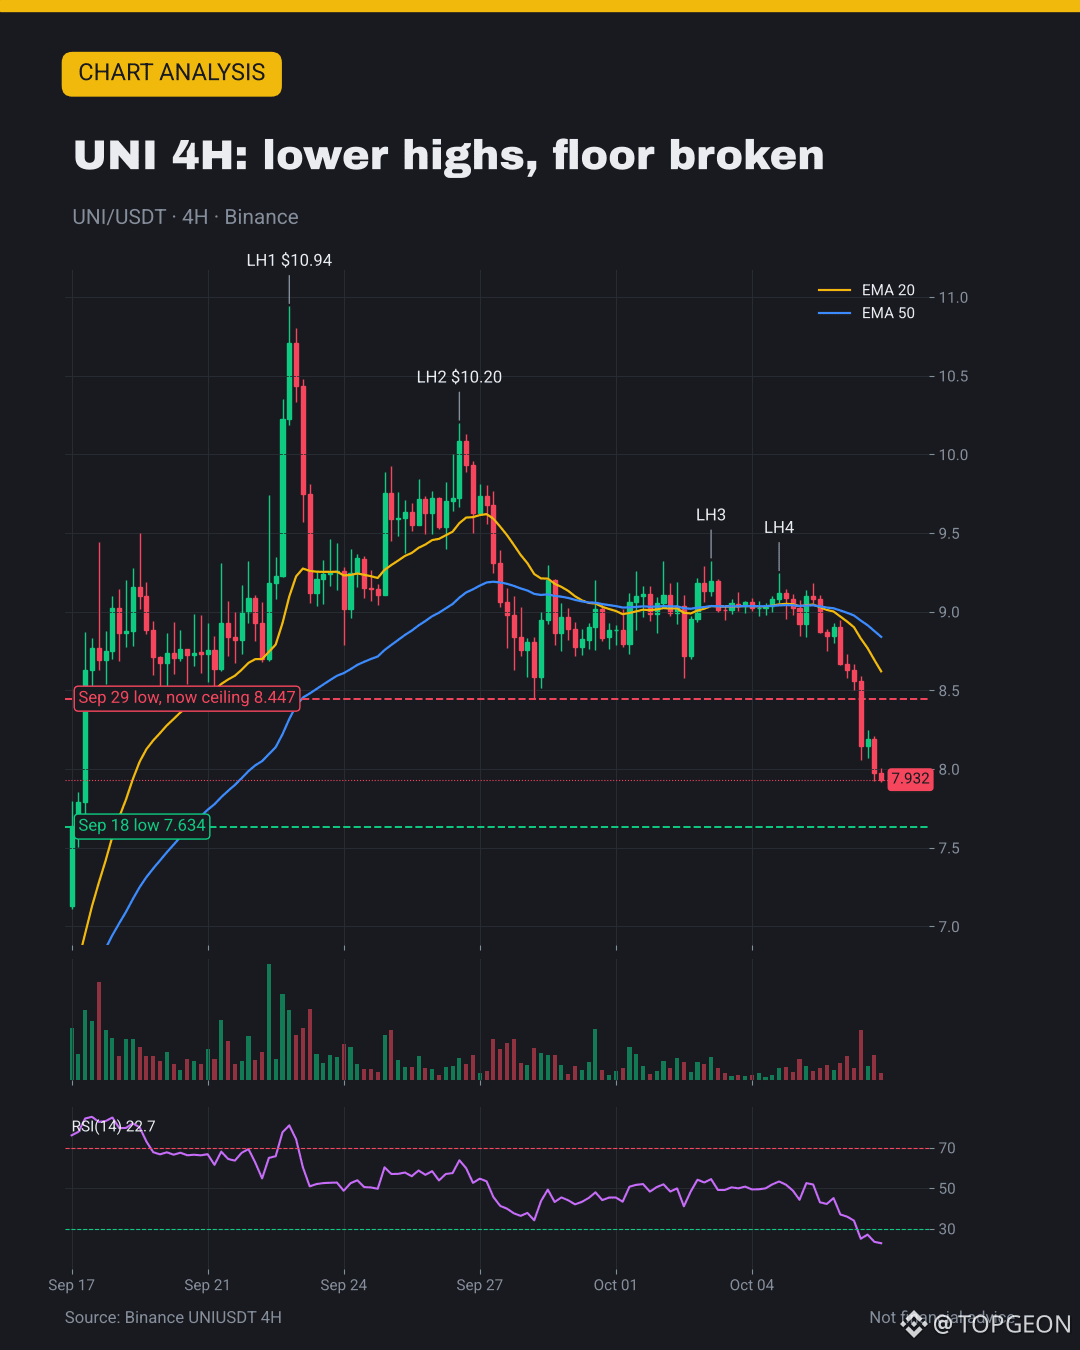
❓ Is $UNI's slide just starting? $7.93, -10.8%, floor lost
📉 4 lower highs since Sep 23: $10.94, $10.20, $9.32, $9.24
⚠️ The $8.45 Sep 29 low broke: now the first ceiling
⚠️ Under both 4H EMAs ($8.62 / $8.84), 27.5% off the top
⚠️ A wallet moved 654K UNI to Coinbase (Phemex News)
✅ 4H RSI 23: stretched; CME eyes UNI futures for Oct 19
🎯 My take: $7.63 must hold; a 4H close over $8.45 ends the slide
💬 Buying UNI near $7.6 or waiting for $8.45 back? 👇
#Uniswap #DeFi #TechnicalAnalysis
❓ Is $UNI 's slide just starting? $7.93, -10.8%, floor lost
📉 4 lower highs since Sep 23: $10.94, $10.20, $9.32, $9.24
⚠️ The $8.45 Sep 29 low broke: now the first ceiling
⚠️ Under both 4H EMAs ($8.62 / $8.84), 27.5% off the top
⚠️ A wallet moved 654K UNI to Coinbase (Phemex News)
✅ 4H RSI 23: stretched; CME eyes UNI futures for Oct 19
🎯 My take: $7.63 must hold; a 4H close over $8.45 ends the slide
💬 Buying UNI near $7.6 or waiting for $8.45 back? 👇
#Uniswap #DeFi #TechnicalAnalysis
📉 4 lower highs since Sep 23: $10.94, $10.20, $9.32, $9.24
⚠️ The $8.45 Sep 29 low broke: now the first ceiling
⚠️ Under both 4H EMAs ($8.62 / $8.84), 27.5% off the top
⚠️ A wallet moved 654K UNI to Coinbase (Phemex News)
✅ 4H RSI 23: stretched; CME eyes UNI futures for Oct 19
🎯 My take: $7.63 must hold; a 4H close over $8.45 ends the slide
💬 Buying UNI near $7.6 or waiting for $8.45 back? 👇
#Uniswap #DeFi #TechnicalAnalysis
16
·
--
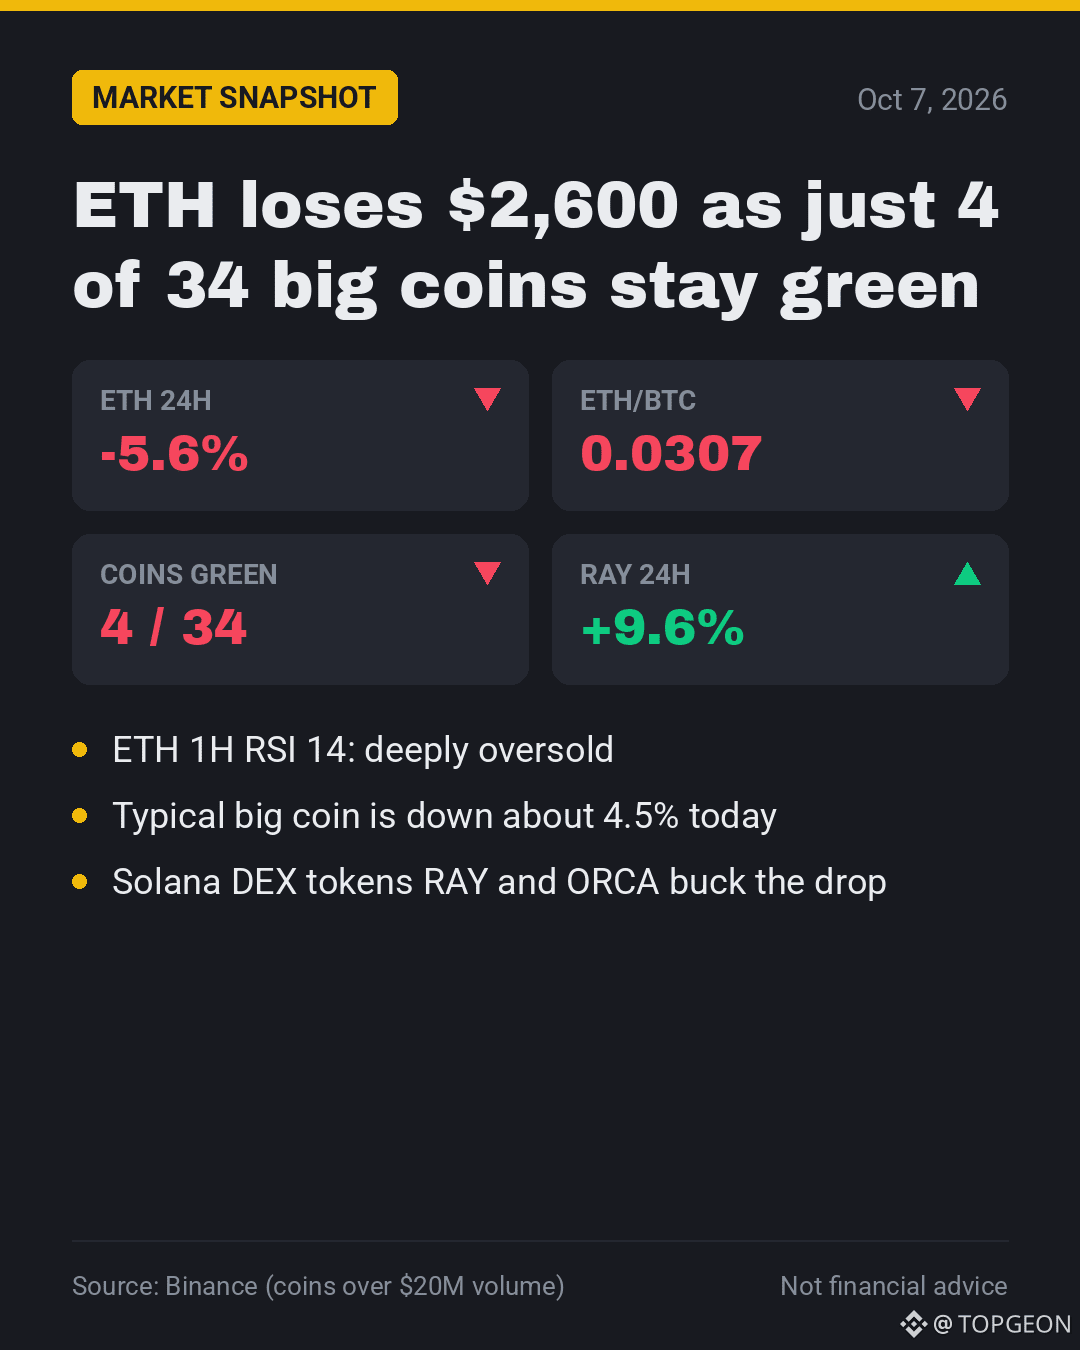
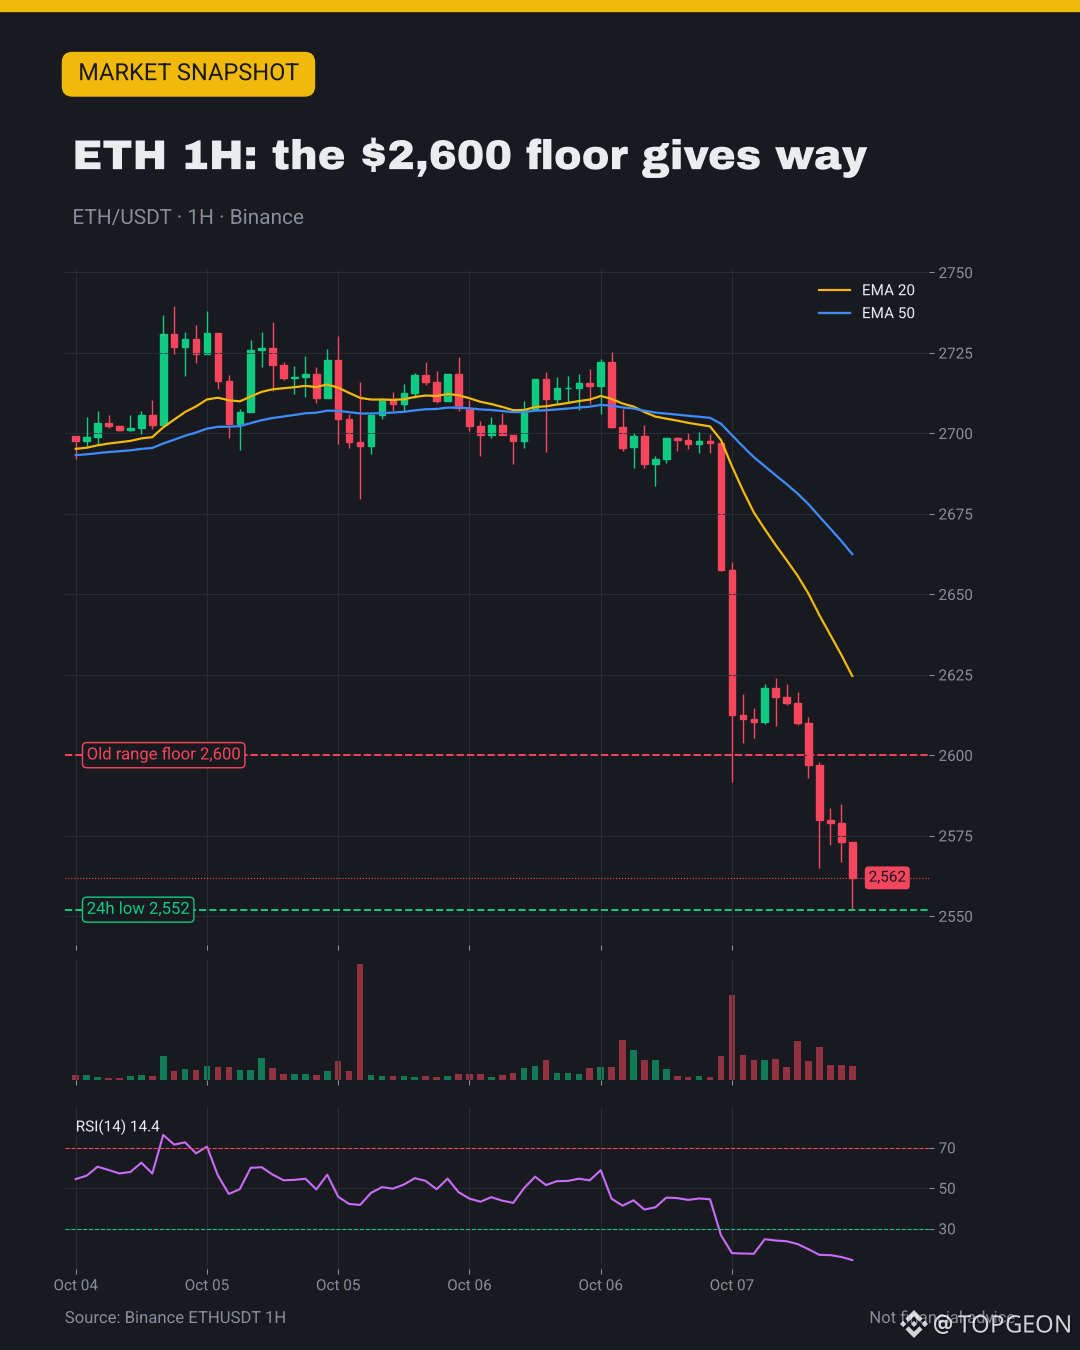
🩸 $ETH slips to $2,560 (-5.6%) while $RAY jumps 9.6%
• Only 4 of 34 big Binance coins are up on the day
• Typical big coin: about -4.5% in 24h
• ETH/BTC sinks to 0.0307: ETH bleeding harder than BTC
• ETH 1H RSI 14, two EMAs far overhead ($2,625 / $2,662)
• Green outliers: Solana DEX tokens RAY and ORCA (+8%)
🎯 My take: ETH needs $2,600 back fast; else $2,500 is in play
💬 Oversold bounce soon or more pain first? 👇
#Ethereum #MarketUpdate #Solana
🩸 $ETH slips to $2,560 (-5.6%) while $RAY jumps 9.6%
• Only 4 of 34 big Binance coins are up on the day
• Typical big coin: about -4.5% in 24h
• ETH/BTC sinks to 0.0307: ETH bleeding harder than BTC
• ETH 1H RSI 14, two EMAs far overhead ($2,625 / $2,662)
• Green outliers: Solana DEX tokens RAY and ORCA (+8%)
🎯 My take: ETH needs $2,600 back fast; else $2,500 is in play
💬 Oversold bounce soon or more pain first? 👇
#Ethereum #MarketUpdate #Solana
• Only 4 of 34 big Binance coins are up on the day
• Typical big coin: about -4.5% in 24h
• ETH/BTC sinks to 0.0307: ETH bleeding harder than BTC
• ETH 1H RSI 14, two EMAs far overhead ($2,625 / $2,662)
• Green outliers: Solana DEX tokens RAY and ORCA (+8%)
🎯 My take: ETH needs $2,600 back fast; else $2,500 is in play
💬 Oversold bounce soon or more pain first? 👇
#Ethereum #MarketUpdate #Solana
65
·
--
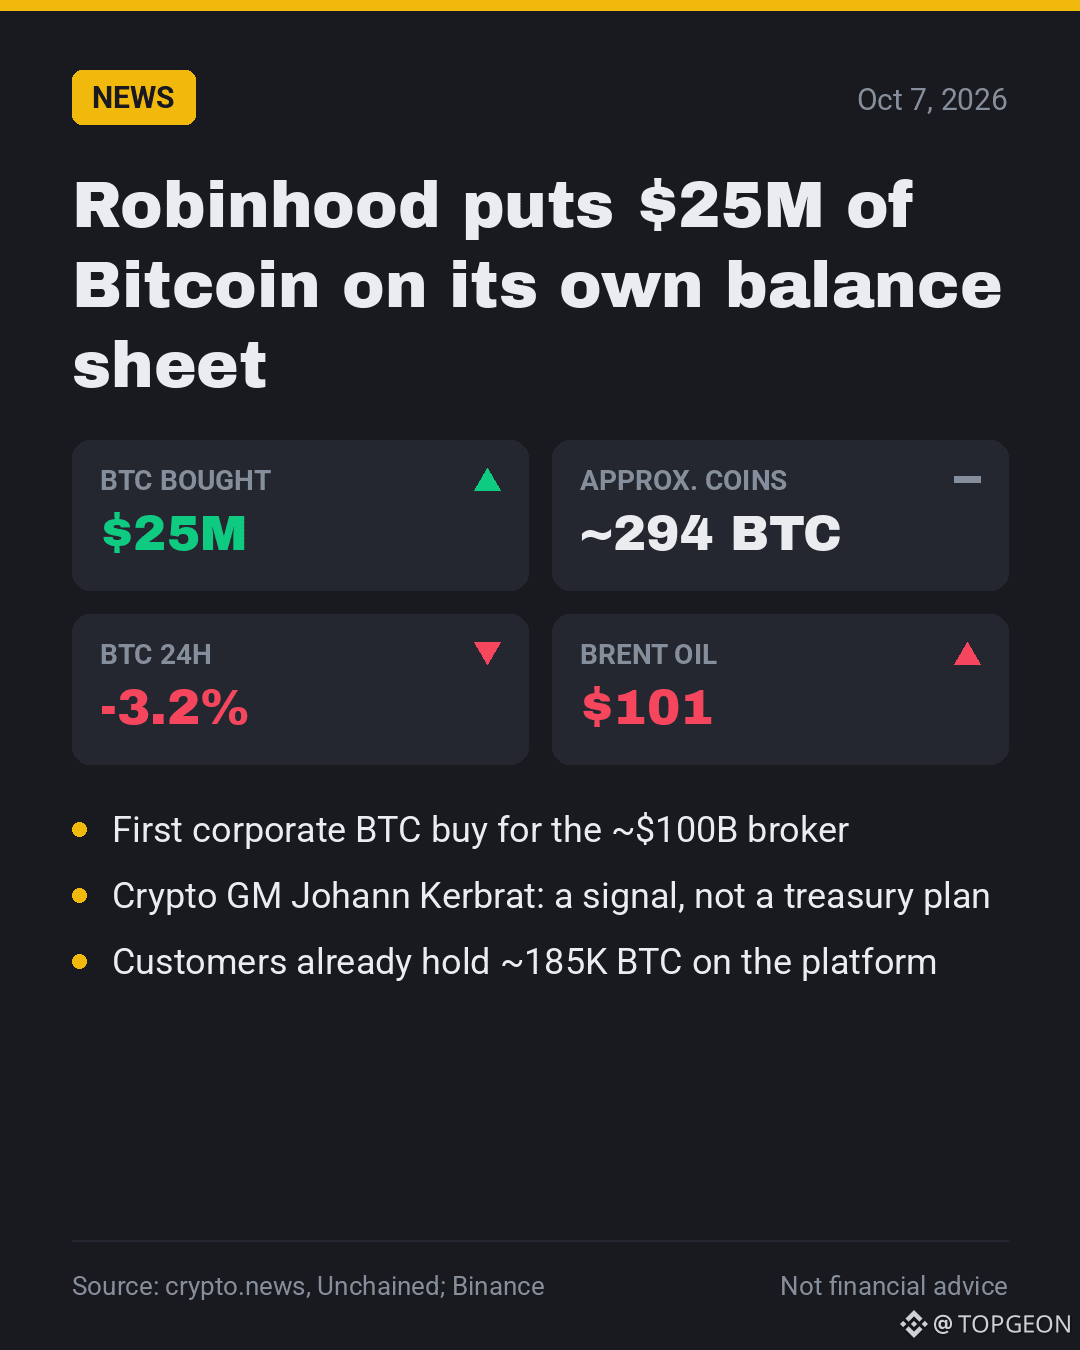
🟢 Robinhood just bought $25M of $BTC for its own books
1️⃣ First corporate BTC buy for the ~$100B broker
2️⃣ Crypto chief Kerbrat: a signal, not a treasury program
3️⃣ ~294 BTC, tiny next to ~185K BTC held for customers
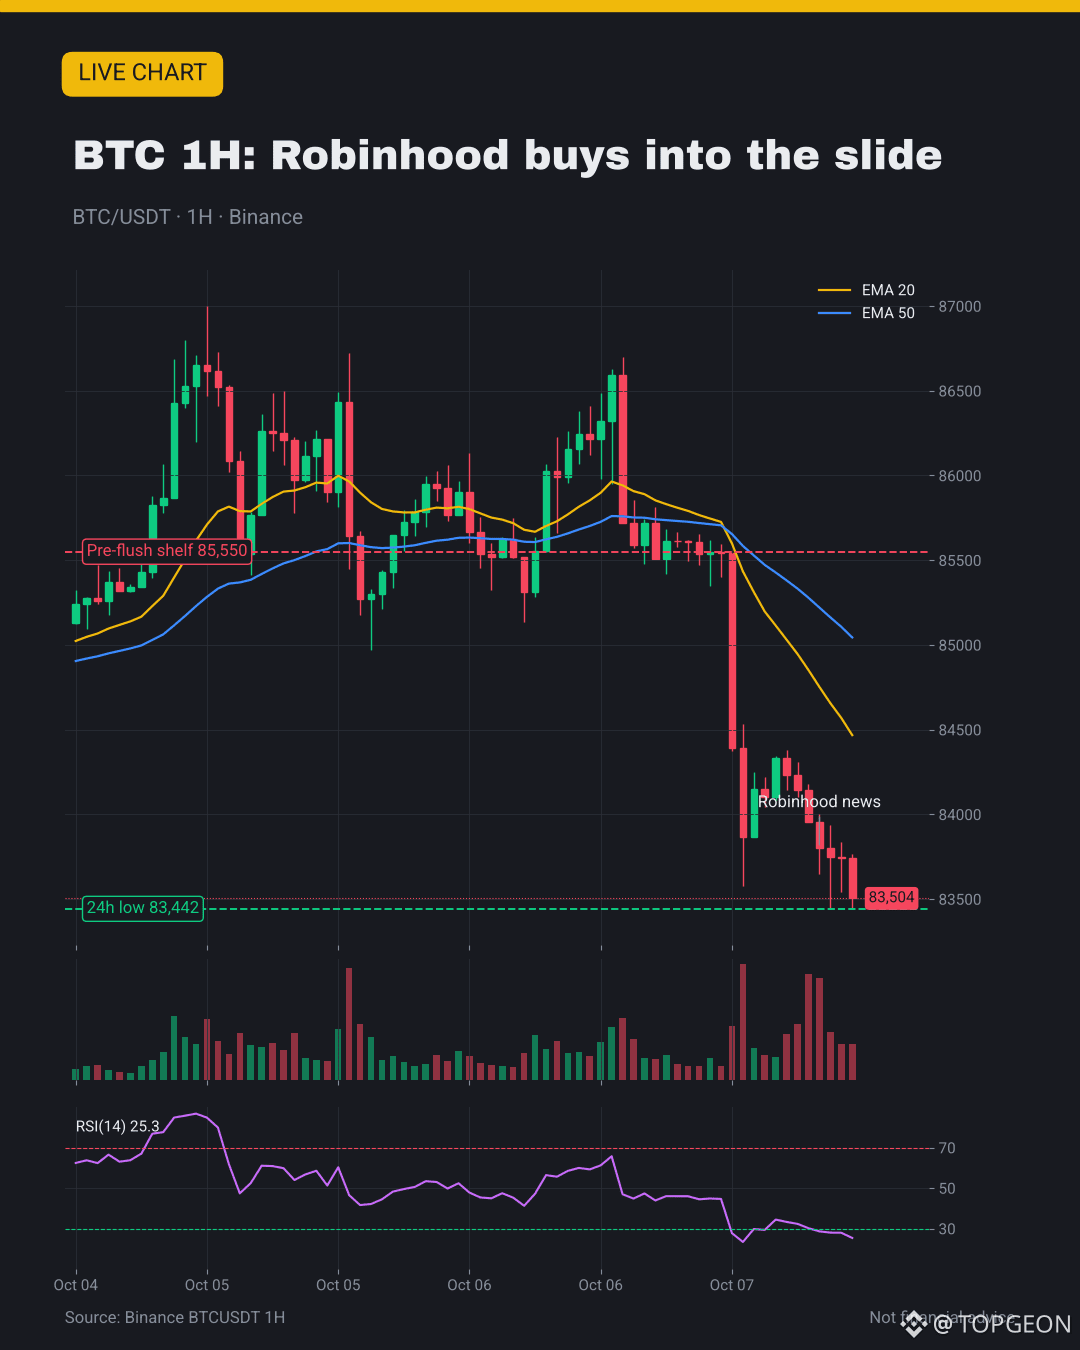
📉 Price shrugs: BTC $83.46K, -3.2%, new 24h low $83,426
⛽ Brent above $101 keeps risk assets on the back foot
🎯 My take: $83.4K must hold; a 1H close above $84.5K eases it
💬 Big signal or just a rounding error for Robinhood? 👇
#Bitcoin #Robinhood #CryptoNews
🟢 Robinhood just bought $25M of $BTC for its own books
1️⃣ First corporate BTC buy for the ~$100B broker
2️⃣ Crypto chief Kerbrat: a signal, not a treasury program
3️⃣ ~294 BTC, tiny next to ~185K BTC held for customers
📉 Price shrugs: BTC $83.46K, -3.2%, new 24h low $83,426
⛽ Brent above $101 keeps risk assets on the back foot
🎯 My take: $83.4K must hold; a 1H close above $84.5K eases it
💬 Big signal or just a rounding error for Robinhood? 👇
#Bitcoin #Robinhood #CryptoNews
1️⃣ First corporate BTC buy for the ~$100B broker
2️⃣ Crypto chief Kerbrat: a signal, not a treasury program
3️⃣ ~294 BTC, tiny next to ~185K BTC held for customers
📉 Price shrugs: BTC $83.46K, -3.2%, new 24h low $83,426
⛽ Brent above $101 keeps risk assets on the back foot
🎯 My take: $83.4K must hold; a 1H close above $84.5K eases it
💬 Big signal or just a rounding error for Robinhood? 👇
#Bitcoin #Robinhood #CryptoNews
50
·
--
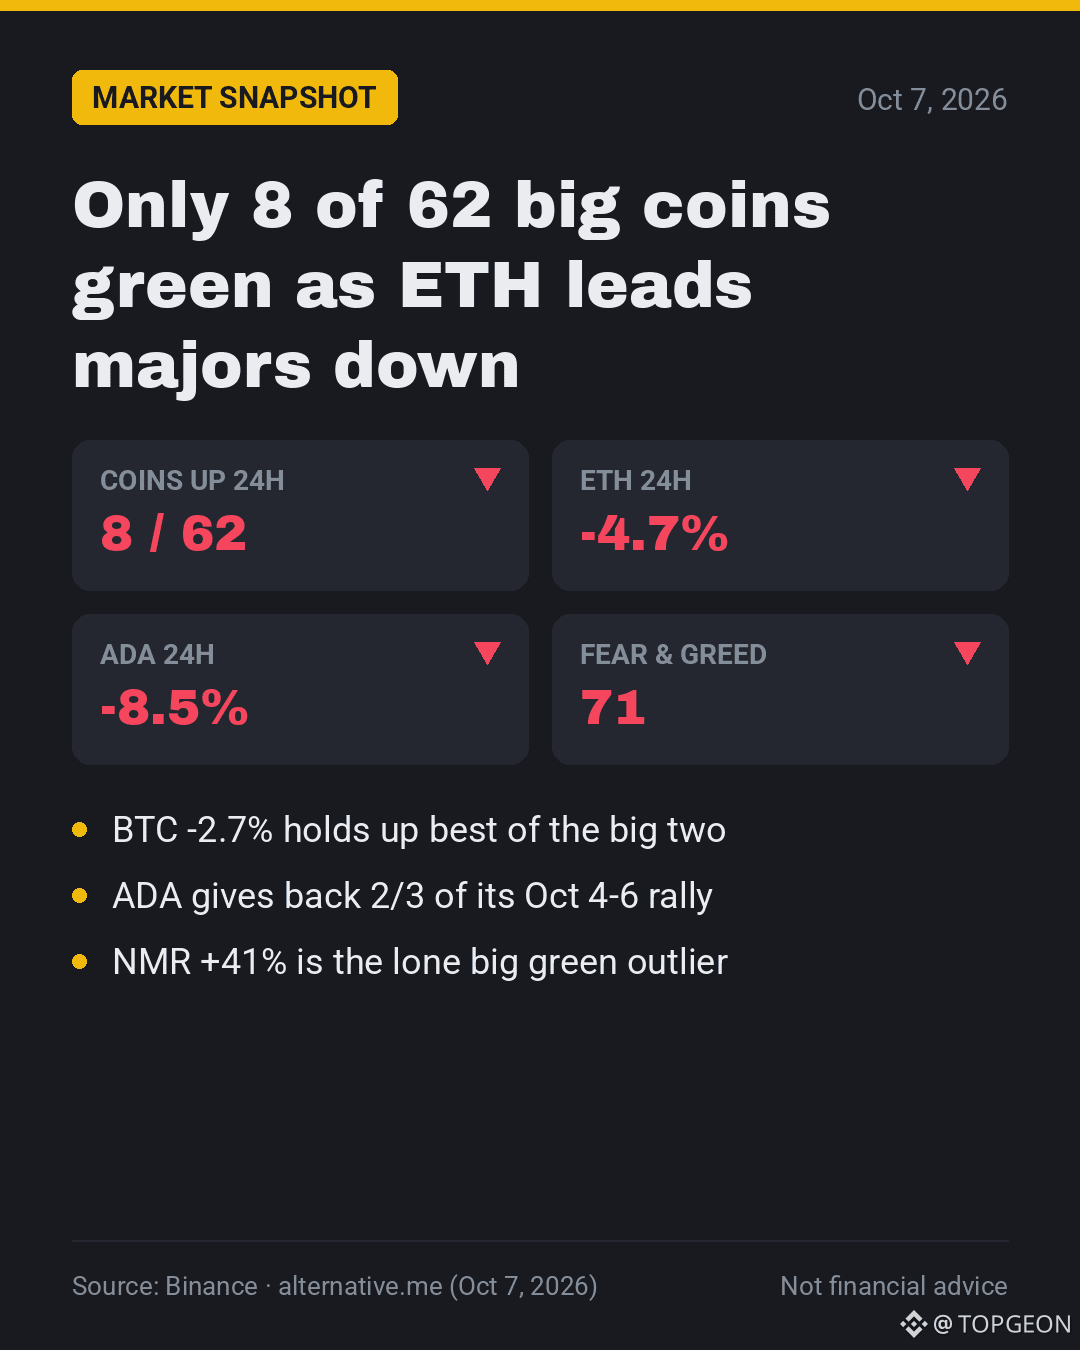
📊 3 numbers from a red Wednesday: $ETH -4.7%, $ADA -8.5%
1️⃣ Just 8 of 62 big Binance coins are green today
2️⃣ ETH ~$2,587, under $2,600; BTC -2.7% holds up better
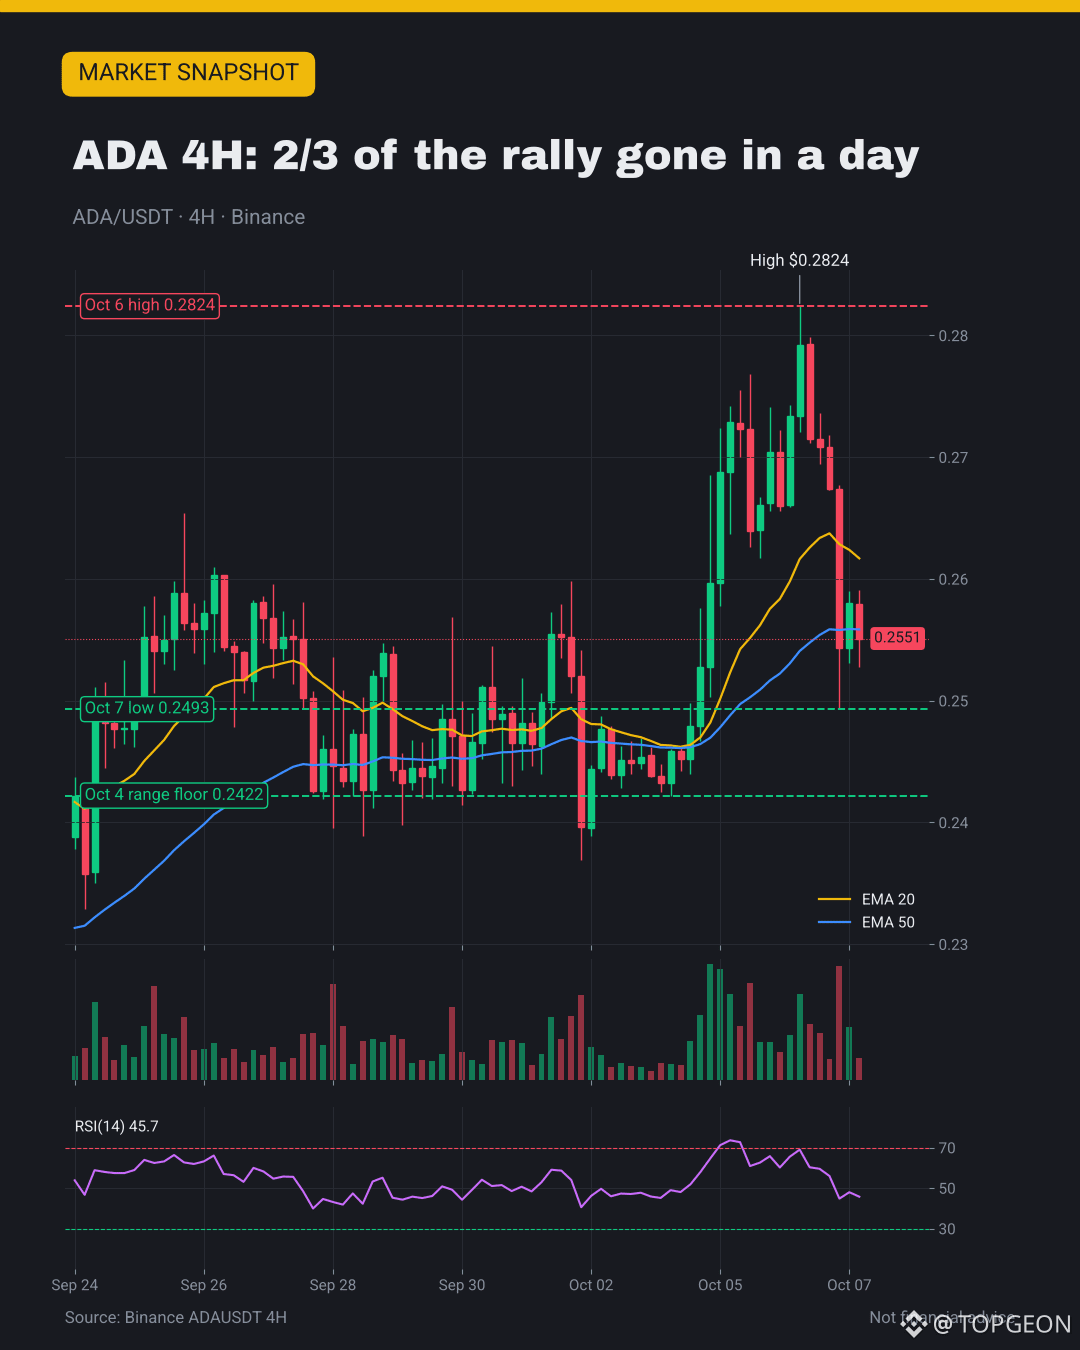
3️⃣ ADA ~$0.255: 2/3 of its Oct 4-6 run gone (high $0.2824)
😶 Fear & Greed still 71 (Greed) after $487M in long flushes
🎯 My take: ADA must hold $0.249; lose it and $0.242 is next
💬 Greed at 71 on a red day: complacent or fine? 👇
#MarketUpdate #Altcoins #Cardano
📊 3 numbers from a red Wednesday: $ETH -4.7%, $ADA -8.5%
1️⃣ Just 8 of 62 big Binance coins are green today
2️⃣ ETH ~$2,587, under $2,600; BTC -2.7% holds up better
3️⃣ ADA ~$0.255: 2/3 of its Oct 4-6 run gone (high $0.2824)
😶 Fear & Greed still 71 (Greed) after $487M in long flushes
🎯 My take: ADA must hold $0.249; lose it and $0.242 is next
💬 Greed at 71 on a red day: complacent or fine? 👇
#MarketUpdate #Altcoins #Cardano
1️⃣ Just 8 of 62 big Binance coins are green today
2️⃣ ETH ~$2,587, under $2,600; BTC -2.7% holds up better
3️⃣ ADA ~$0.255: 2/3 of its Oct 4-6 run gone (high $0.2824)
😶 Fear & Greed still 71 (Greed) after $487M in long flushes
🎯 My take: ADA must hold $0.249; lose it and $0.242 is next
💬 Greed at 71 on a red day: complacent or fine? 👇
#MarketUpdate #Altcoins #Cardano
10
·
--
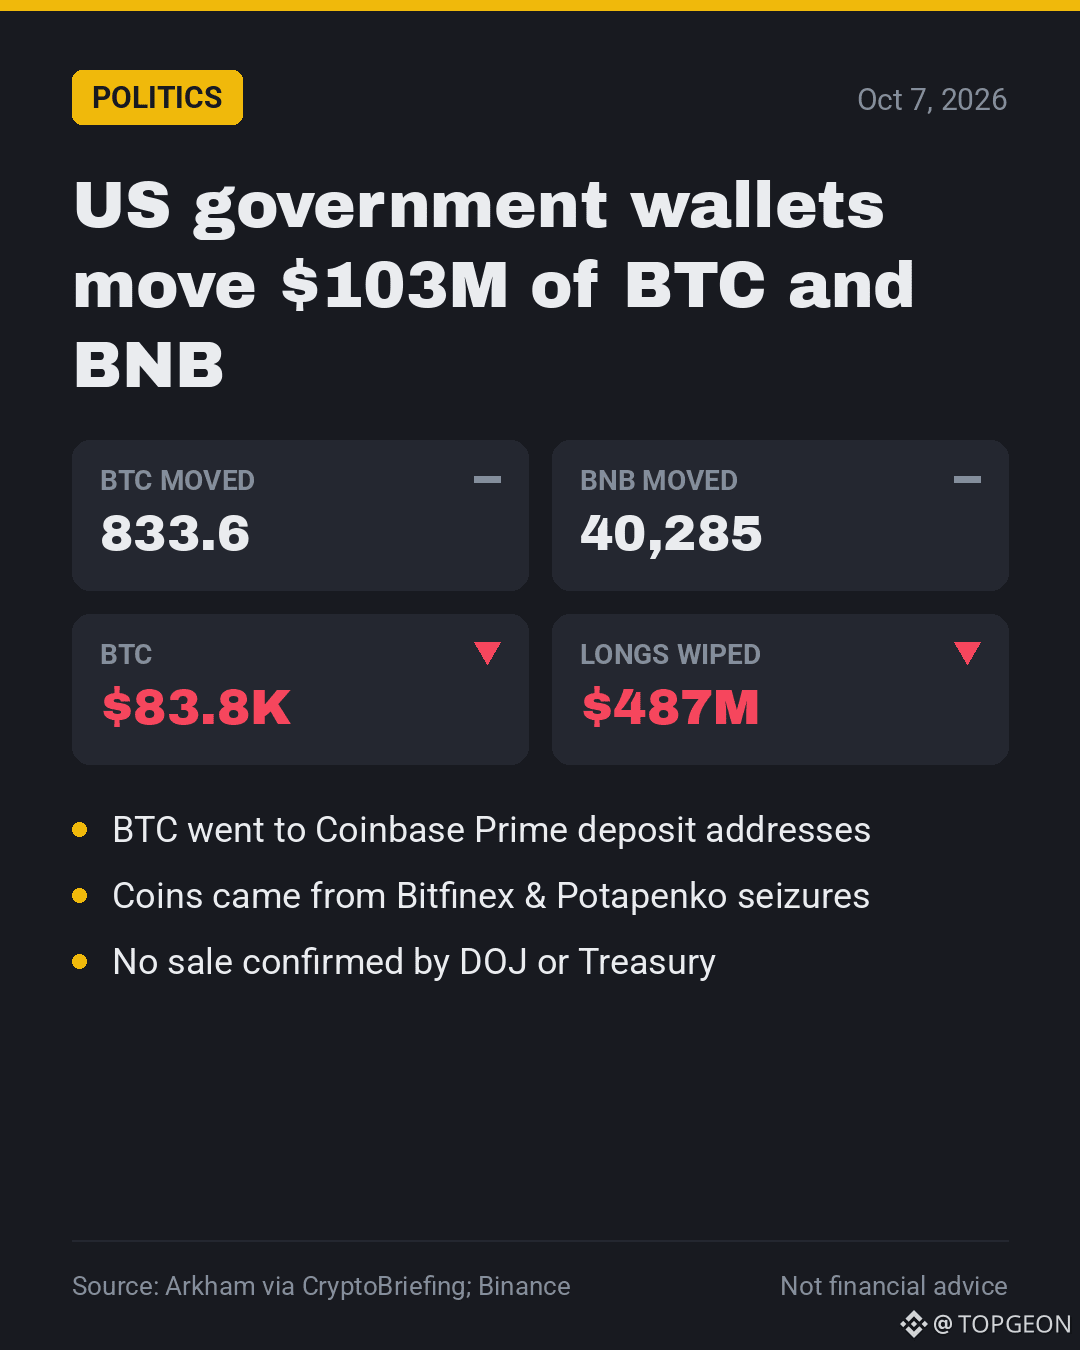
🏛️ US gov wallets shift $103M in $BTC and BNB as price slides
• 833.6 BTC ($71.6M) landed at Coinbase Prime addresses
• Plus 40,285 BNB ($31.6M) to an unlabeled wallet (Arkham)
• No DOJ/Treasury word yet: could be custody, not a sale
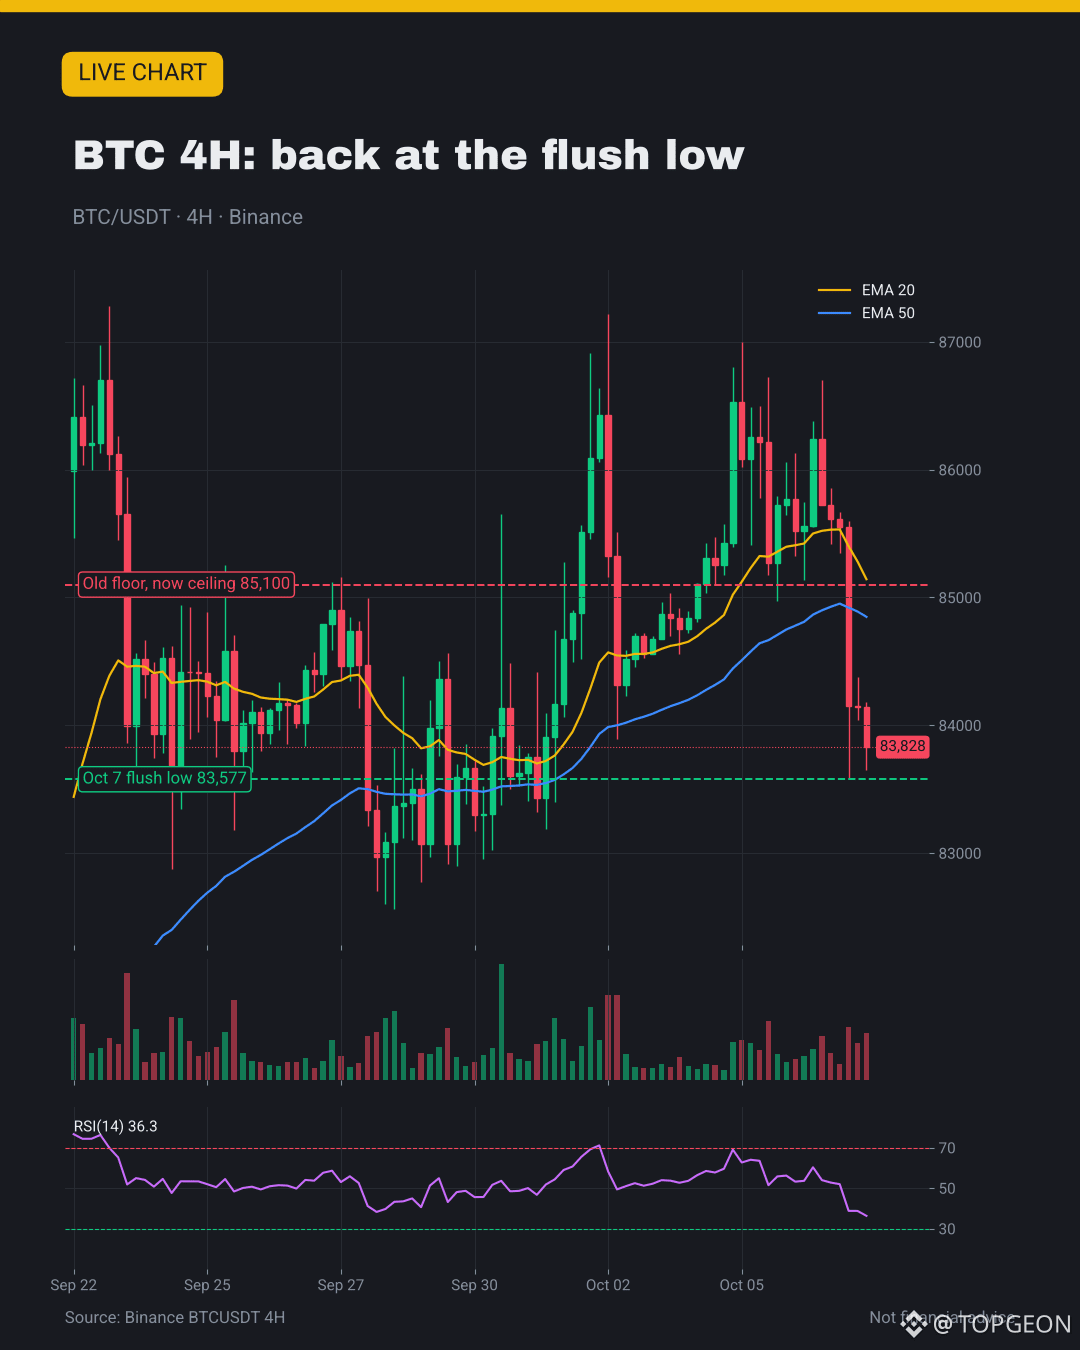
• BTC $83.8K (-2.7%), under 4H EMAs, RSI 36 · Top gainer: $NMR +39%
🎯 My take: lose $83.6K → $82.6K; reclaim $85.1K = flush over
💬 Real selling or just a wallet shuffle? 👇
#Bitcoin #USGovernment #CryptoNews
🏛️ US gov wallets shift $103M in $BTC and BNB as price slides
• 833.6 BTC ($71.6M) landed at Coinbase Prime addresses
• Plus 40,285 BNB ($31.6M) to an unlabeled wallet (Arkham)
• No DOJ/Treasury word yet: could be custody, not a sale
• BTC $83.8K (-2.7%), under 4H EMAs, RSI 36 · Top gainer: $NMR +39%
🎯 My take: lose $83.6K → $82.6K; reclaim $85.1K = flush over
💬 Real selling or just a wallet shuffle? 👇
#Bitcoin #USGovernment #CryptoNews
• 833.6 BTC ($71.6M) landed at Coinbase Prime addresses
• Plus 40,285 BNB ($31.6M) to an unlabeled wallet (Arkham)
• No DOJ/Treasury word yet: could be custody, not a sale
• BTC $83.8K (-2.7%), under 4H EMAs, RSI 36 · Top gainer: $NMR +39%
🎯 My take: lose $83.6K → $82.6K; reclaim $85.1K = flush over
💬 Real selling or just a wallet shuffle? 👇
#Bitcoin #USGovernment #CryptoNews
28
·
--
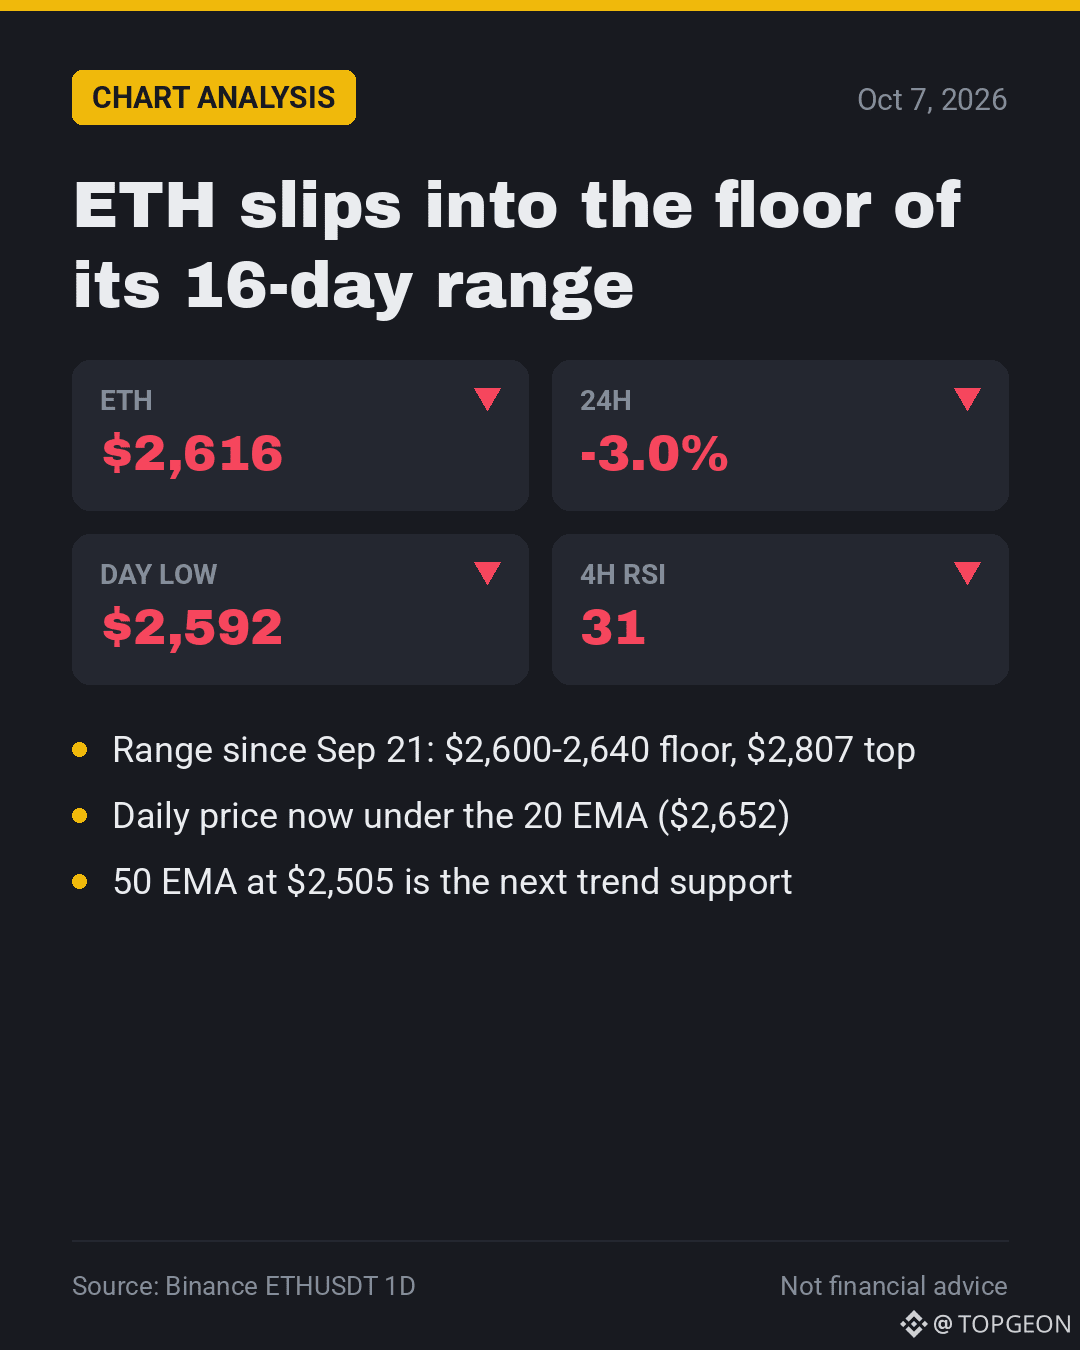
❓ Is $ETH about to lose its 16-day range?
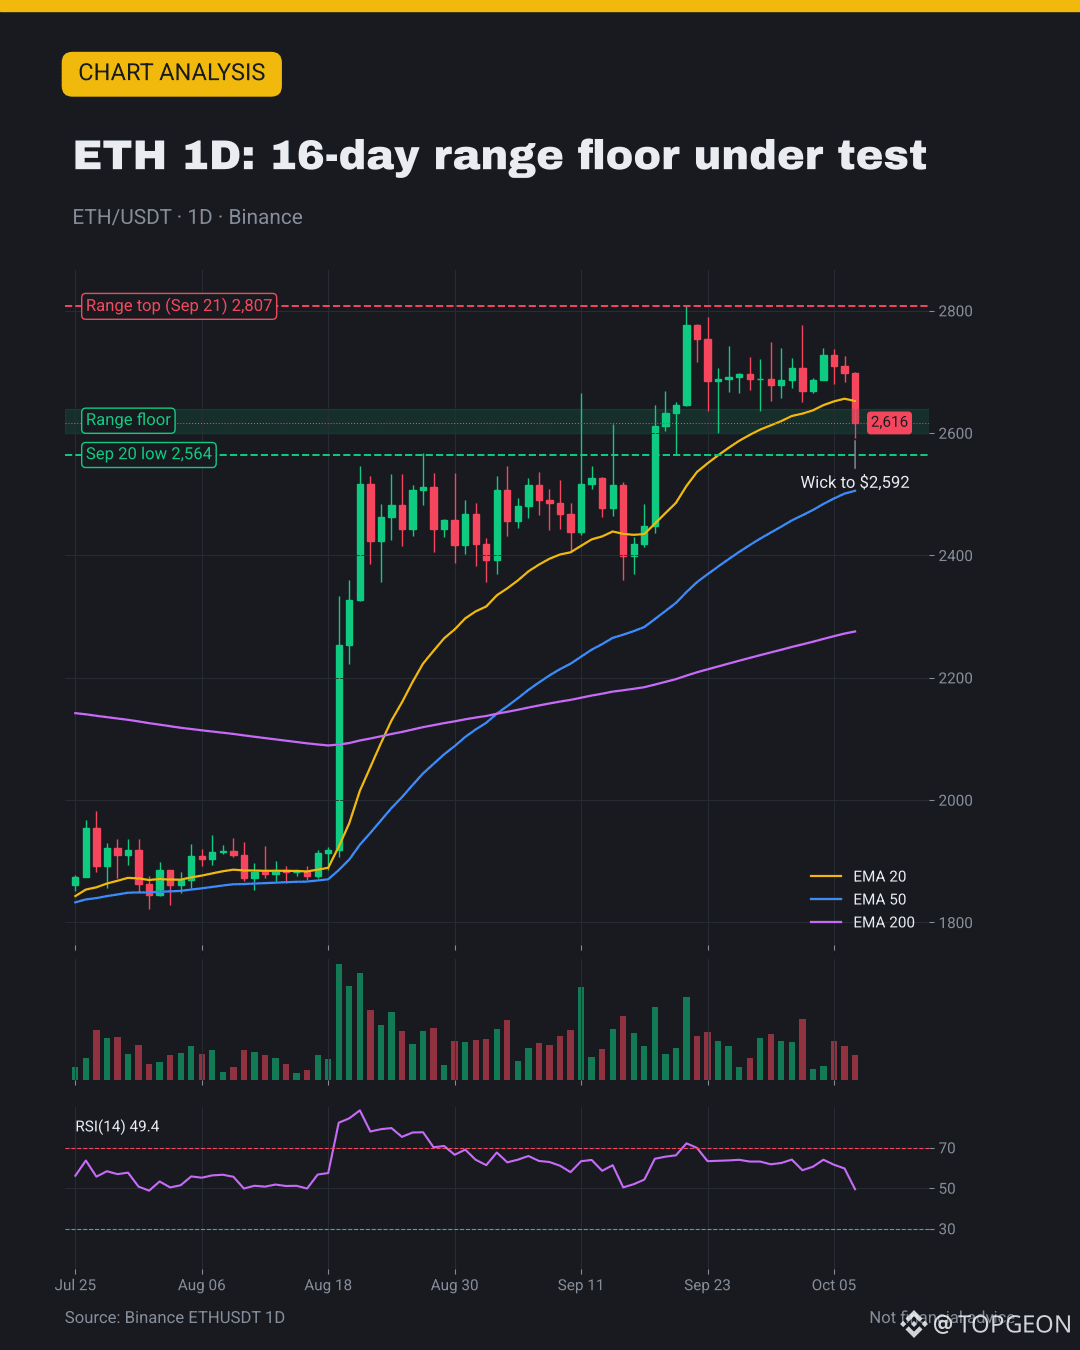
✅ The $2,600-2,640 floor held on Sep 24 and Sep 28
✅ 4H RSI 31: close to oversold after the flush
⚠️ Wicked to $2,592, the first sub-$2,600 print since Sep 20
⚠️ Now $2,616, under the daily 20 EMA ($2,652)
🎯 My take: back over $2,652 keeps the range; daily close <$2,592 opens $2,564, then $2,505
💬 Range holds or breaks by the weekend? 👇
#ETH #Ethereum #TechnicalAnalysis
❓ Is $ETH about to lose its 16-day range?
✅ The $2,600-2,640 floor held on Sep 24 and Sep 28
✅ 4H RSI 31: close to oversold after the flush
⚠️ Wicked to $2,592, the first sub-$2,600 print since Sep 20
⚠️ Now $2,616, under the daily 20 EMA ($2,652)
🎯 My take: back over $2,652 keeps the range; daily close <$2,592 opens $2,564, then $2,505
💬 Range holds or breaks by the weekend? 👇
#ETH #Ethereum #TechnicalAnalysis
✅ The $2,600-2,640 floor held on Sep 24 and Sep 28
✅ 4H RSI 31: close to oversold after the flush
⚠️ Wicked to $2,592, the first sub-$2,600 print since Sep 20
⚠️ Now $2,616, under the daily 20 EMA ($2,652)
🎯 My take: back over $2,652 keeps the range; daily close <$2,592 opens $2,564, then $2,505
💬 Range holds or breaks by the weekend? 👇
#ETH #Ethereum #TechnicalAnalysis
12
·
--
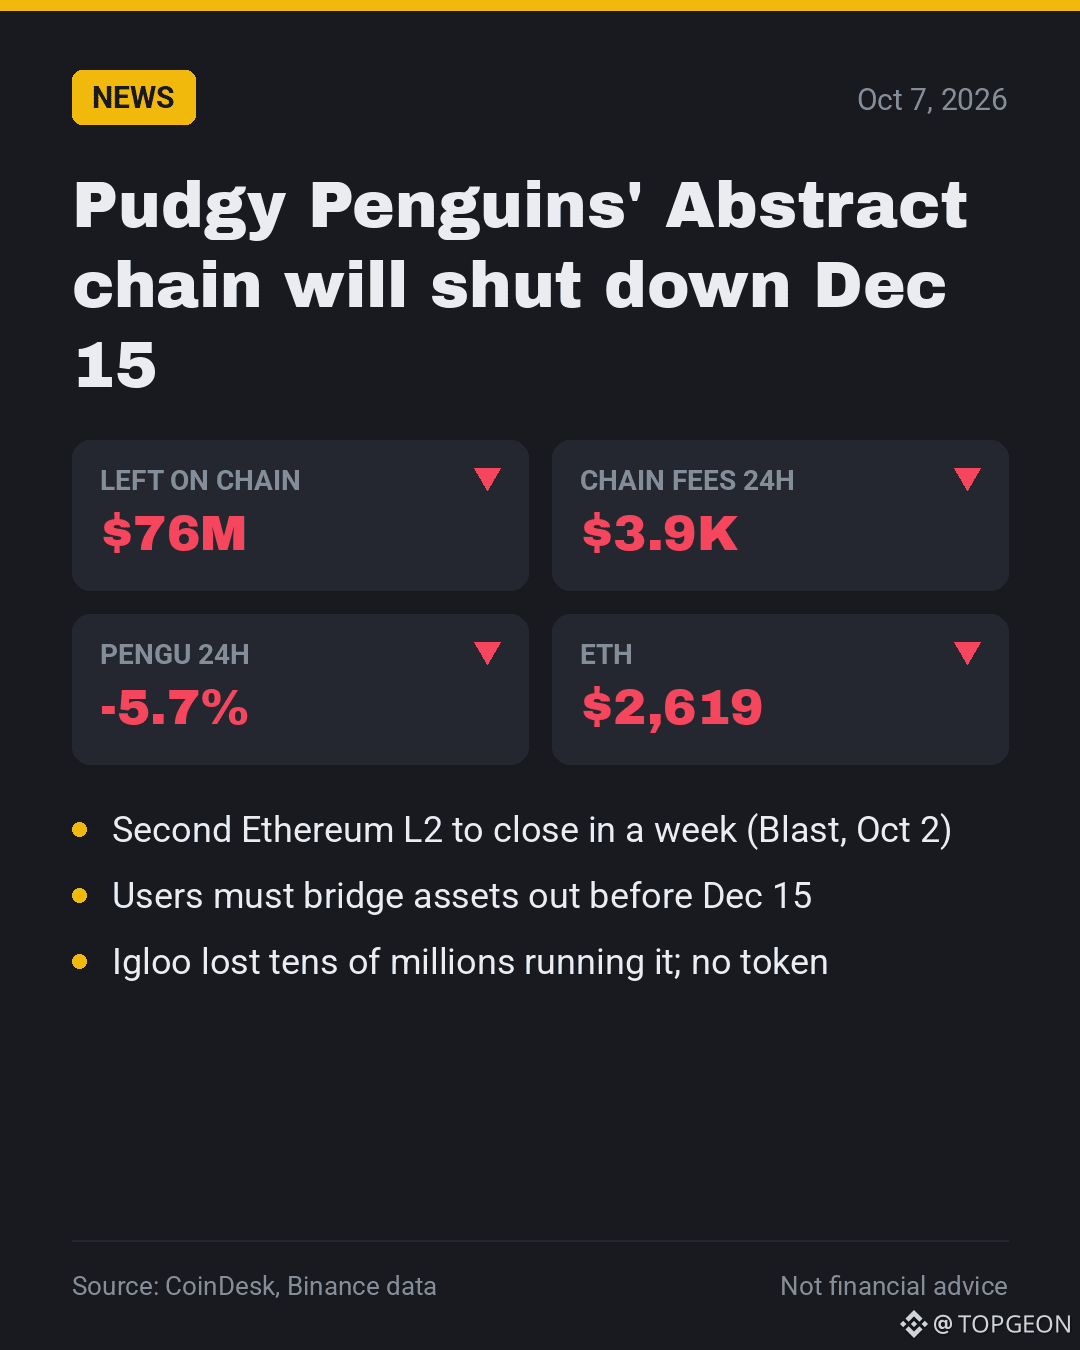
🐧 $PENGU team is shutting its Abstract chain on Dec 15
1️⃣ 2nd Ethereum L2 to quit in a week, after Blast (Oct 2)
2️⃣ $76M still on it: bridge out before the deadline
3️⃣ Just $3.9K in chain fees in 24h, no token launched
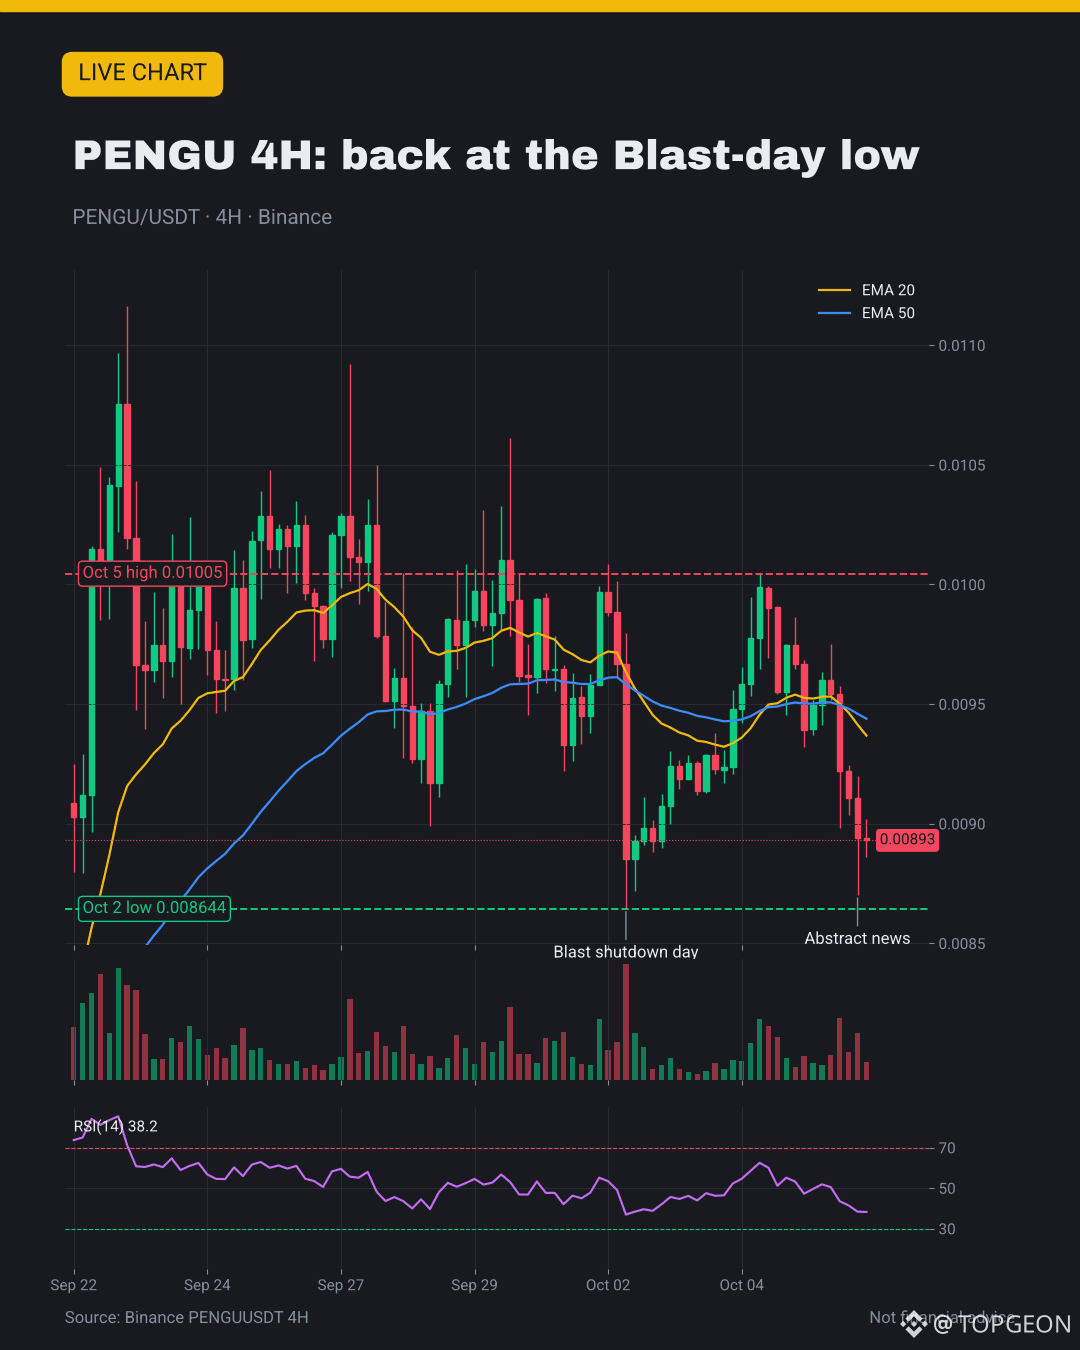
📊 PENGU $0.00891, -5.7%, 4H RSI 38, under both EMAs
🎯 My take: $0.00864 Oct 2 low is the line; reclaim $0.0094 to cool it
💬 Are small L2s running out of road? 👇
#PENGU #Layer2 #Ethereum
🐧 $PENGU team is shutting its Abstract chain on Dec 15
1️⃣ 2nd Ethereum L2 to quit in a week, after Blast (Oct 2)
2️⃣ $76M still on it: bridge out before the deadline
3️⃣ Just $3.9K in chain fees in 24h, no token launched
📊 PENGU $0.00891, -5.7%, 4H RSI 38, under both EMAs
🎯 My take: $0.00864 Oct 2 low is the line; reclaim $0.0094 to cool it
💬 Are small L2s running out of road? 👇
#PENGU #Layer2 #Ethereum
1️⃣ 2nd Ethereum L2 to quit in a week, after Blast (Oct 2)
2️⃣ $76M still on it: bridge out before the deadline
3️⃣ Just $3.9K in chain fees in 24h, no token launched
📊 PENGU $0.00891, -5.7%, 4H RSI 38, under both EMAs
🎯 My take: $0.00864 Oct 2 low is the line; reclaim $0.0094 to cool it
💬 Are small L2s running out of road? 👇
#PENGU #Layer2 #Ethereum
118
·
--
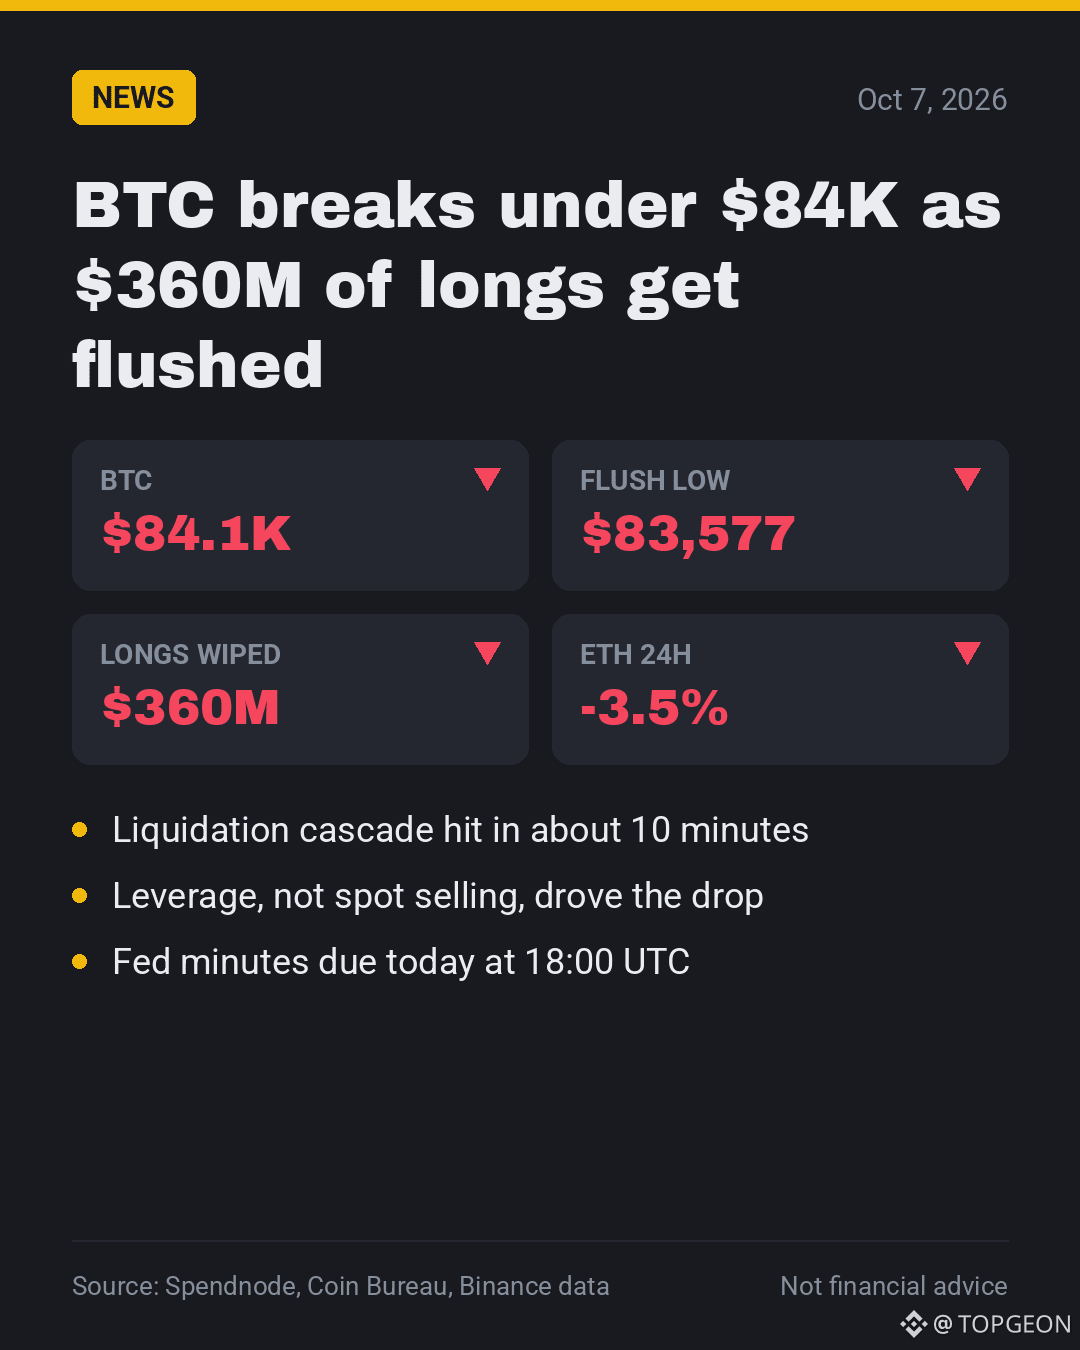
🚨 $BTC loses $84K: $360M of longs wiped in 10 minutes
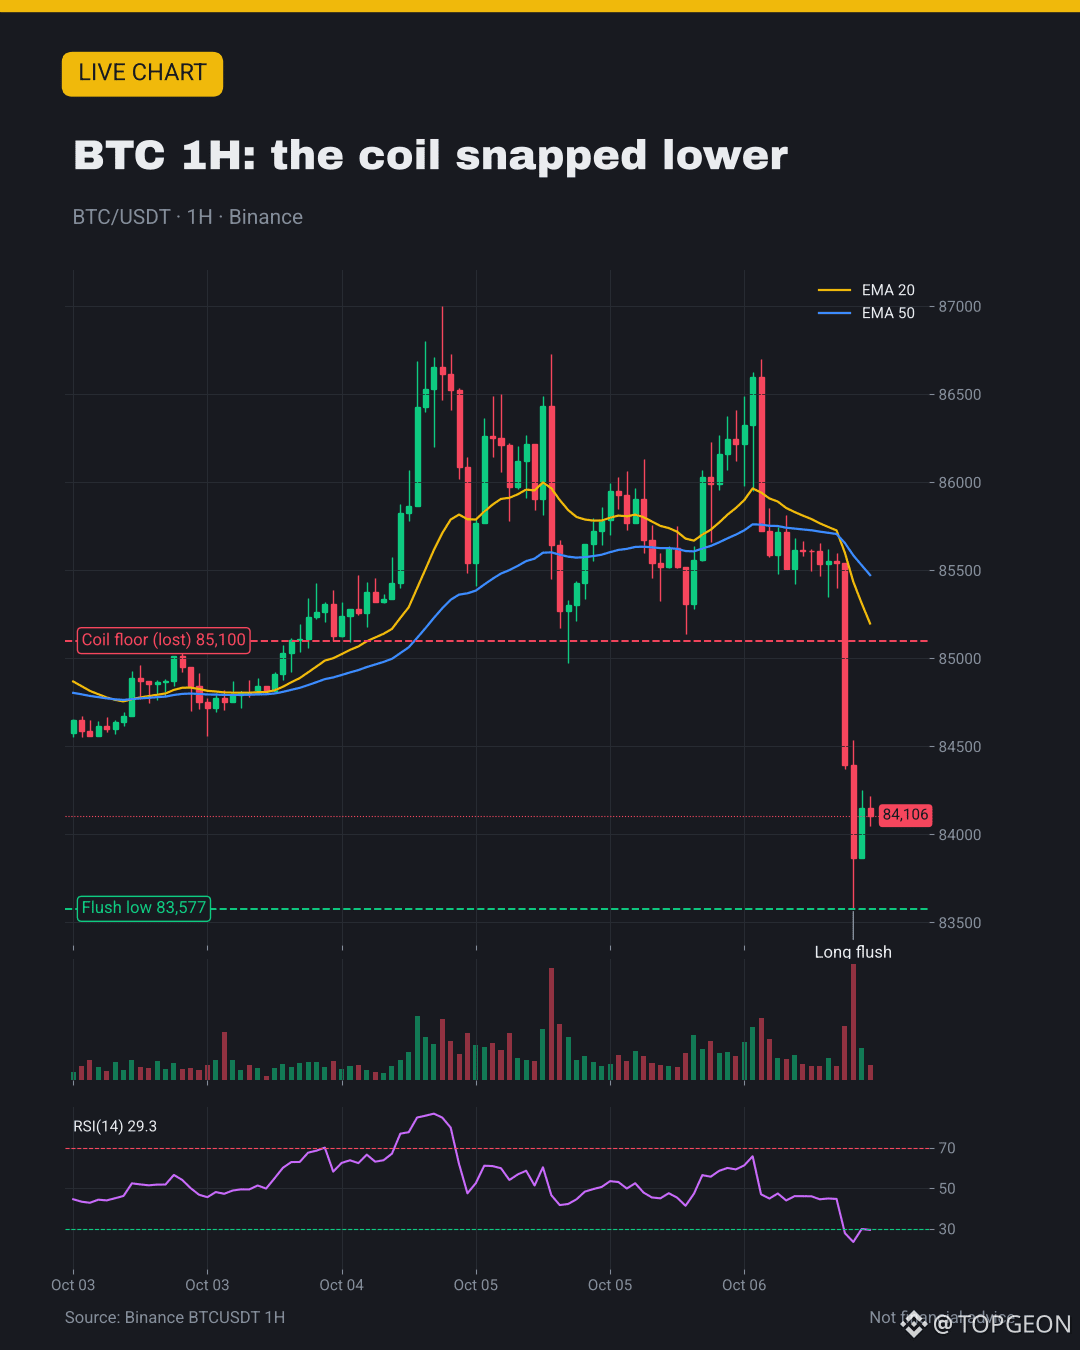
• Low $83,577, now ~$84.1K (-1.7% on the day)
• The $85.1K coil floor broke in one 1H candle
• $ETH -3.5% to $2,606, under $2,600 at the low
• 1H RSI 29: oversold after the flush
🎯 My take: back over $85.1K = fakeout; lose $83.5K → $82K
💬 Buying this flush or waiting for the Fed minutes? 👇
#Bitcoin #Liquidations #CryptoMarket
🚨 $BTC loses $84K: $360M of longs wiped in 10 minutes
• Low $83,577, now ~$84.1K (-1.7% on the day)
• The $85.1K coil floor broke in one 1H candle
• $ETH -3.5% to $2,606, under $2,600 at the low
• 1H RSI 29: oversold after the flush
🎯 My take: back over $85.1K = fakeout; lose $83.5K → $82K
💬 Buying this flush or waiting for the Fed minutes? 👇
#Bitcoin #Liquidations #CryptoMarket
• Low $83,577, now ~$84.1K (-1.7% on the day)
• The $85.1K coil floor broke in one 1H candle
• $ETH -3.5% to $2,606, under $2,600 at the low
• 1H RSI 29: oversold after the flush
🎯 My take: back over $85.1K = fakeout; lose $83.5K → $82K
💬 Buying this flush or waiting for the Fed minutes? 👇
#Bitcoin #Liquidations #CryptoMarket
45
·
--
GM ☀️
$BTC just got brutally flushed to $83.6K after a fake breakout to $86.7K.
Over $480M in longs were liquidated in the last 24 hours.
Bulls got trapped.
Meanwhile, our community caught the short yesterday during the live session. 🔥
Did you make a profit on this move? 👇
GM ☀️
$BTC just got brutally flushed to $83.6K after a fake breakout to $86.7K.
Over $480M in longs were liquidated in the last 24 hours.
Bulls got trapped.
Meanwhile, our community caught the short yesterday during the live session. 🔥
Did you make a profit on this move? 👇
$BTC just got brutally flushed to $83.6K after a fake breakout to $86.7K.
Over $480M in longs were liquidated in the last 24 hours.
Bulls got trapped.
Meanwhile, our community caught the short yesterday during the live session. 🔥
Did you make a profit on this move? 👇
69
·
--
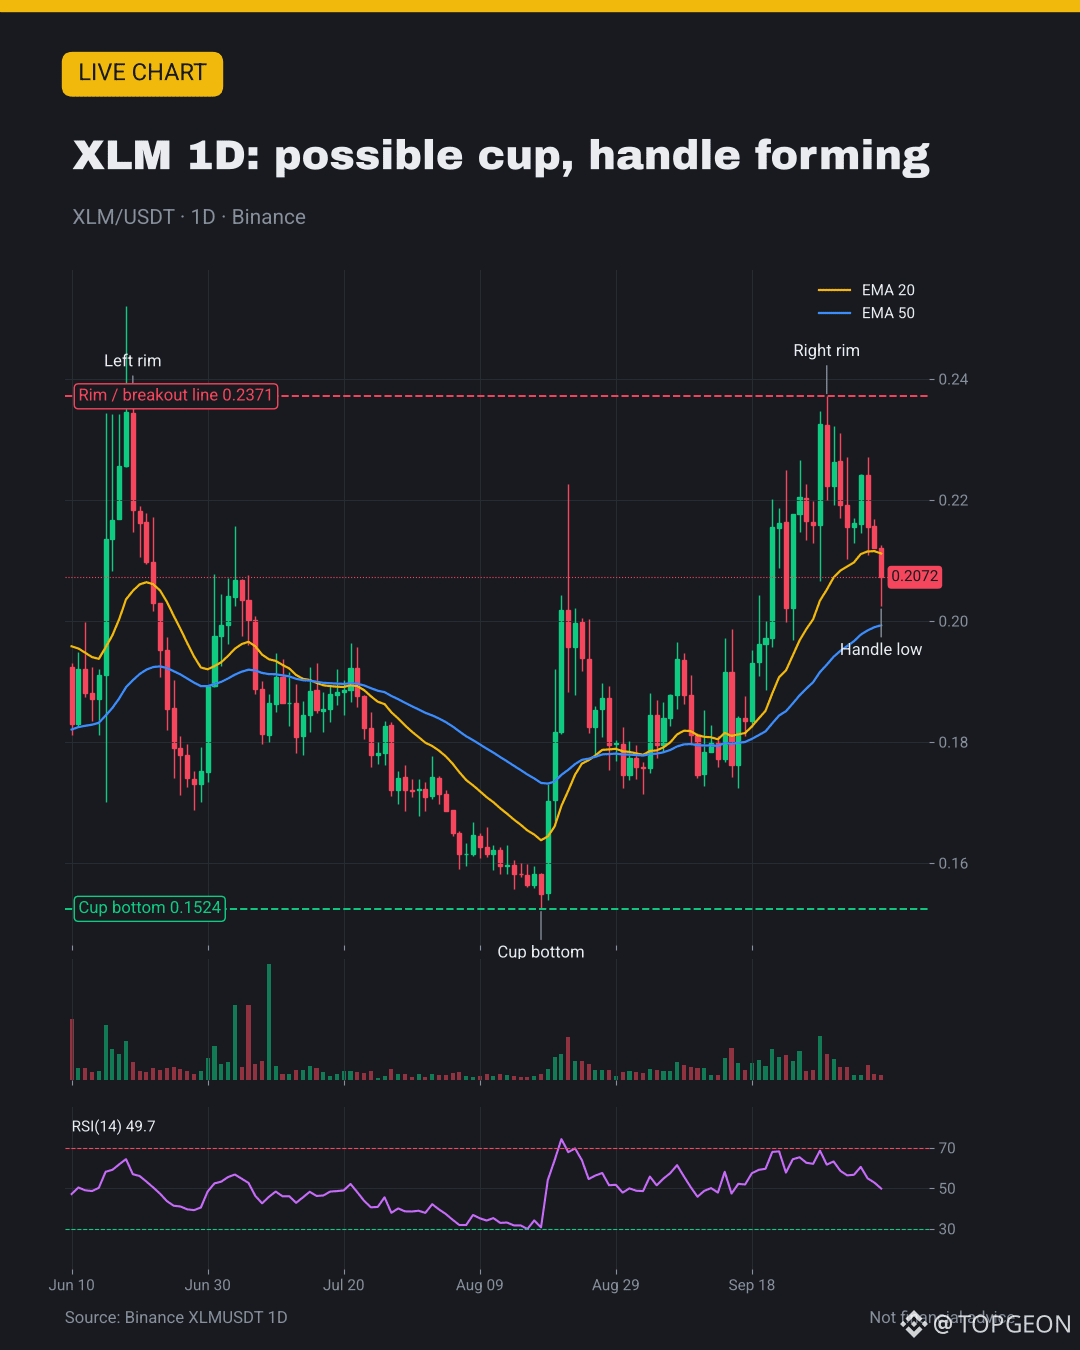
☕ Is $XLM pouring a cup & handle on the daily?
✅ Round cup: $0.2371 rim, $0.1524 bottom (Aug 18)
✅ Right rim matched the June highs on Sept 29
✅ Handle volume dried up: ~$71M → under $25M/day
⚠️ Handle dip -15% to $0.2024, a bit deep
⚠️ Lost the 20 EMA, now testing the 50 EMA (~$0.200)
🎯 My take: close over $0.2371 confirms, ~$0.32 target; under $0.195 = broken
💬 Breakout from here, or does the handle sink deeper? 👇
📖 Full lesson: https://app.binance.com/uni-qr/cart/374597235130849
#CupAndHandle #ChartPatterns #XLM
☕ Is $XLM pouring a cup & handle on the daily?
✅ Round cup: $0.2371 rim, $0.1524 bottom (Aug 18)
✅ Right rim matched the June highs on Sept 29
✅ Handle volume dried up: ~$71M → under $25M/day
⚠️ Handle dip -15% to $0.2024, a bit deep
⚠️ Lost the 20 EMA, now testing the 50 EMA (~$0.200)
🎯 My take: close over $0.2371 confirms, ~$0.32 target; under $0.195 = broken
💬 Breakout from here, or does the handle sink deeper? 👇
📖 Full lesson: https://app.binance.com/uni-qr/cart/374597235130849
#CupAndHandle #ChartPatterns #XLM
✅ Round cup: $0.2371 rim, $0.1524 bottom (Aug 18)
✅ Right rim matched the June highs on Sept 29
✅ Handle volume dried up: ~$71M → under $25M/day
⚠️ Handle dip -15% to $0.2024, a bit deep
⚠️ Lost the 20 EMA, now testing the 50 EMA (~$0.200)
🎯 My take: close over $0.2371 confirms, ~$0.32 target; under $0.195 = broken
💬 Breakout from here, or does the handle sink deeper? 👇
📖 Full lesson: https://app.binance.com/uni-qr/cart/374597235130849
#CupAndHandle #ChartPatterns #XLM
104
·
--
Article
Cup & Handle Pattern: Explained Simply📘 What is a Cup & Handle?
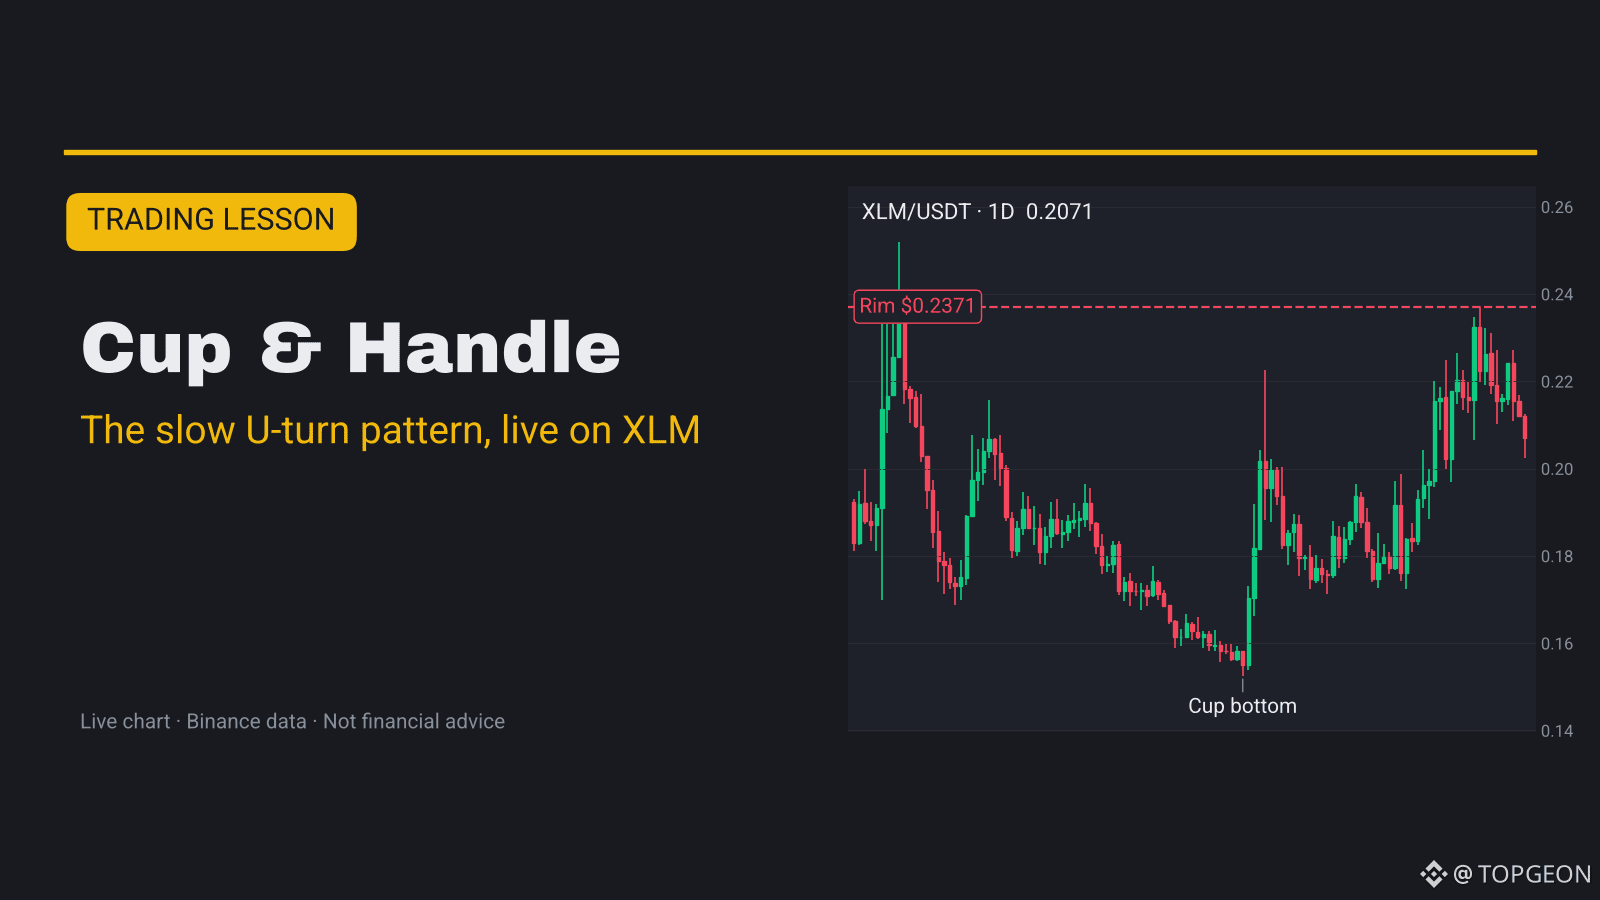
$XLM spent 3 months drawing a slow U on the daily chart, climbed back to its June high, and is now dipping again. That shape is today's live lesson: the cup & handle.
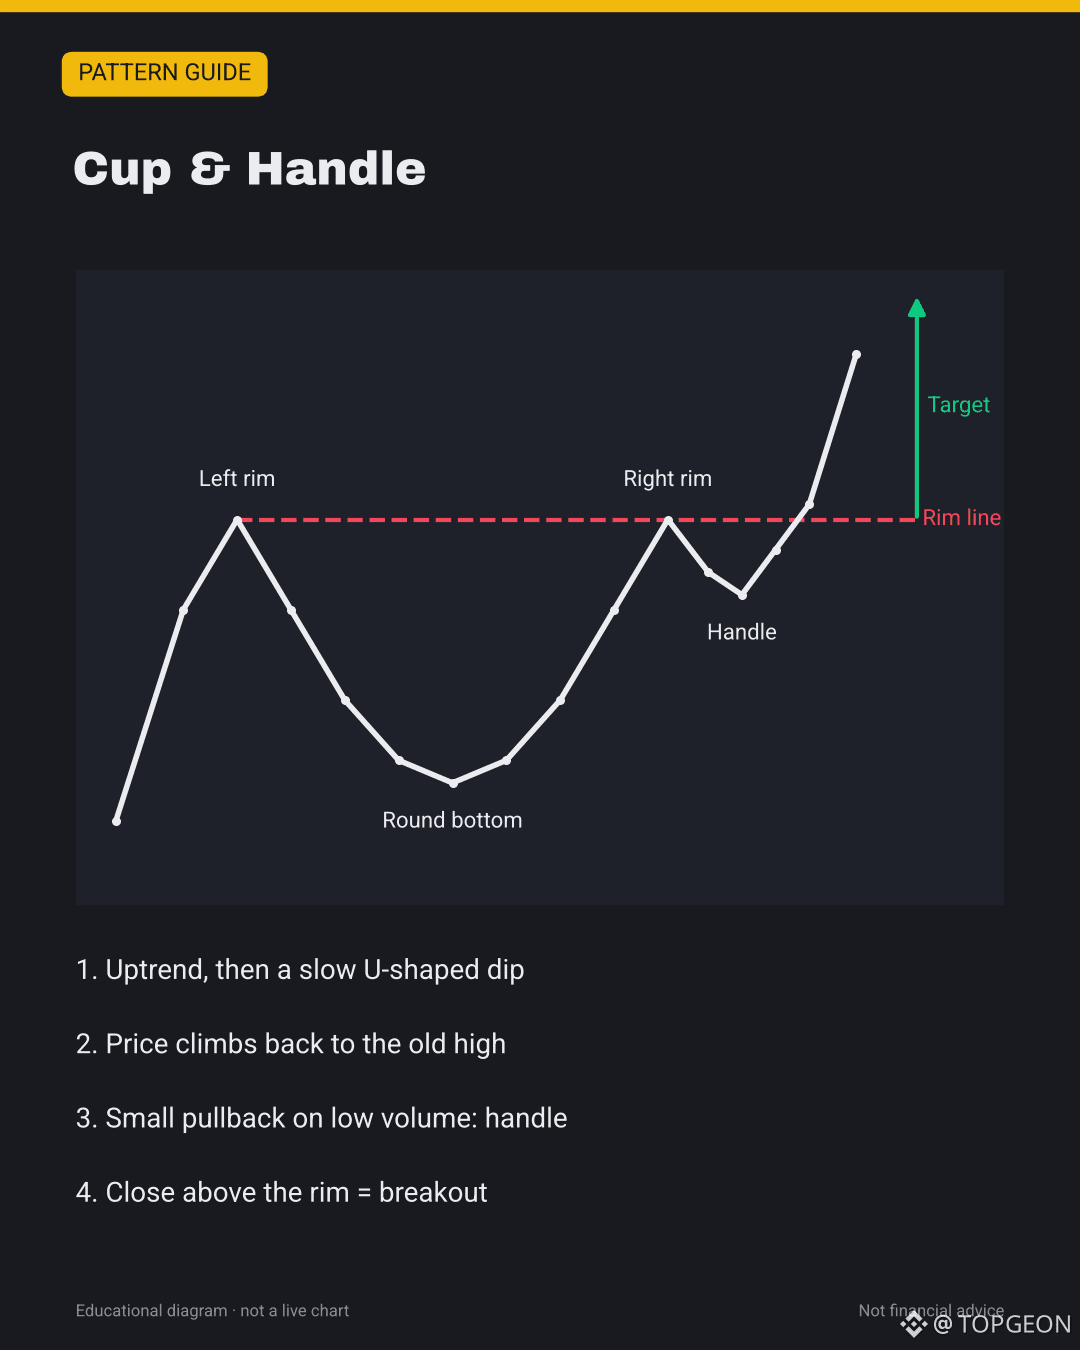
A cup & handle is a bullish continuation pattern. Price makes a high, sinks slowly into a rounded bottom (the cup), climbs back to the old high, then makes a small, quiet pullback (the handle). A close above the rim is the signal that buyers took control again.
📊 Live chart in the cover and in the image post below.
🔍 How to spot it
• Start with an uptrend before the pattern
• The cup is round like a U, not a sharp V. A slow bottom means sellers ran out of steam
• Both rims sit at roughly the same price
• The handle is a short pullback after the right rim, usually on lower volume
• The handle should stay in the top half of the cup. A deeper handle weakens the pattern
• Volume often rises on the right side of the cup and dries up in the handle
📈 How traders use it
• Entry: on a candle CLOSE above the rim line, ideally on rising volume
• Safer entry: wait for a retest of the rim from above
• Stop-loss: below the handle low. If the handle breaks, the setup is gone
• Target: measure the cup depth (rim minus bottom) and add it to the rim
🧪 Live example: $XLM daily, June – October 2026
The cup:
• Left rim: June 16–19 highs around $0.234–0.235 (a wick even tagged $0.252 on June 18)
• Slow slide through July and early August
• Cup bottom: $0.1524 on Aug 18
• Right rim: $0.2371 on Sept 29, almost exactly the old highs
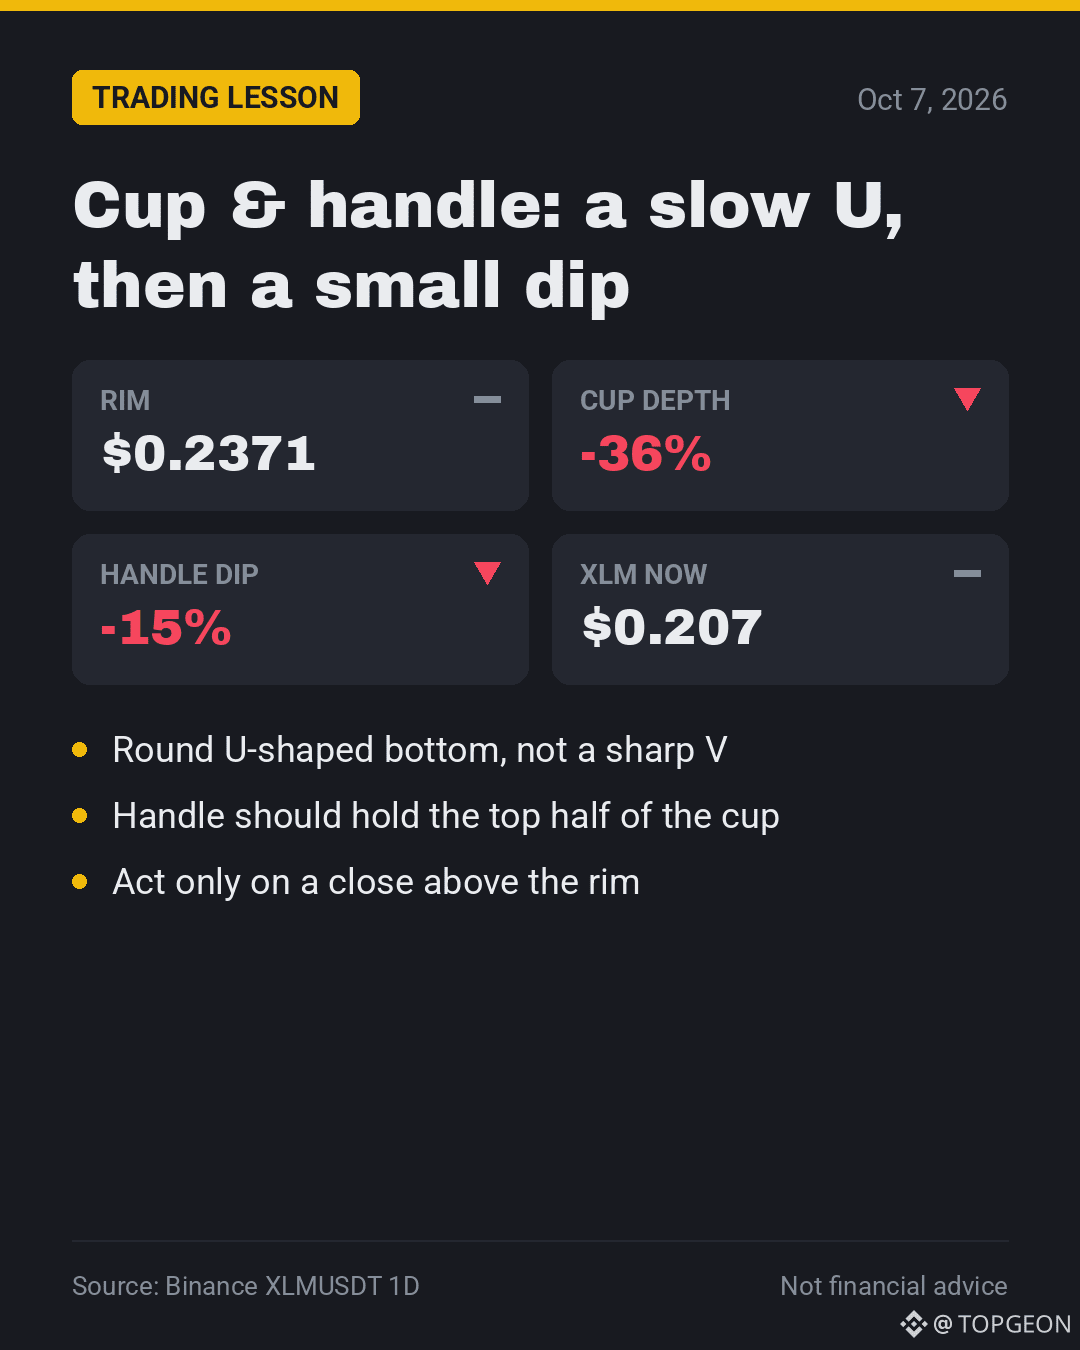
Cup depth = $0.2371 − $0.1524 = about $0.085, or 36% below the rim.
The handle (now):
• Pullback from $0.2371 to a low of $0.2024 today, about −15%
• That is 41% of the cup depth. Still in the top half (the cup midpoint is ~$0.195), but on the deep side
• Daily volume fell from about $71M on Sept 28 to under $25M a day in October. Quiet handles are what you want to see
Right now XLM trades near $0.207. Daily RSI(14) is about 50, neutral. Price just slipped under the 20 EMA ($0.210) and is testing the 50 EMA (~$0.200).
What it means: this is a candidate, NOT a confirmed pattern. A daily close above $0.2371 would confirm it. The measured target would then be about $0.237 + $0.085 = ~$0.32. If the handle loses ~$0.195 (half the cup), the pattern is broken.
For comparison, $BTC is not in a cup now. It was rejected near $87K four times and slid to $83,577 today. No rounded base, no handle.
⚠️ Common mistakes
• Calling a sharp V-bounce a cup. The bottom must be rounded
• Buying inside the handle before the breakout. Many handles keep falling
• Ignoring a handle that drops below half the cup
• Using the target as a promise. It is only a measured guide
✅ Quick checklist
• Uptrend before the pattern?
• Round U-shaped bottom, rims at similar prices?
• Handle shallow (top half of the cup) and on lower volume?
• Daily close above the rim?
• Stop below the handle, target = cup depth added to the rim?
💬 Have you ever caught a cup & handle breakout? Did it reach the target? 👇
Not financial advice. DYOR.
#TradingTips #CupAndHandle #XLM
Cup & Handle Pattern: Explained Simply
📘 What is a Cup & Handle?
$XLM spent 3 months drawing a slow U on the daily chart, climbed back to its June high, and is now dipping again. That shape is today's live lesson: the cup & handle.
A cup & handle is a bullish continuation pattern. Price makes a high, sinks slowly into a rounded bottom (the cup), climbs back to the old high, then makes a small, quiet pullback (the handle). A close above the rim is the signal that buyers took control again.
📊 Live chart in the cover and in the image post below.
🔍 How to spot it
• Start with an uptrend before the pattern
• The cup is round like a U, not a sharp V. A slow bottom means sellers ran out of steam
• Both rims sit at roughly the same price
• The handle is a short pullback after the right rim, usually on lower volume
• The handle should stay in the top half of the cup. A deeper handle weakens the pattern
• Volume often rises on the right side of the cup and dries up in the handle
📈 How traders use it
• Entry: on a candle CLOSE above the rim line, ideally on rising volume
• Safer entry: wait for a retest of the rim from above
• Stop-loss: below the handle low. If the handle breaks, the setup is gone
• Target: measure the cup depth (rim minus bottom) and add it to the rim
🧪 Live example: $XLM daily, June – October 2026
The cup:
• Left rim: June 16–19 highs around $0.234–0.235 (a wick even tagged $0.252 on June 18)
• Slow slide through July and early August
• Cup bottom: $0.1524 on Aug 18
• Right rim: $0.2371 on Sept 29, almost exactly the old highs
Cup depth = $0.2371 − $0.1524 = about $0.085, or 36% below the rim.
The handle (now):
• Pullback from $0.2371 to a low of $0.2024 today, about −15%
• That is 41% of the cup depth. Still in the top half (the cup midpoint is ~$0.195), but on the deep side
• Daily volume fell from about $71M on Sept 28 to under $25M a day in October. Quiet handles are what you want to see
Right now XLM trades near $0.207. Daily RSI(14) is about 50, neutral. Price just slipped under the 20 EMA ($0.210) and is testing the 50 EMA (~$0.200).
What it means: this is a candidate, NOT a confirmed pattern. A daily close above $0.2371 would confirm it. The measured target would then be about $0.237 + $0.085 = ~$0.32. If the handle loses ~$0.195 (half the cup), the pattern is broken.
For comparison, $BTC is not in a cup now. It was rejected near $87K four times and slid to $83,577 today. No rounded base, no handle.
⚠️ Common mistakes
• Calling a sharp V-bounce a cup. The bottom must be rounded
• Buying inside the handle before the breakout. Many handles keep falling
• Ignoring a handle that drops below half the cup
• Using the target as a promise. It is only a measured guide
✅ Quick checklist
• Uptrend before the pattern?
• Round U-shaped bottom, rims at similar prices?
• Handle shallow (top half of the cup) and on lower volume?
• Daily close above the rim?
• Stop below the handle, target = cup depth added to the rim?
💬 Have you ever caught a cup & handle breakout? Did it reach the target? 👇
Not financial advice. DYOR.
#TradingTips #CupAndHandle #XLM
$XLM spent 3 months drawing a slow U on the daily chart, climbed back to its June high, and is now dipping again. That shape is today's live lesson: the cup & handle.
A cup & handle is a bullish continuation pattern. Price makes a high, sinks slowly into a rounded bottom (the cup), climbs back to the old high, then makes a small, quiet pullback (the handle). A close above the rim is the signal that buyers took control again.
📊 Live chart in the cover and in the image post below.
🔍 How to spot it
• Start with an uptrend before the pattern
• The cup is round like a U, not a sharp V. A slow bottom means sellers ran out of steam
• Both rims sit at roughly the same price
• The handle is a short pullback after the right rim, usually on lower volume
• The handle should stay in the top half of the cup. A deeper handle weakens the pattern
• Volume often rises on the right side of the cup and dries up in the handle
📈 How traders use it
• Entry: on a candle CLOSE above the rim line, ideally on rising volume
• Safer entry: wait for a retest of the rim from above
• Stop-loss: below the handle low. If the handle breaks, the setup is gone
• Target: measure the cup depth (rim minus bottom) and add it to the rim
🧪 Live example: $XLM daily, June – October 2026
The cup:
• Left rim: June 16–19 highs around $0.234–0.235 (a wick even tagged $0.252 on June 18)
• Slow slide through July and early August
• Cup bottom: $0.1524 on Aug 18
• Right rim: $0.2371 on Sept 29, almost exactly the old highs
Cup depth = $0.2371 − $0.1524 = about $0.085, or 36% below the rim.
The handle (now):
• Pullback from $0.2371 to a low of $0.2024 today, about −15%
• That is 41% of the cup depth. Still in the top half (the cup midpoint is ~$0.195), but on the deep side
• Daily volume fell from about $71M on Sept 28 to under $25M a day in October. Quiet handles are what you want to see
Right now XLM trades near $0.207. Daily RSI(14) is about 50, neutral. Price just slipped under the 20 EMA ($0.210) and is testing the 50 EMA (~$0.200).
What it means: this is a candidate, NOT a confirmed pattern. A daily close above $0.2371 would confirm it. The measured target would then be about $0.237 + $0.085 = ~$0.32. If the handle loses ~$0.195 (half the cup), the pattern is broken.
For comparison, $BTC is not in a cup now. It was rejected near $87K four times and slid to $83,577 today. No rounded base, no handle.
⚠️ Common mistakes
• Calling a sharp V-bounce a cup. The bottom must be rounded
• Buying inside the handle before the breakout. Many handles keep falling
• Ignoring a handle that drops below half the cup
• Using the target as a promise. It is only a measured guide
✅ Quick checklist
• Uptrend before the pattern?
• Round U-shaped bottom, rims at similar prices?
• Handle shallow (top half of the cup) and on lower volume?
• Daily close above the rim?
• Stop below the handle, target = cup depth added to the rim?
💬 Have you ever caught a cup & handle breakout? Did it reach the target? 👇
Not financial advice. DYOR.
#TradingTips #CupAndHandle #XLM
114
·
--
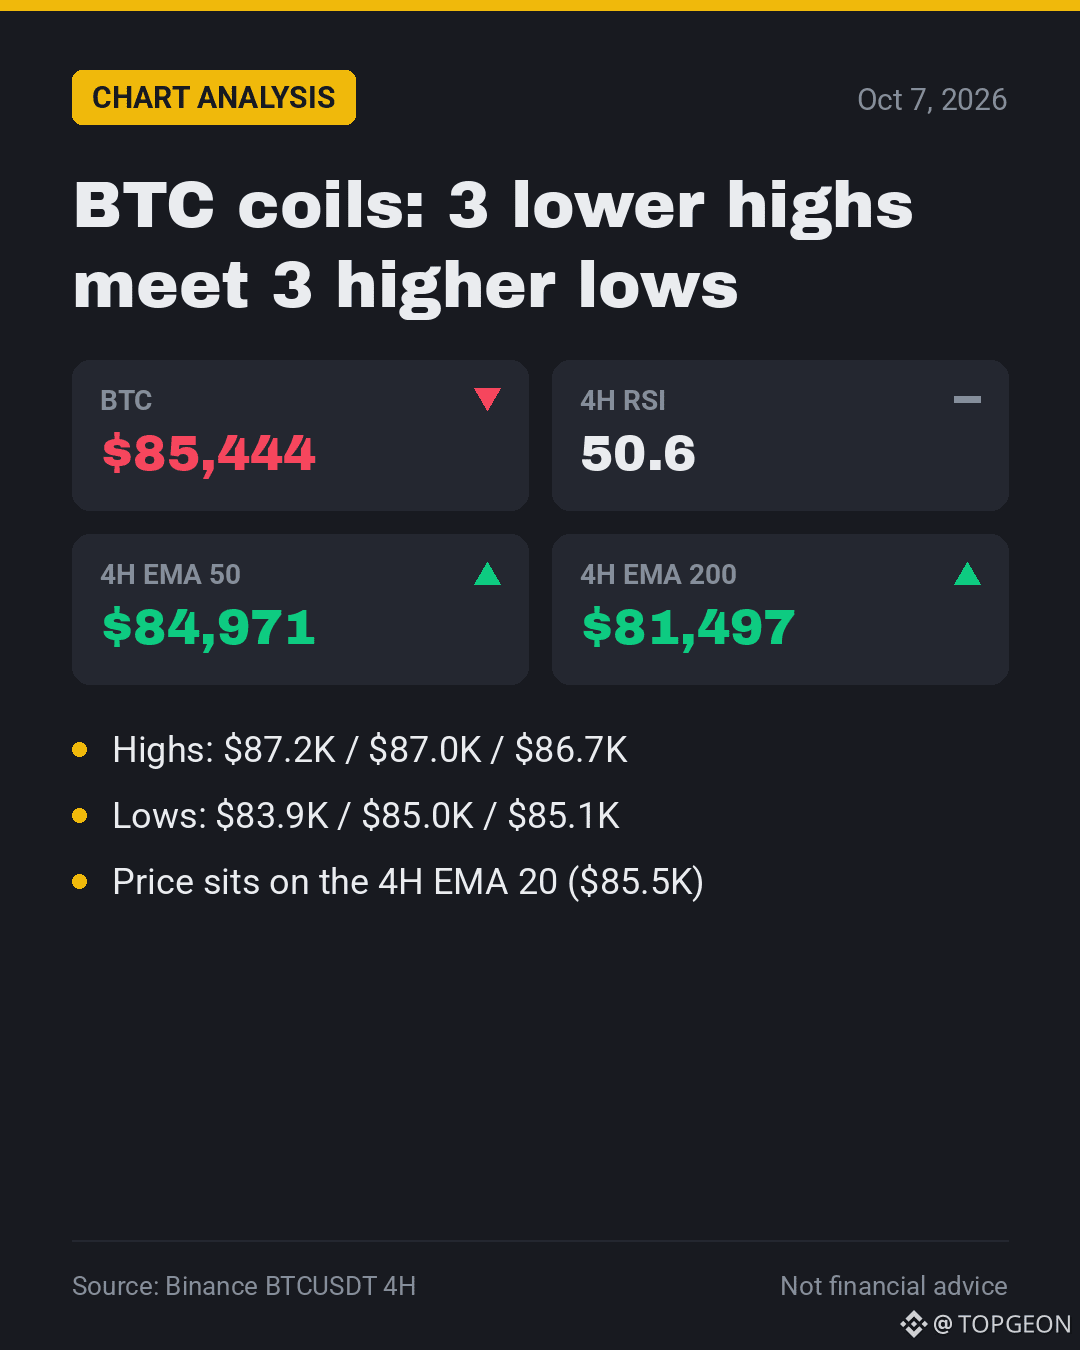
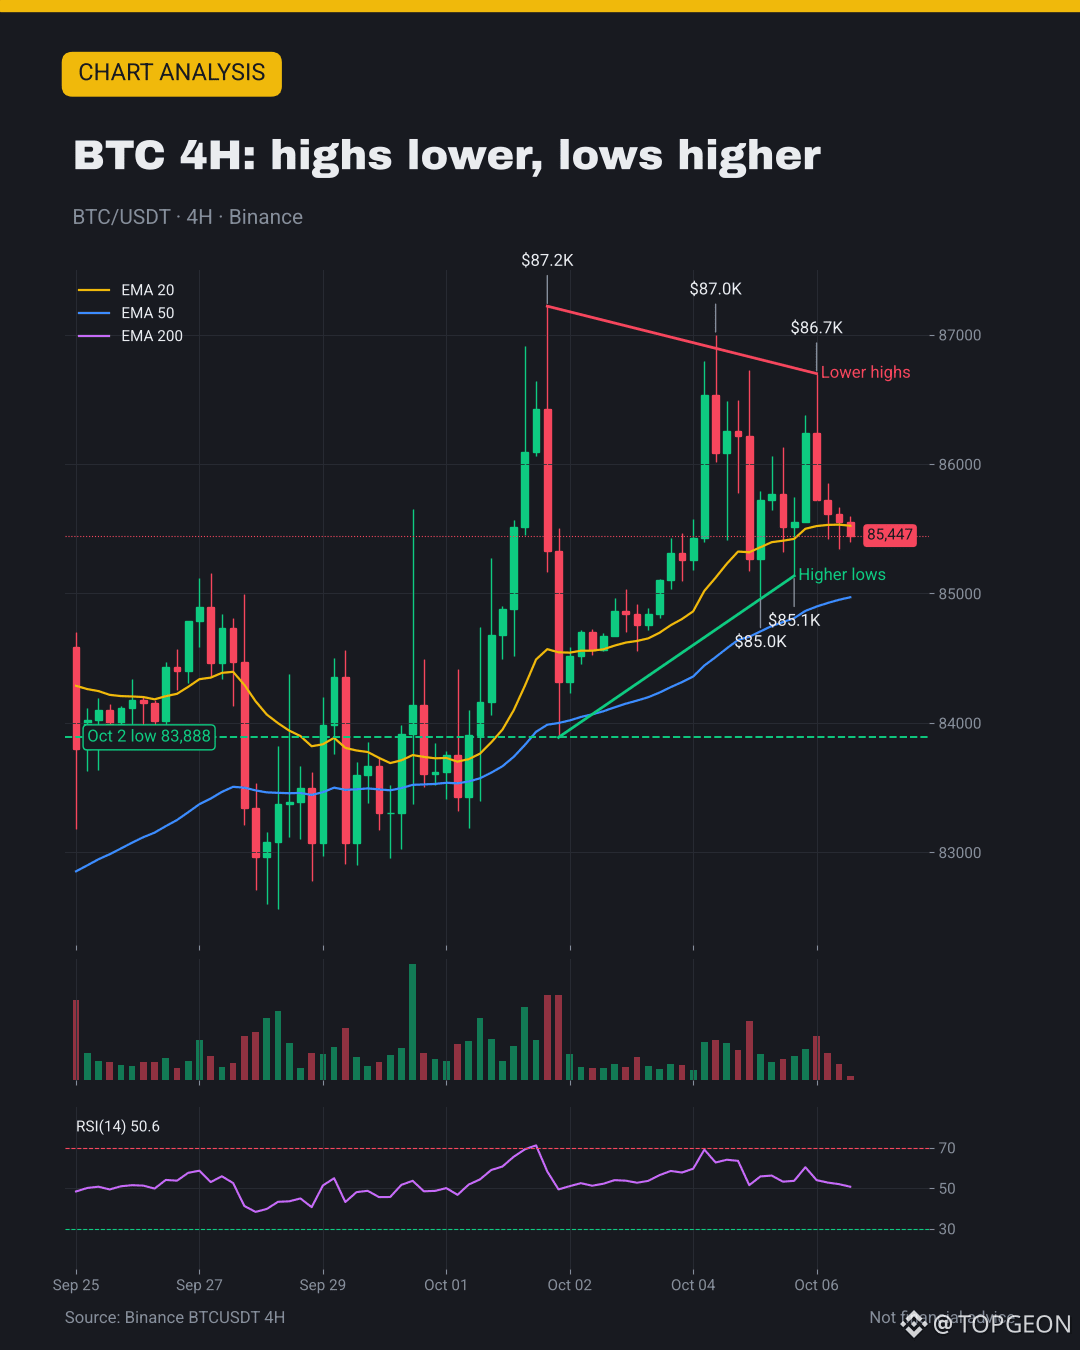
🗜️ $BTC is coiling: 3 numbers that frame the squeeze
1️⃣ Highs keep fading: $87.2K → $87.0K → $86.7K
2️⃣ Lows keep rising: $83.9K → $85.0K → $85.1K
3️⃣ $85.4K now, 4H RSI 50.6: nobody in control
📌 4H EMA 50 at $85.0K and EMA 200 at $81.5K still point up
🎯 My take: a 4H close over $86.7K targets $87.2K+; under $85.1K opens $83.9K
💬 Which side of this coil gives way first? 👇
#Bitcoin #BTC #TechnicalAnalysis
🗜️ $BTC is coiling: 3 numbers that frame the squeeze
1️⃣ Highs keep fading: $87.2K → $87.0K → $86.7K
2️⃣ Lows keep rising: $83.9K → $85.0K → $85.1K
3️⃣ $85.4K now, 4H RSI 50.6: nobody in control
📌 4H EMA 50 at $85.0K and EMA 200 at $81.5K still point up
🎯 My take: a 4H close over $86.7K targets $87.2K+; under $85.1K opens $83.9K
💬 Which side of this coil gives way first? 👇
#Bitcoin #BTC #TechnicalAnalysis
1️⃣ Highs keep fading: $87.2K → $87.0K → $86.7K
2️⃣ Lows keep rising: $83.9K → $85.0K → $85.1K
3️⃣ $85.4K now, 4H RSI 50.6: nobody in control
📌 4H EMA 50 at $85.0K and EMA 200 at $81.5K still point up
🎯 My take: a 4H close over $86.7K targets $87.2K+; under $85.1K opens $83.9K
💬 Which side of this coil gives way first? 👇
#Bitcoin #BTC #TechnicalAnalysis
108
·
--
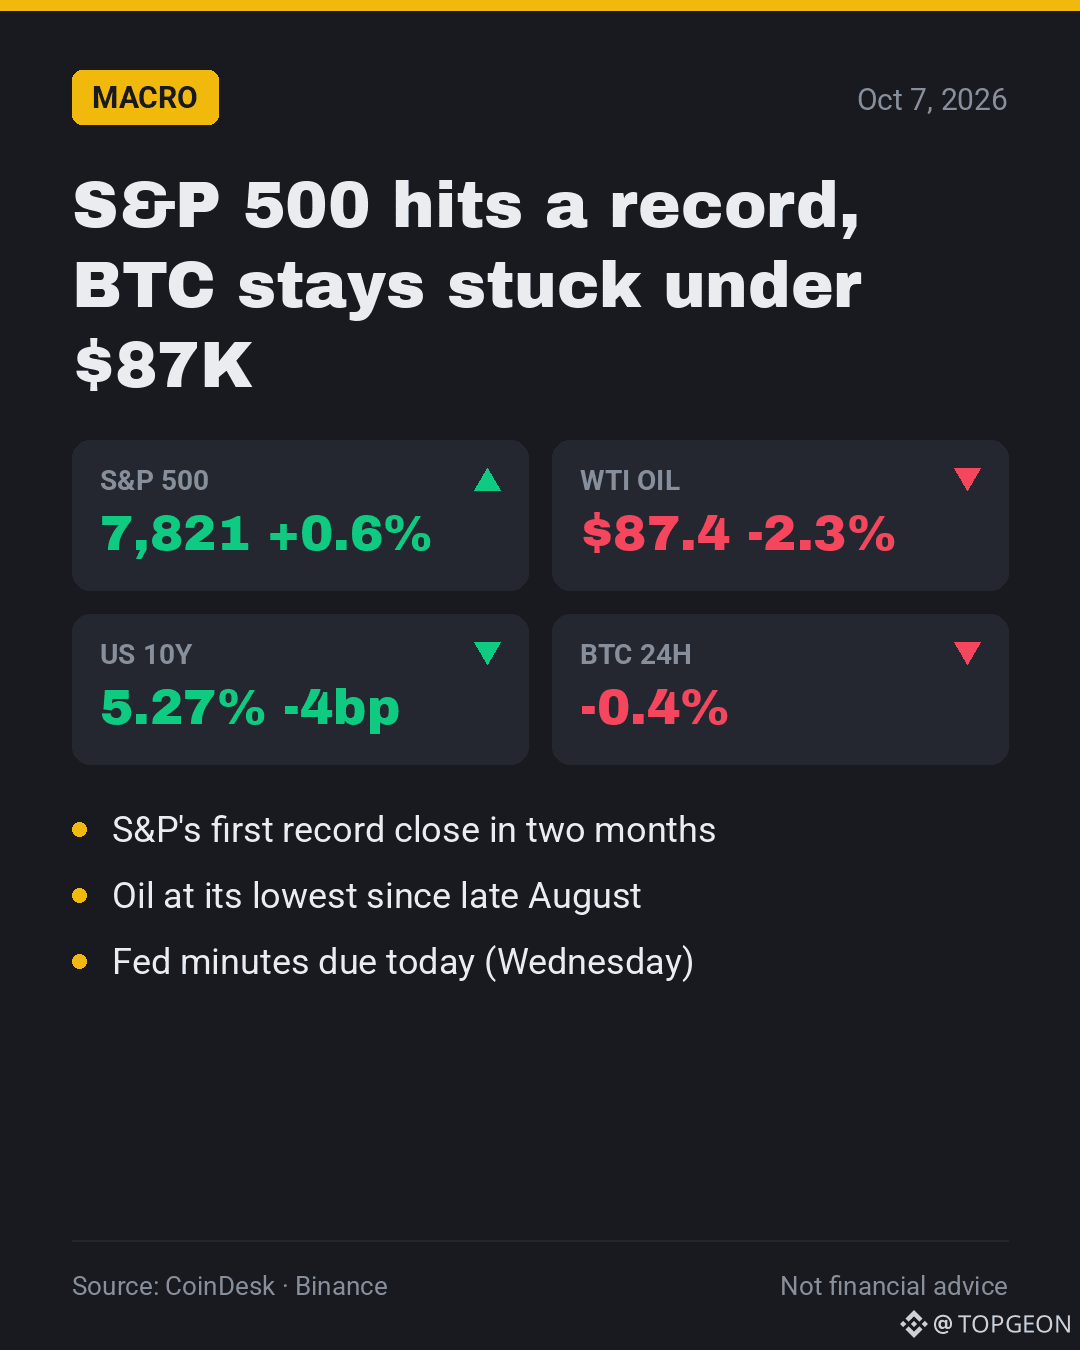
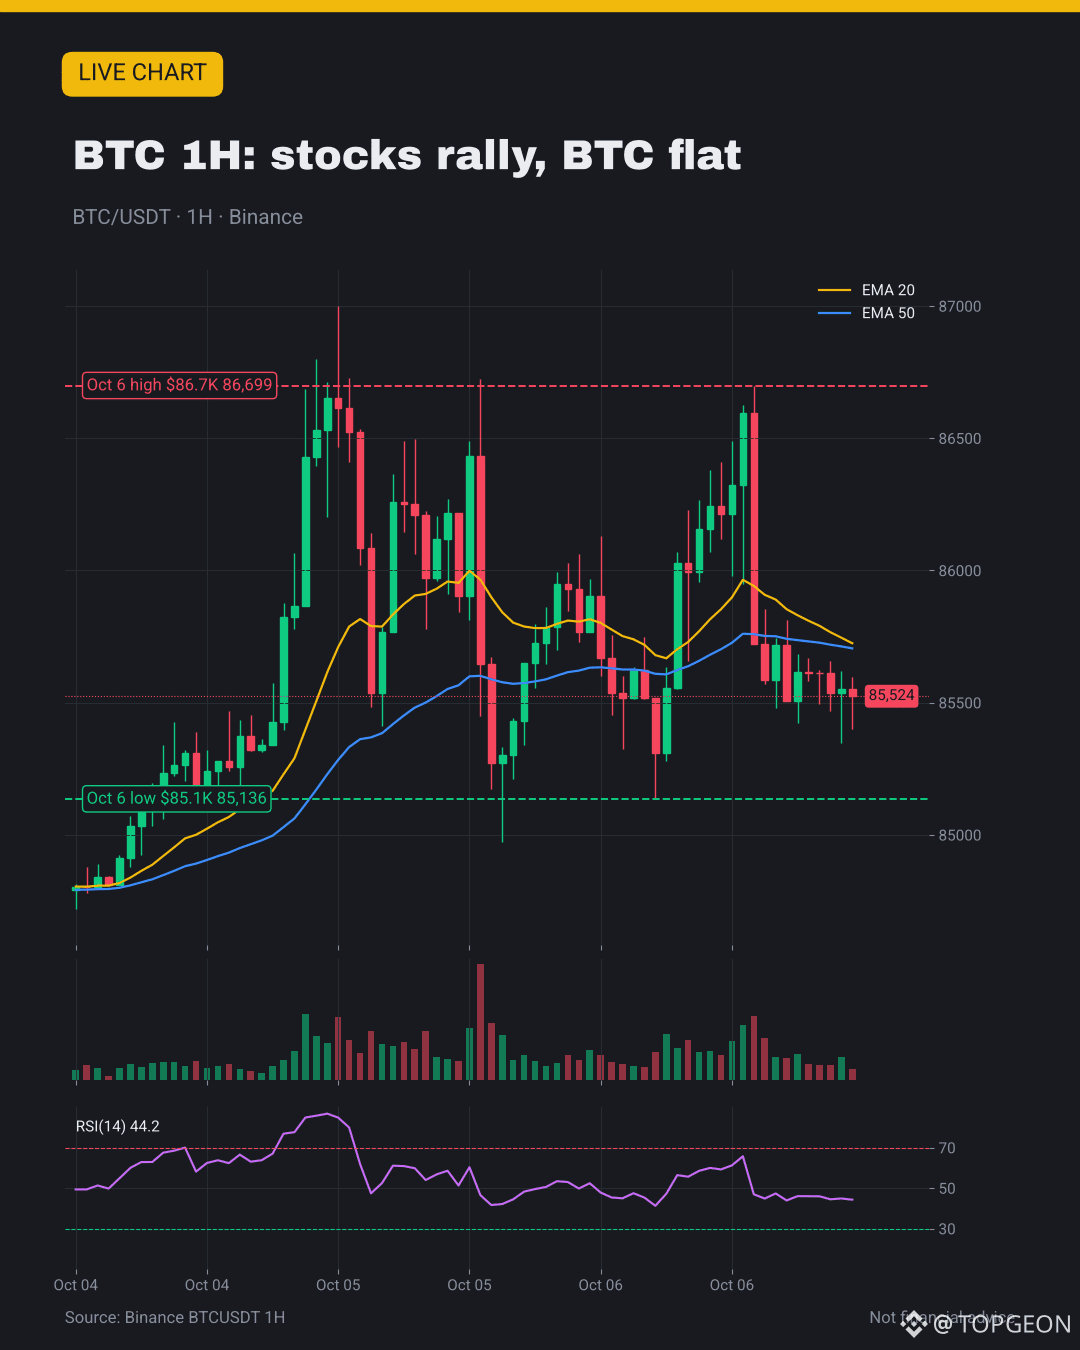
📈 S&P 500 sets a record at 7,821, $BTC stuck at $85.5K
• S&P +0.6%: first record close in two months
• WTI oil -2.3% to $87.4, lowest since late August
• US 10Y eases to 5.27%, gold near $4,200
• Fed minutes land today · Top gainer: $NMR +37%
🎯 My take: BTC still lags risk-on; $84K is the line, $87K the lid
💬 Can the Fed minutes push BTC out of this box today? 👇
#Macro #SP500 #Bitcoin
📈 S&P 500 sets a record at 7,821, $BTC stuck at $85.5K
• S&P +0.6%: first record close in two months
• WTI oil -2.3% to $87.4, lowest since late August
• US 10Y eases to 5.27%, gold near $4,200
• Fed minutes land today · Top gainer: $NMR +37%
🎯 My take: BTC still lags risk-on; $84K is the line, $87K the lid
💬 Can the Fed minutes push BTC out of this box today? 👇
#Macro #SP500 #Bitcoin
• S&P +0.6%: first record close in two months
• WTI oil -2.3% to $87.4, lowest since late August
• US 10Y eases to 5.27%, gold near $4,200
• Fed minutes land today · Top gainer: $NMR +37%
🎯 My take: BTC still lags risk-on; $84K is the line, $87K the lid
💬 Can the Fed minutes push BTC out of this box today? 👇
#Macro #SP500 #Bitcoin
1
265
·
--
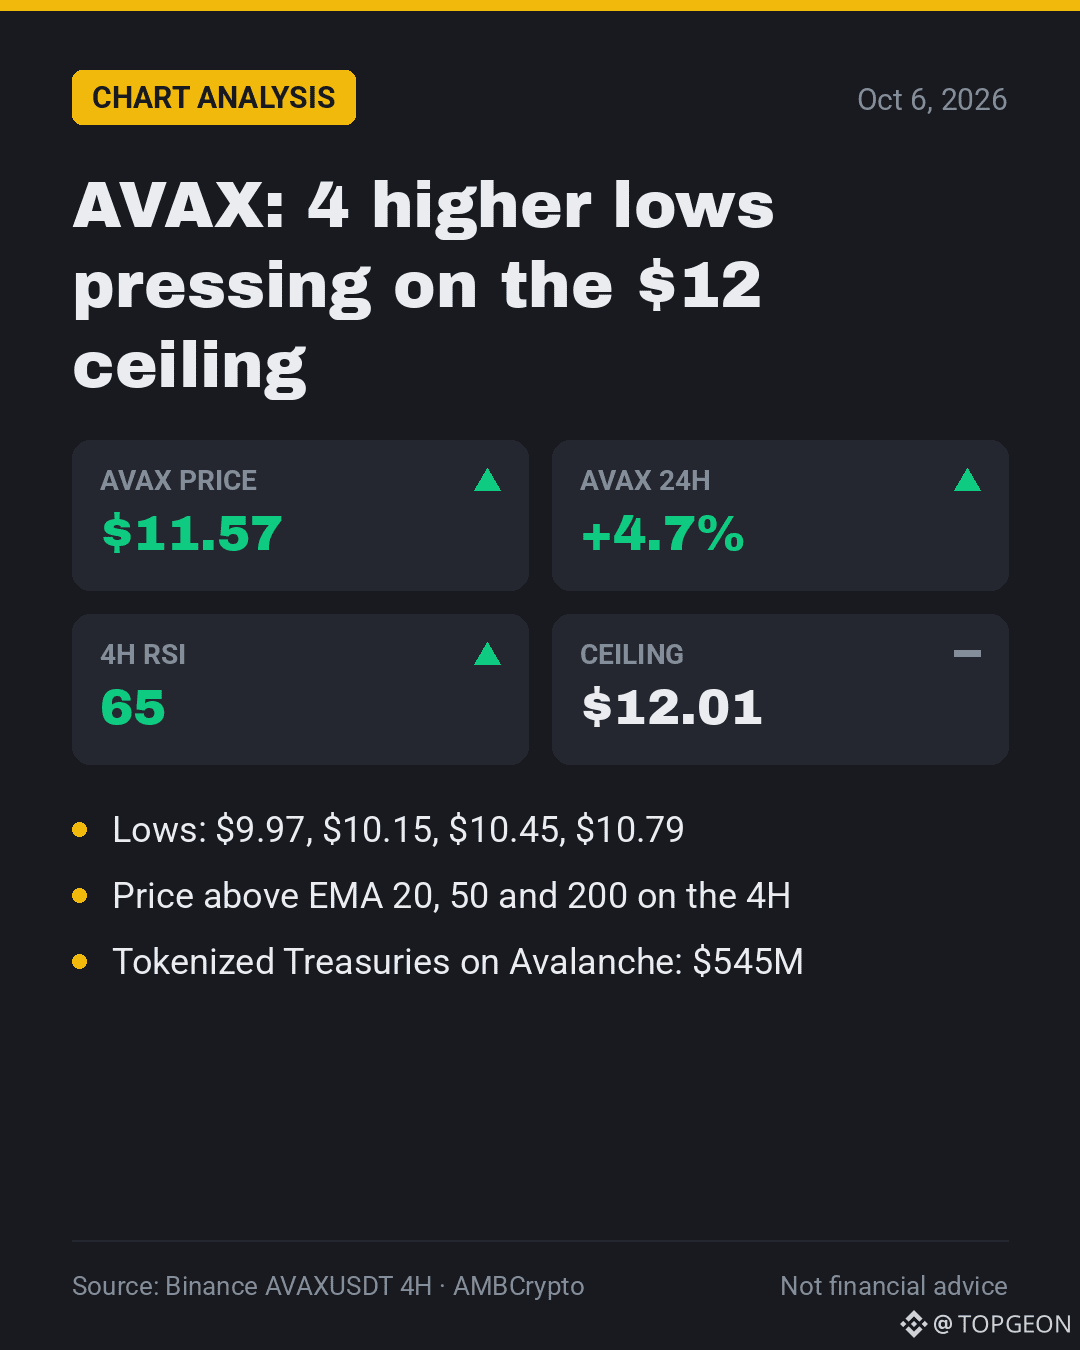
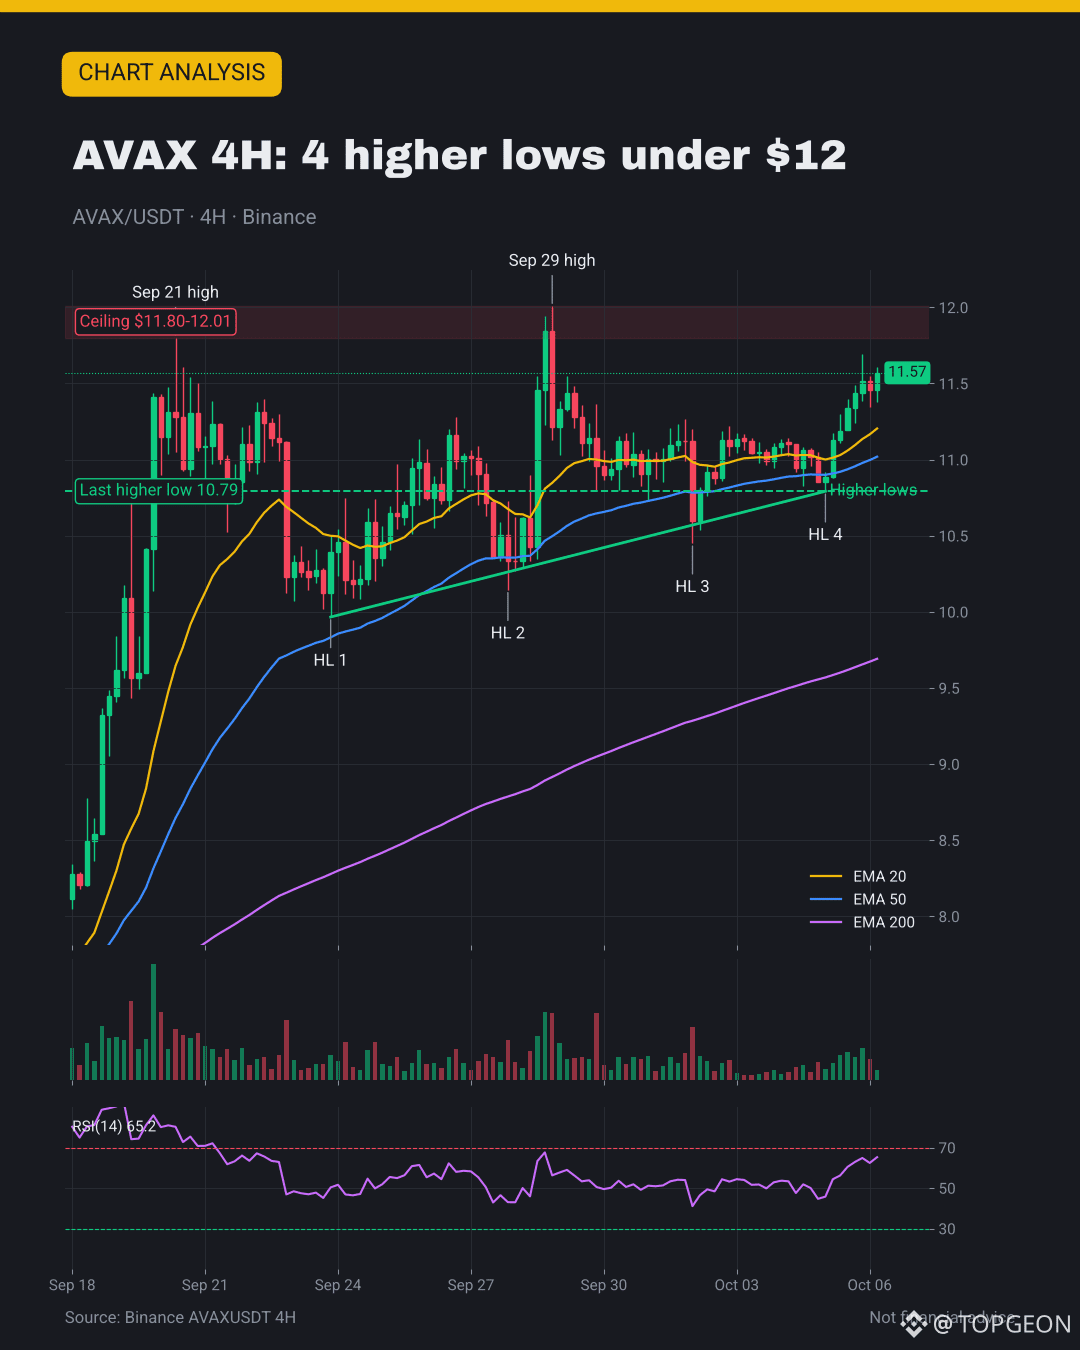
❓ Is $AVAX about to crack its $12 ceiling?
✅ 4 higher lows: $9.97, $10.15, $10.45, $10.79
✅ $11.57 (+4.7% 24h), above 4H EMA 20/50/200
✅ $545M in tokenized Treasuries now on Avalanche
⚠️ $11.80-12.01 rejected it on Sep 21 and Sep 29
⚠️ 4H RSI 65: room left, but close to hot
🎯 My take: a 4H close over $12.01 opens $13; losing $10.79 breaks the series
💬 Third try at $12: breakout or another rejection? 👇
#AVAX #Avalanche #Altcoins
❓ Is $AVAX about to crack its $12 ceiling?
✅ 4 higher lows: $9.97, $10.15, $10.45, $10.79
✅ $11.57 (+4.7% 24h), above 4H EMA 20/50/200
✅ $545M in tokenized Treasuries now on Avalanche
⚠️ $11.80-12.01 rejected it on Sep 21 and Sep 29
⚠️ 4H RSI 65: room left, but close to hot
🎯 My take: a 4H close over $12.01 opens $13; losing $10.79 breaks the series
💬 Third try at $12: breakout or another rejection? 👇
#AVAX #Avalanche #Altcoins
✅ 4 higher lows: $9.97, $10.15, $10.45, $10.79
✅ $11.57 (+4.7% 24h), above 4H EMA 20/50/200
✅ $545M in tokenized Treasuries now on Avalanche
⚠️ $11.80-12.01 rejected it on Sep 21 and Sep 29
⚠️ 4H RSI 65: room left, but close to hot
🎯 My take: a 4H close over $12.01 opens $13; losing $10.79 breaks the series
💬 Third try at $12: breakout or another rejection? 👇
#AVAX #Avalanche #Altcoins
96
·
--
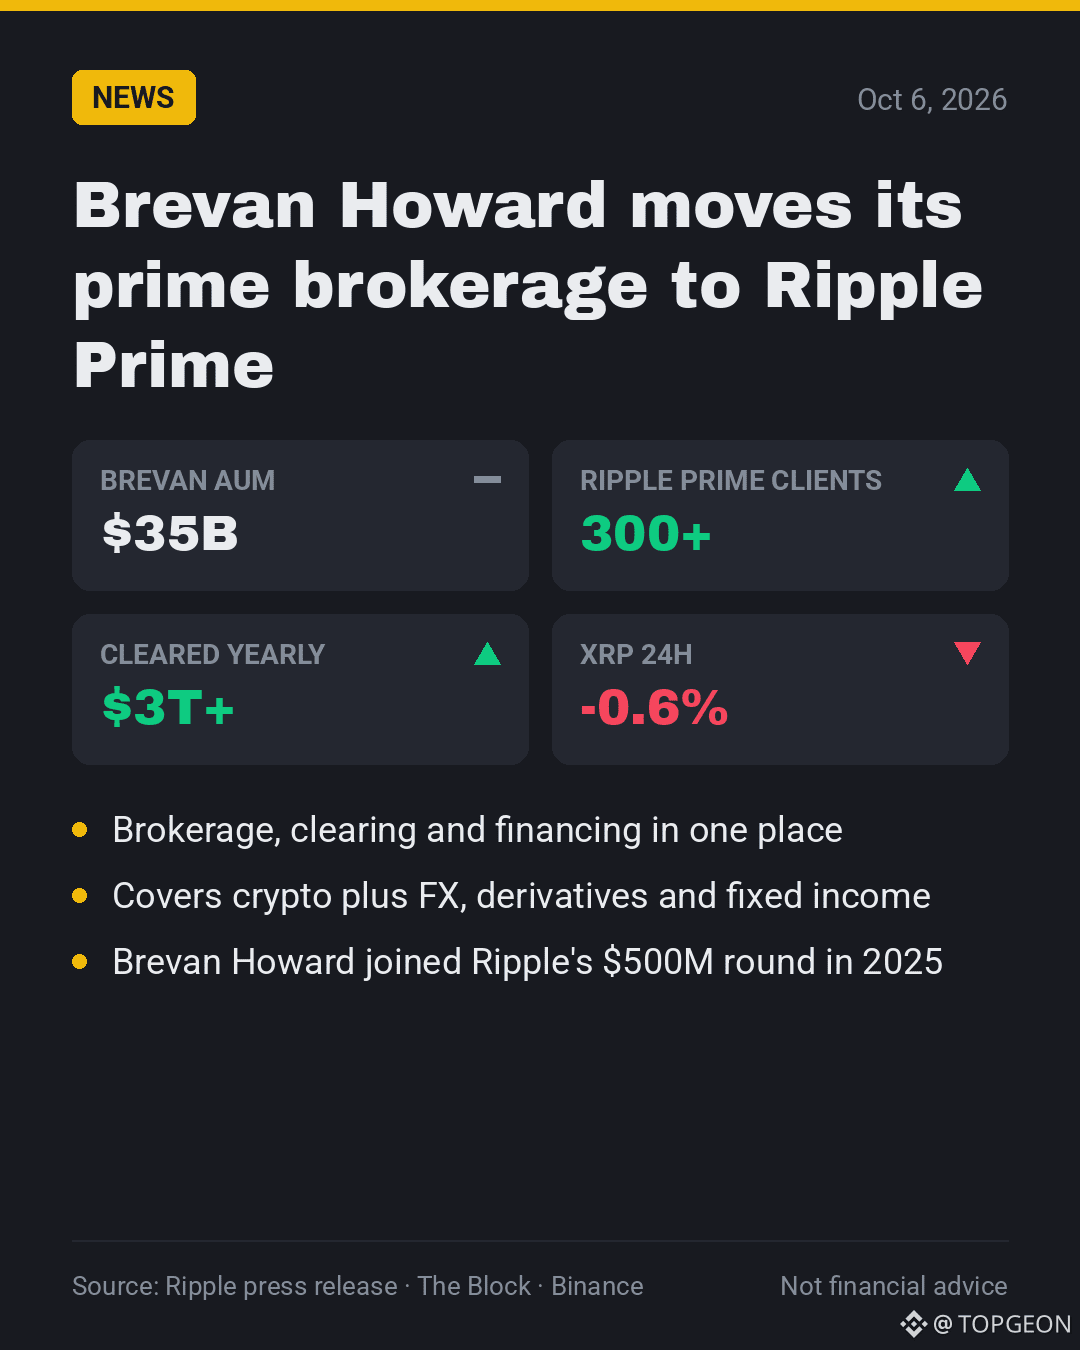
🏦 $XRP news: a $35B hedge fund now clears through Ripple Prime
1️⃣ Brevan Howard picks Ripple Prime for brokerage, clearing and financing
2️⃣ Not just crypto: FX, derivatives and fixed income too
3️⃣ Ripple Prime: 300+ clients, $3T+ cleared a year
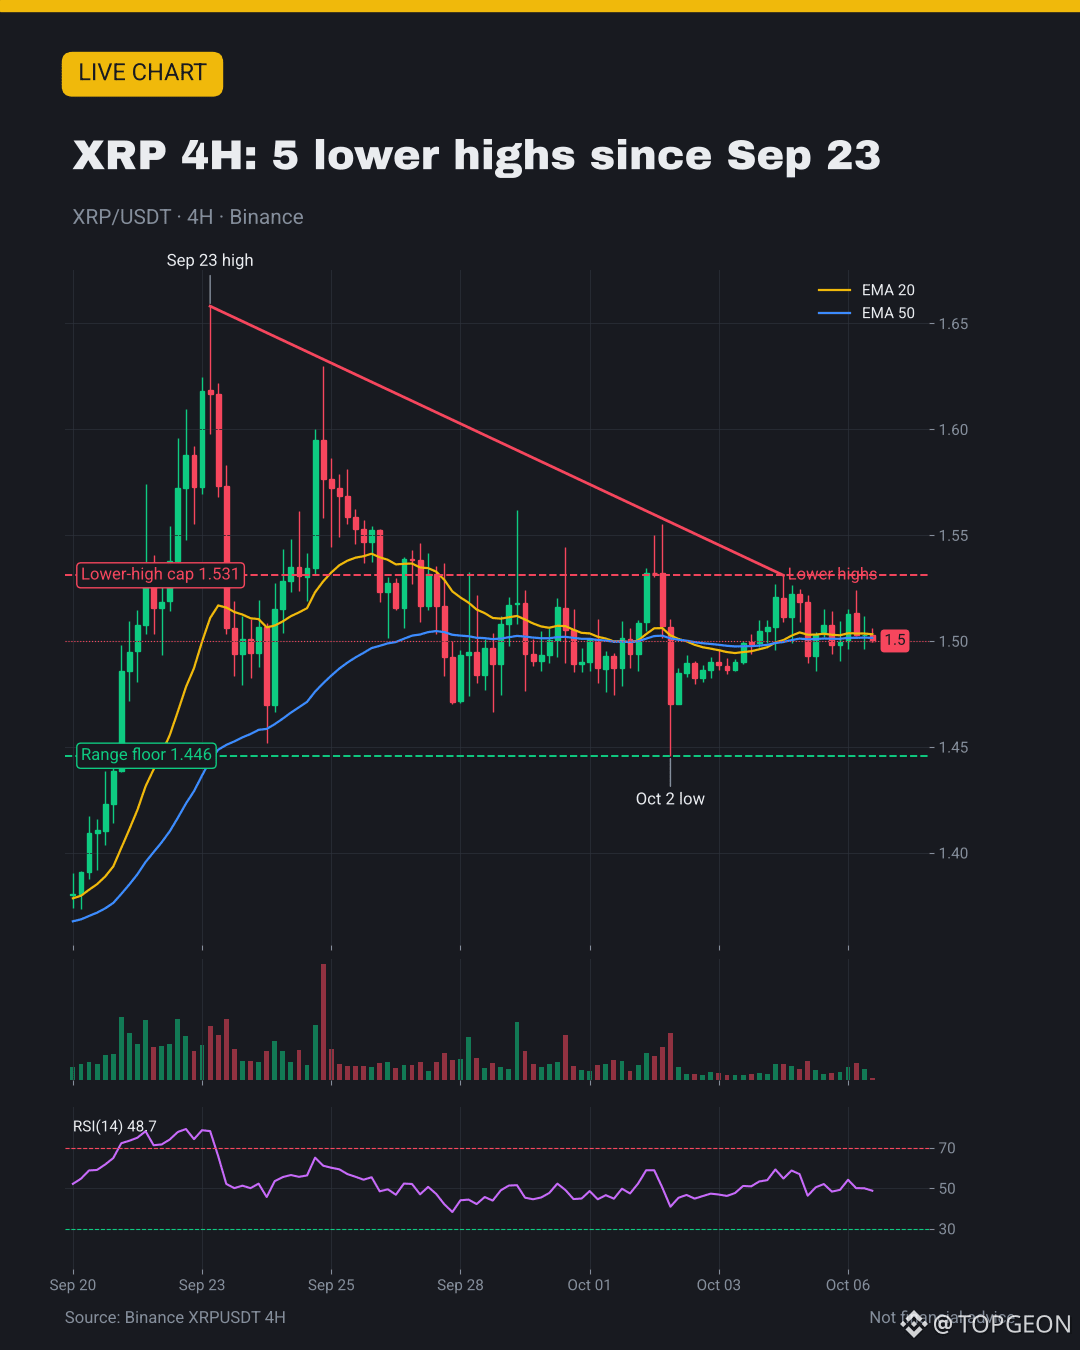
📊 XRP $1.50 (-0.6% 24h), 4H RSI 49: price ignores it for now
🎯 My take: 5 lower highs since Sep 23; a 4H close over $1.531 flips it, $1.446 is the floor
💬 Does Wall Street adoption move XRP, or only ETF flows? 👇
#XRP #Ripple #Institutions
🏦 $XRP news: a $35B hedge fund now clears through Ripple Prime
1️⃣ Brevan Howard picks Ripple Prime for brokerage, clearing and financing
2️⃣ Not just crypto: FX, derivatives and fixed income too
3️⃣ Ripple Prime: 300+ clients, $3T+ cleared a year
📊 XRP $1.50 (-0.6% 24h), 4H RSI 49: price ignores it for now
🎯 My take: 5 lower highs since Sep 23; a 4H close over $1.531 flips it, $1.446 is the floor
💬 Does Wall Street adoption move XRP, or only ETF flows? 👇
#XRP #Ripple #Institutions
1️⃣ Brevan Howard picks Ripple Prime for brokerage, clearing and financing
2️⃣ Not just crypto: FX, derivatives and fixed income too
3️⃣ Ripple Prime: 300+ clients, $3T+ cleared a year
📊 XRP $1.50 (-0.6% 24h), 4H RSI 49: price ignores it for now
🎯 My take: 5 lower highs since Sep 23; a 4H close over $1.531 flips it, $1.446 is the floor
💬 Does Wall Street adoption move XRP, or only ETF flows? 👇
#XRP #Ripple #Institutions
1
42
·
--
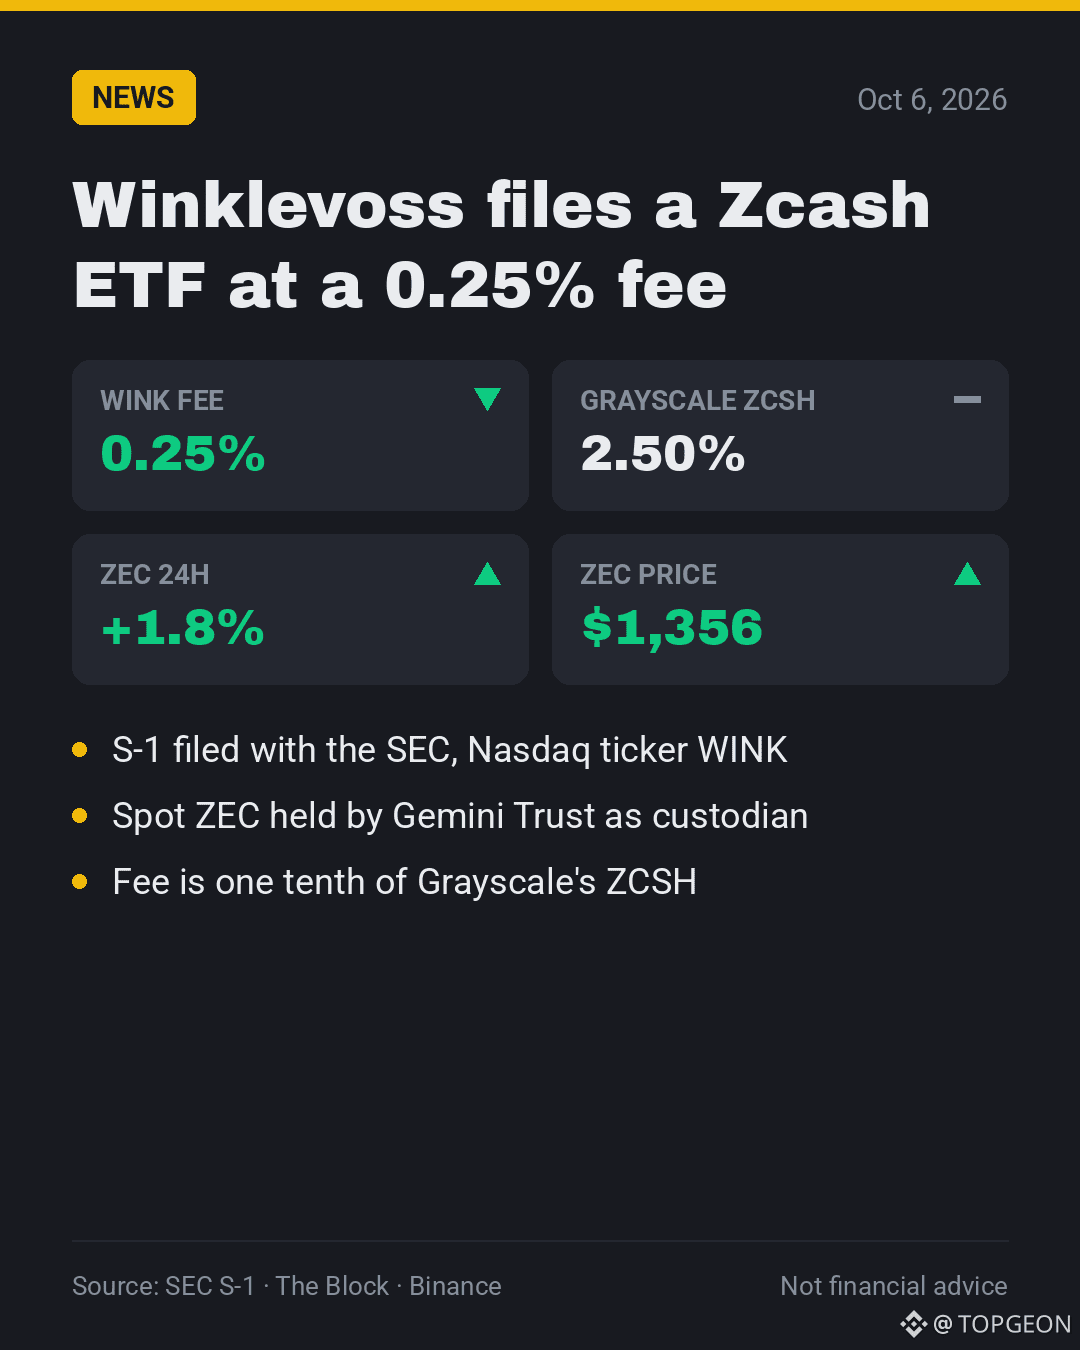
🛡️ $ZEC gets a 2nd US spot ETF bid: Winklevoss files "WINK"
• S-1 filed with the SEC today, set to list on Nasdaq
• Fee 0.25% vs 2.50% for Grayscale's ZCSH: one tenth
• Gemini Trust would custody the spot ZEC
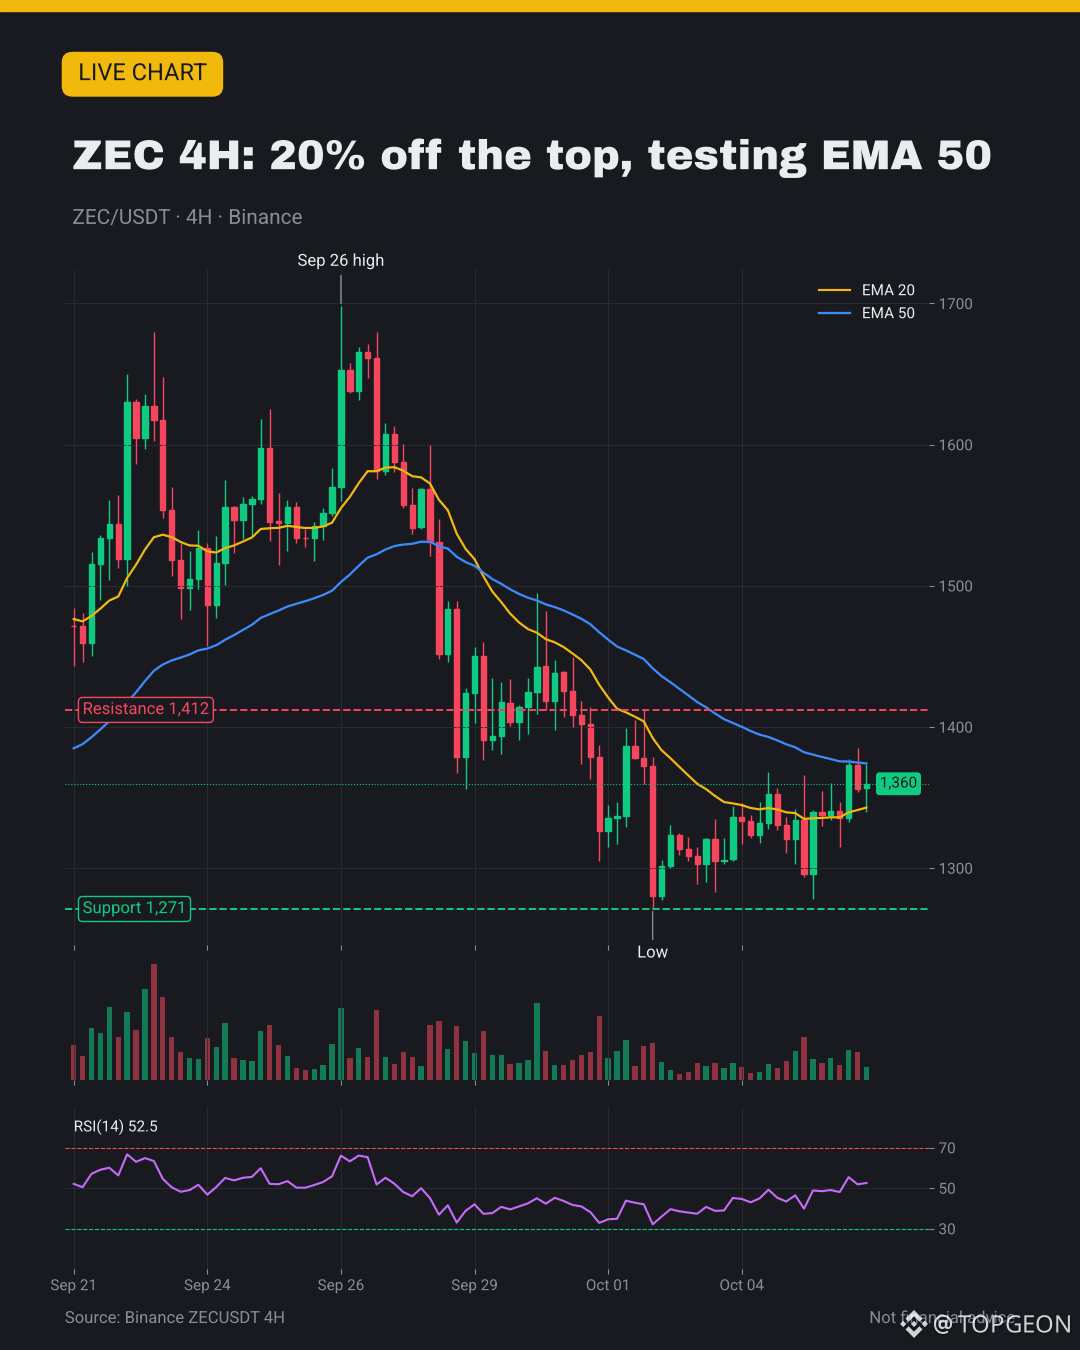
• ZEC $1,356 (+1.8% 24h), still 20% under its $1,698 top
🎯 My take: clear $1,412 to restart the trend; $1,271 is the floor
💬 Would a cheap ETF bring new money into ZEC? 👇
#Zcash #CryptoETF
🛡️ $ZEC gets a 2nd US spot ETF bid: Winklevoss files "WINK"
• S-1 filed with the SEC today, set to list on Nasdaq
• Fee 0.25% vs 2.50% for Grayscale's ZCSH: one tenth
• Gemini Trust would custody the spot ZEC
• ZEC $1,356 (+1.8% 24h), still 20% under its $1,698 top
🎯 My take: clear $1,412 to restart the trend; $1,271 is the floor
💬 Would a cheap ETF bring new money into ZEC? 👇
#Zcash #CryptoETF
• S-1 filed with the SEC today, set to list on Nasdaq
• Fee 0.25% vs 2.50% for Grayscale's ZCSH: one tenth
• Gemini Trust would custody the spot ZEC
• ZEC $1,356 (+1.8% 24h), still 20% under its $1,698 top
🎯 My take: clear $1,412 to restart the trend; $1,271 is the floor
💬 Would a cheap ETF bring new money into ZEC? 👇
#Zcash #CryptoETF
158
·
--
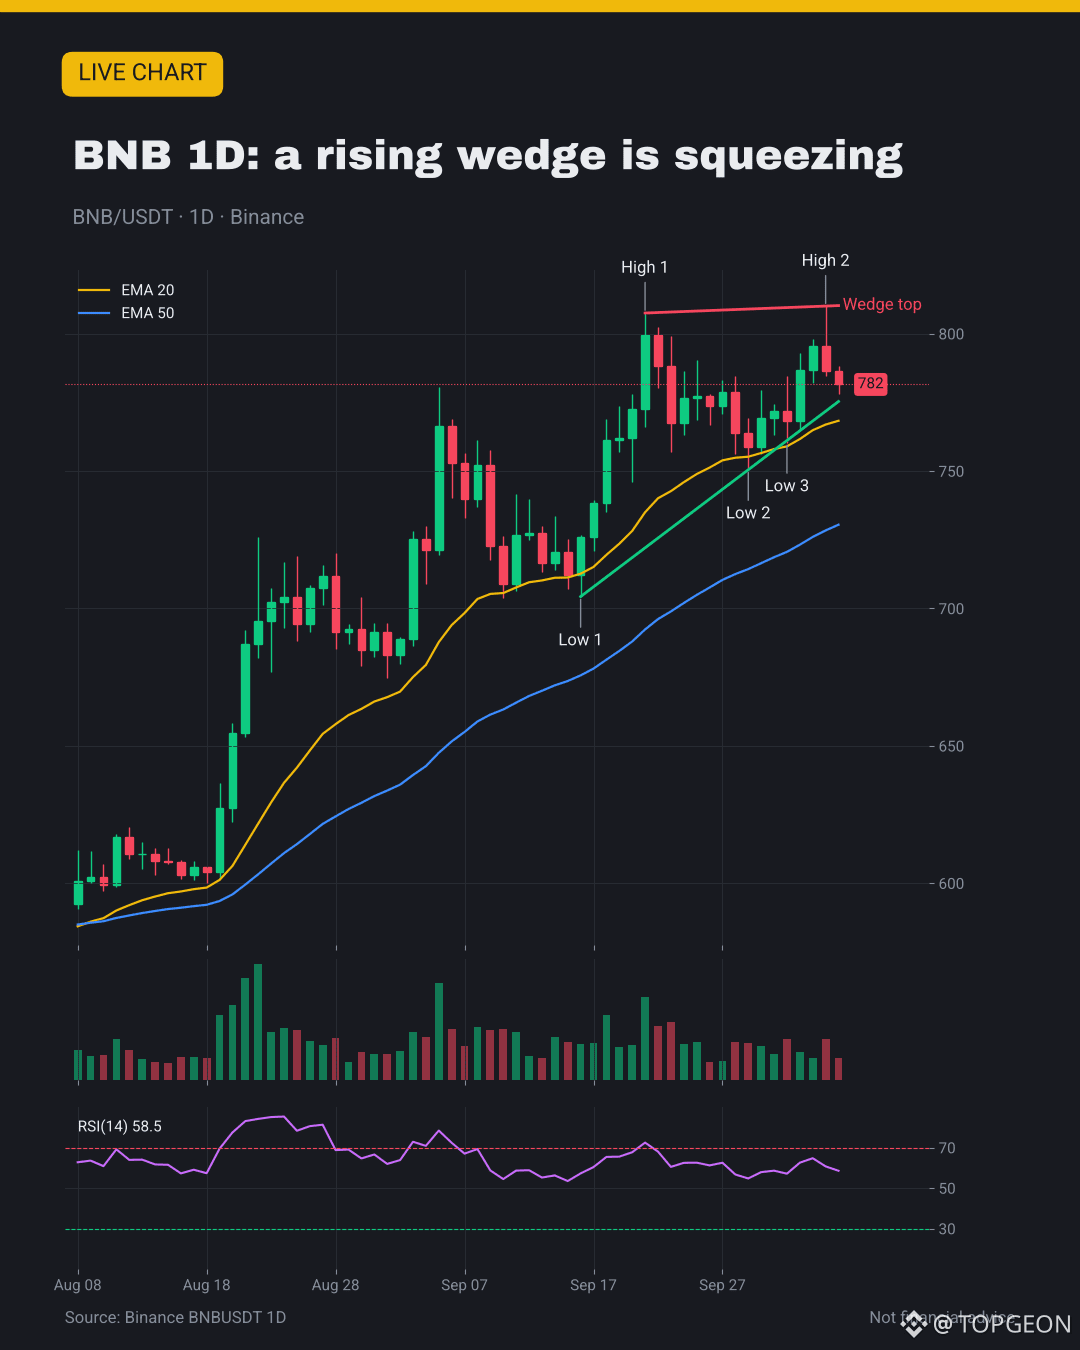
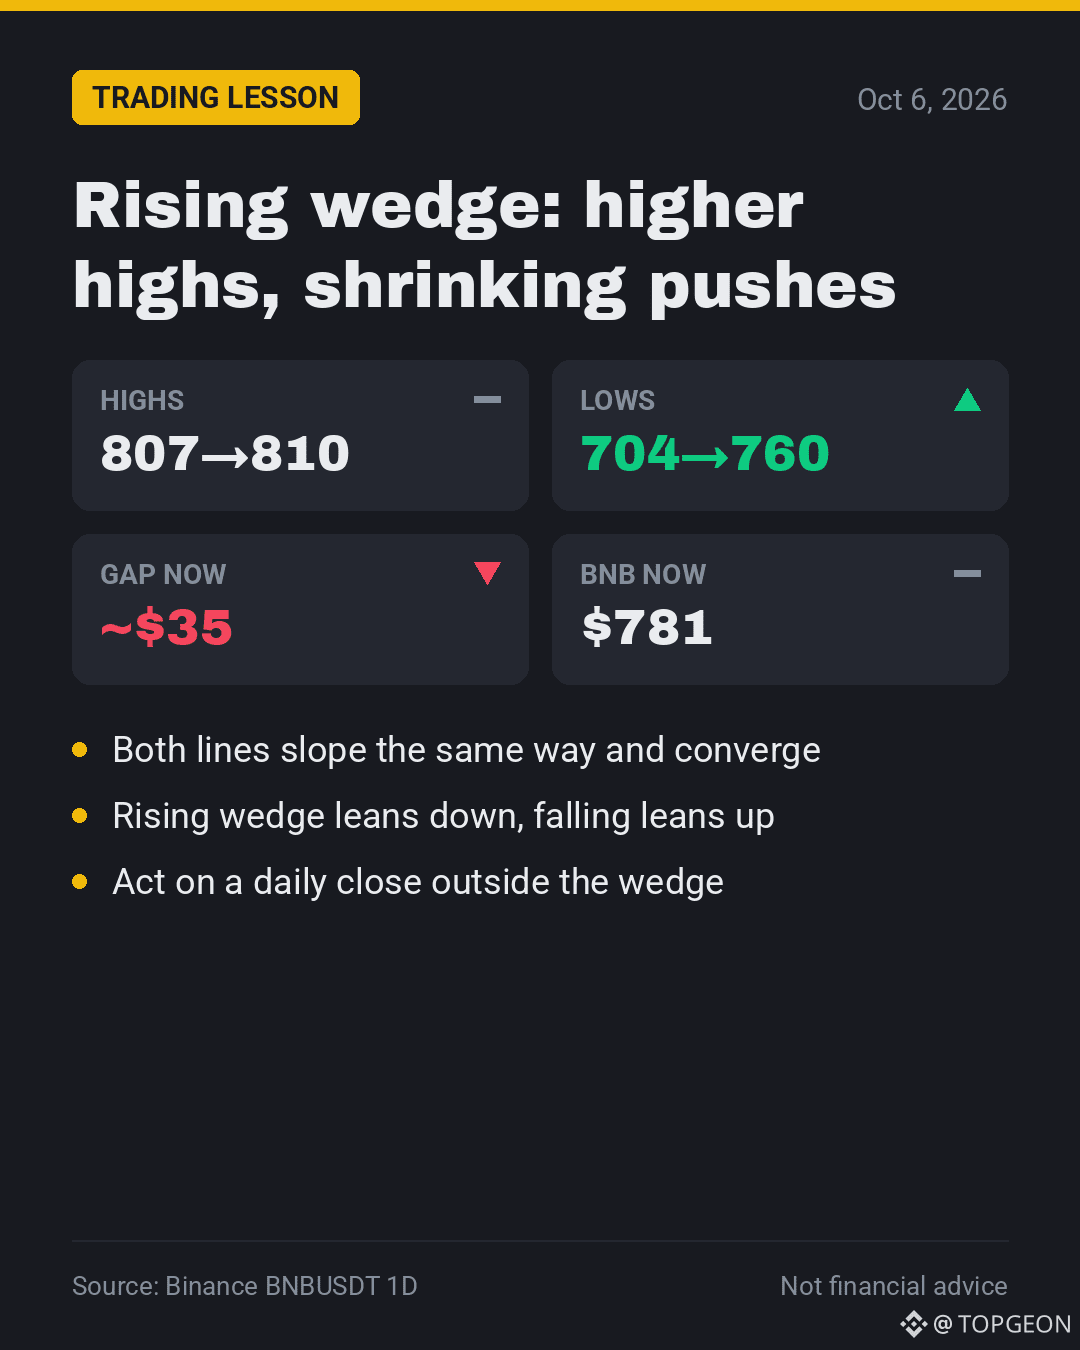
📐 3 things $BNB is telling us with this rising wedge
1️⃣ Highs: $807.49 → $809.99, just +$2.50 in 2 weeks
2️⃣ Lows: $704 → $750 → $760, climbing much faster
3️⃣ Volume on the 2nd high: about half of the 1st
🧭 Floor near $775, roof near $810, price ~$781
🎯 My take: a daily close under $775 = breakdown signal
💬 Do you short wedge breaks or wait for the retest? 👇
📖 Full lesson: https://app.binance.com/uni-qr/cart/374463749643595
#RisingWedge #ChartPatterns #BNB
📐 3 things $BNB is telling us with this rising wedge
1️⃣ Highs: $807.49 → $809.99, just +$2.50 in 2 weeks
2️⃣ Lows: $704 → $750 → $760, climbing much faster
3️⃣ Volume on the 2nd high: about half of the 1st
🧭 Floor near $775, roof near $810, price ~$781
🎯 My take: a daily close under $775 = breakdown signal
💬 Do you short wedge breaks or wait for the retest? 👇
📖 Full lesson: https://app.binance.com/uni-qr/cart/374463749643595
#RisingWedge #ChartPatterns #BNB
1️⃣ Highs: $807.49 → $809.99, just +$2.50 in 2 weeks
2️⃣ Lows: $704 → $750 → $760, climbing much faster
3️⃣ Volume on the 2nd high: about half of the 1st
🧭 Floor near $775, roof near $810, price ~$781
🎯 My take: a daily close under $775 = breakdown signal
💬 Do you short wedge breaks or wait for the retest? 👇
📖 Full lesson: https://app.binance.com/uni-qr/cart/374463749643595
#RisingWedge #ChartPatterns #BNB
25
·
--
Article
Wedge Patterns: Explained Simply📘 What is a Wedge Pattern?
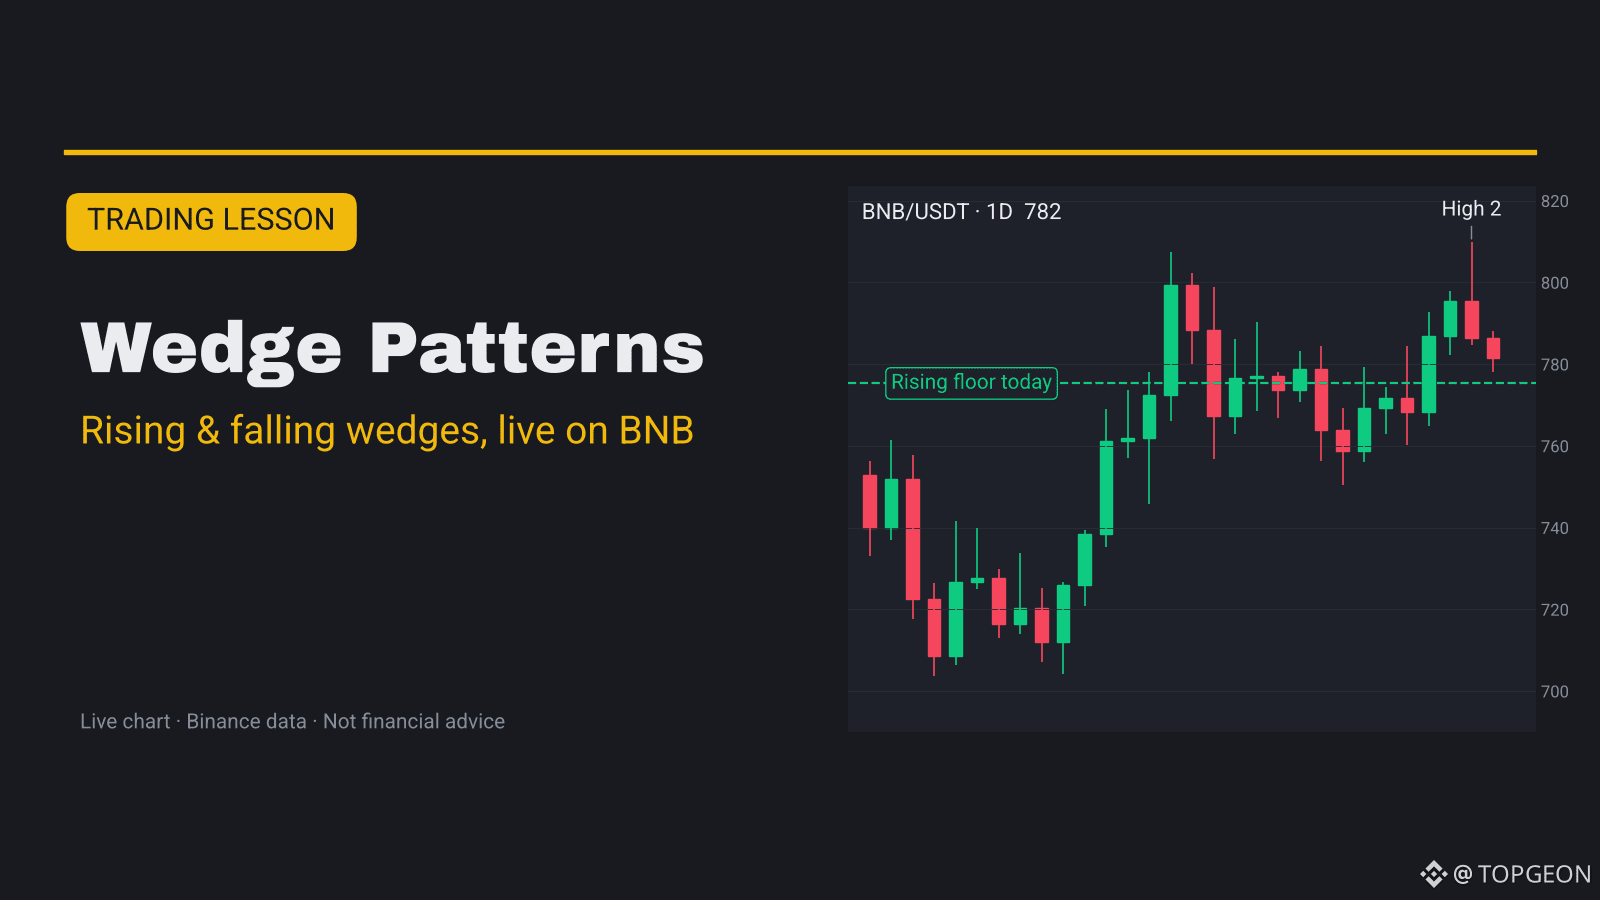
$BNB has made higher highs and higher lows for 3 weeks, but each push up is smaller than the last. That squeeze is a rising wedge, and it is today's live lesson.
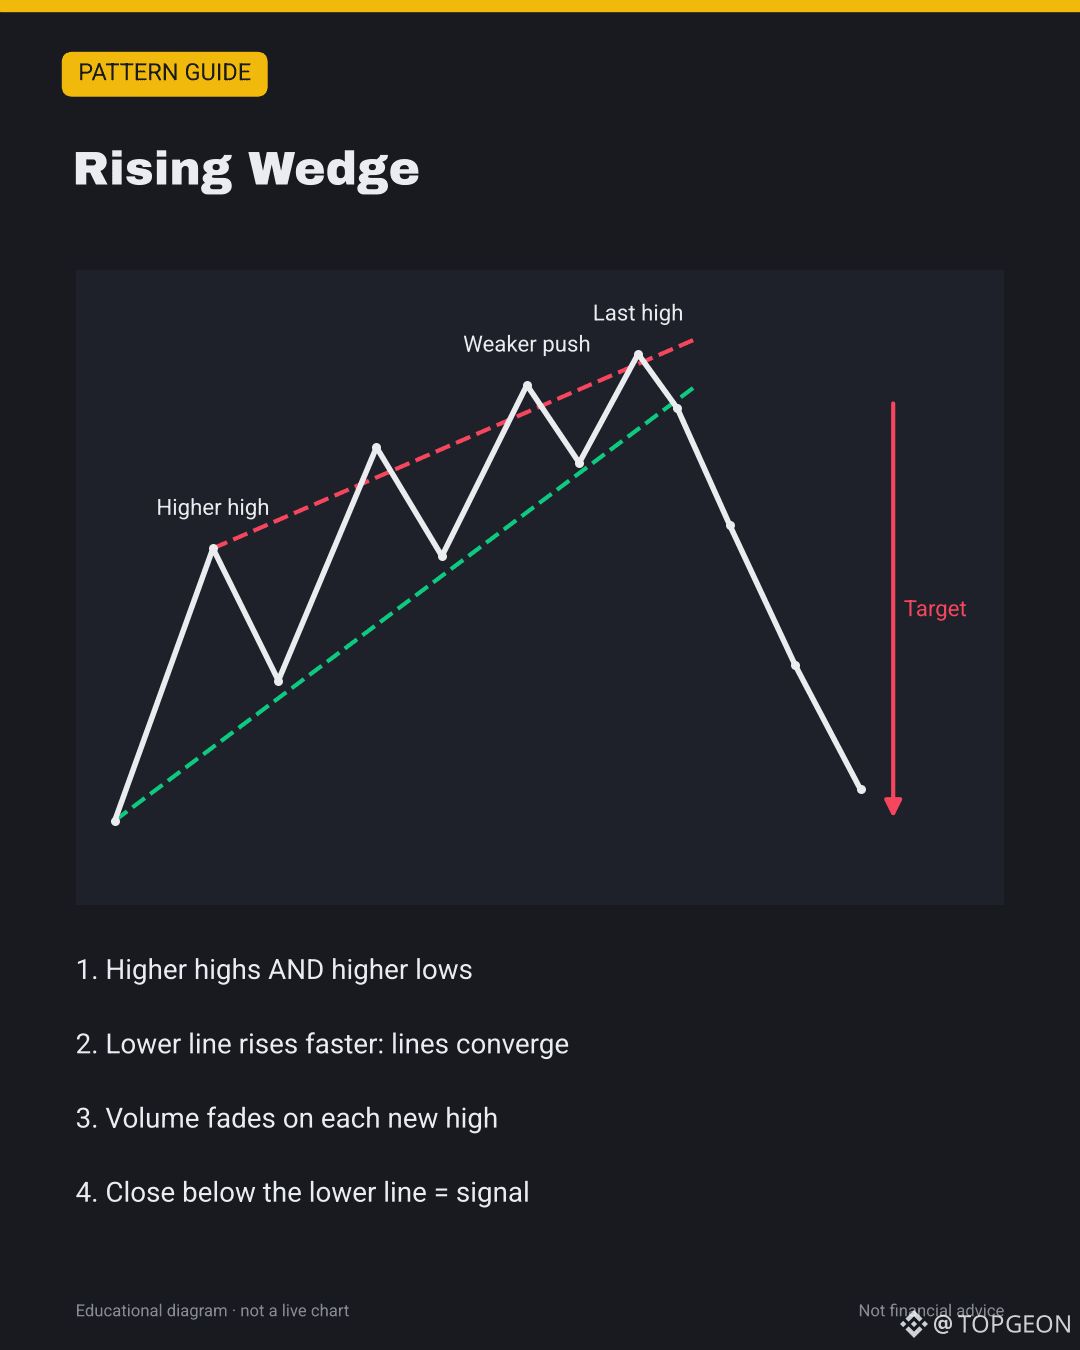
A wedge is a pattern where price moves between 2 trendlines that slope in the SAME direction and get closer together. It shows a trend that is losing energy. There are 2 types:
• Rising wedge: both lines slope up, the lower line is steeper. Buyers are getting tired. Usually breaks DOWN.
• Falling wedge: both lines slope down, the upper line is steeper. Sellers are getting tired. Usually breaks UP.
• Wedge vs triangle: in a triangle the lines point in opposite directions (or one is flat). In a wedge both point the same way.
📊 Live chart in the cover and in the image post below.
🔍 How to spot a wedge
• Find at least 2 highs and 2 lows (3 touches on one line is better)
• Draw one line over the highs and one line under the lows
• Both lines slope the same way and converge
• Each new high (or low) moves less than the one before
• Volume usually fades as the wedge tightens
• RSI often shows divergence: price makes a new high, RSI does not
📈 How traders use it
• Entry: on a candle CLOSE outside the wedge, against the slope (down for rising, up for falling)
• Safer entry: wait for a retest of the broken line from the other side
• Stop-loss: just back inside the wedge, above the last high (rising) or below the last low (falling)
• Target: the start of the wedge (its widest part). Some traders use the wedge height instead
🧪 Live example: $BNB daily, Sept 16 – Oct 6, 2026
The highs:
• Sept 21: $807.49, on about $230M of daily volume
• Oct 5: $809.99, only $2.50 higher, on about $113M (half the volume)
The lows:
• Sept 16: $704.29
• Sept 29: $750.47
• Oct 2: $760.35, sitting right on the rising lower line
The lower line climbs about $3.5 a day, the upper line barely $0.2 a day. So the lines are converging. On Sept 21 the gap was about $85. Today it is about $35, roughly $775 to $810.
Right now BNB trades near $781, just above the lower line (~$775). Daily RSI(14) is 58.5. The 20 EMA is at $768 and the 50 EMA at $730.
What it means: the wedge is still intact. Nothing is confirmed yet. A daily close under ~$775 would be the classic breakdown signal, with the wedge start near $704–722 as the measured area. A daily close above ~$810 on strong volume would cancel the pattern.
For comparison, $BTC is not in a wedge now. Since Sept 21 its highs are falling ($87,395 → $86,130) while its lows rise. Lines pointing in opposite directions = a triangle, not a wedge.
⚠️ Common mistakes
• Calling a triangle a wedge. Check that BOTH lines slope the same way
• Shorting a rising wedge just because it exists. Wait for the close below the line
• Using only 2 touches on each side. More touches = more reliable
• Forgetting the trend. A rising wedge in a strong uptrend can just break up
✅ Quick checklist
• Both lines slope the same direction and converge?
• At least 2 touches per line, ideally 3 on one?
• Volume fading, RSI not confirming new highs/lows?
• A daily close outside the wedge?
• Stop back inside, target = start of the wedge?
💬 Have you traded a wedge breakdown or breakout? Did it hit the target? 👇
Not financial advice. DYOR.
#TradingTips #ChartPatterns #BNB
Wedge Patterns: Explained Simply
📘 What is a Wedge Pattern?
$BNB has made higher highs and higher lows for 3 weeks, but each push up is smaller than the last. That squeeze is a rising wedge, and it is today's live lesson.
A wedge is a pattern where price moves between 2 trendlines that slope in the SAME direction and get closer together. It shows a trend that is losing energy. There are 2 types:
• Rising wedge: both lines slope up, the lower line is steeper. Buyers are getting tired. Usually breaks DOWN.
• Falling wedge: both lines slope down, the upper line is steeper. Sellers are getting tired. Usually breaks UP.
• Wedge vs triangle: in a triangle the lines point in opposite directions (or one is flat). In a wedge both point the same way.
📊 Live chart in the cover and in the image post below.
🔍 How to spot a wedge
• Find at least 2 highs and 2 lows (3 touches on one line is better)
• Draw one line over the highs and one line under the lows
• Both lines slope the same way and converge
• Each new high (or low) moves less than the one before
• Volume usually fades as the wedge tightens
• RSI often shows divergence: price makes a new high, RSI does not
📈 How traders use it
• Entry: on a candle CLOSE outside the wedge, against the slope (down for rising, up for falling)
• Safer entry: wait for a retest of the broken line from the other side
• Stop-loss: just back inside the wedge, above the last high (rising) or below the last low (falling)
• Target: the start of the wedge (its widest part). Some traders use the wedge height instead
🧪 Live example: $BNB daily, Sept 16 – Oct 6, 2026
The highs:
• Sept 21: $807.49, on about $230M of daily volume
• Oct 5: $809.99, only $2.50 higher, on about $113M (half the volume)
The lows:
• Sept 16: $704.29
• Sept 29: $750.47
• Oct 2: $760.35, sitting right on the rising lower line
The lower line climbs about $3.5 a day, the upper line barely $0.2 a day. So the lines are converging. On Sept 21 the gap was about $85. Today it is about $35, roughly $775 to $810.
Right now BNB trades near $781, just above the lower line (~$775). Daily RSI(14) is 58.5. The 20 EMA is at $768 and the 50 EMA at $730.
What it means: the wedge is still intact. Nothing is confirmed yet. A daily close under ~$775 would be the classic breakdown signal, with the wedge start near $704–722 as the measured area. A daily close above ~$810 on strong volume would cancel the pattern.
For comparison, $BTC is not in a wedge now. Since Sept 21 its highs are falling ($87,395 → $86,130) while its lows rise. Lines pointing in opposite directions = a triangle, not a wedge.
⚠️ Common mistakes
• Calling a triangle a wedge. Check that BOTH lines slope the same way
• Shorting a rising wedge just because it exists. Wait for the close below the line
• Using only 2 touches on each side. More touches = more reliable
• Forgetting the trend. A rising wedge in a strong uptrend can just break up
✅ Quick checklist
• Both lines slope the same direction and converge?
• At least 2 touches per line, ideally 3 on one?
• Volume fading, RSI not confirming new highs/lows?
• A daily close outside the wedge?
• Stop back inside, target = start of the wedge?
💬 Have you traded a wedge breakdown or breakout? Did it hit the target? 👇
Not financial advice. DYOR.
#TradingTips #ChartPatterns #BNB
$BNB has made higher highs and higher lows for 3 weeks, but each push up is smaller than the last. That squeeze is a rising wedge, and it is today's live lesson.
A wedge is a pattern where price moves between 2 trendlines that slope in the SAME direction and get closer together. It shows a trend that is losing energy. There are 2 types:
• Rising wedge: both lines slope up, the lower line is steeper. Buyers are getting tired. Usually breaks DOWN.
• Falling wedge: both lines slope down, the upper line is steeper. Sellers are getting tired. Usually breaks UP.
• Wedge vs triangle: in a triangle the lines point in opposite directions (or one is flat). In a wedge both point the same way.
📊 Live chart in the cover and in the image post below.
🔍 How to spot a wedge
• Find at least 2 highs and 2 lows (3 touches on one line is better)
• Draw one line over the highs and one line under the lows
• Both lines slope the same way and converge
• Each new high (or low) moves less than the one before
• Volume usually fades as the wedge tightens
• RSI often shows divergence: price makes a new high, RSI does not
📈 How traders use it
• Entry: on a candle CLOSE outside the wedge, against the slope (down for rising, up for falling)
• Safer entry: wait for a retest of the broken line from the other side
• Stop-loss: just back inside the wedge, above the last high (rising) or below the last low (falling)
• Target: the start of the wedge (its widest part). Some traders use the wedge height instead
🧪 Live example: $BNB daily, Sept 16 – Oct 6, 2026
The highs:
• Sept 21: $807.49, on about $230M of daily volume
• Oct 5: $809.99, only $2.50 higher, on about $113M (half the volume)
The lows:
• Sept 16: $704.29
• Sept 29: $750.47
• Oct 2: $760.35, sitting right on the rising lower line
The lower line climbs about $3.5 a day, the upper line barely $0.2 a day. So the lines are converging. On Sept 21 the gap was about $85. Today it is about $35, roughly $775 to $810.
Right now BNB trades near $781, just above the lower line (~$775). Daily RSI(14) is 58.5. The 20 EMA is at $768 and the 50 EMA at $730.
What it means: the wedge is still intact. Nothing is confirmed yet. A daily close under ~$775 would be the classic breakdown signal, with the wedge start near $704–722 as the measured area. A daily close above ~$810 on strong volume would cancel the pattern.
For comparison, $BTC is not in a wedge now. Since Sept 21 its highs are falling ($87,395 → $86,130) while its lows rise. Lines pointing in opposite directions = a triangle, not a wedge.
⚠️ Common mistakes
• Calling a triangle a wedge. Check that BOTH lines slope the same way
• Shorting a rising wedge just because it exists. Wait for the close below the line
• Using only 2 touches on each side. More touches = more reliable
• Forgetting the trend. A rising wedge in a strong uptrend can just break up
✅ Quick checklist
• Both lines slope the same direction and converge?
• At least 2 touches per line, ideally 3 on one?
• Volume fading, RSI not confirming new highs/lows?
• A daily close outside the wedge?
• Stop back inside, target = start of the wedge?
💬 Have you traded a wedge breakdown or breakout? Did it hit the target? 👇
Not financial advice. DYOR.
#TradingTips #ChartPatterns #BNB
46
Log in to explore more content
Join global crypto users on Binance Square
⚡️ Get latest and useful information about crypto.
💬 Trusted by the world’s largest crypto exchange.
👍 Discover real insights from verified creators.
Email / Phone number
Trending Topics
FedMinutesFocusOnOctoberPause
9,557 views
271 Discussing
#fedminutesfocusonoctoberpause
🚨 OCTOBER FED HIKE ODDS COLLAPSE TO 21.6%… Is $BTC About to React? 👀
The Fed is about to give markets another major clue.
Investors are waiting for today’s FOMC minutes — and the biggest question is whether October brings another rate hike… or a pause.
Right now, the odds of a 25-basis-point October hike have fallen to just 21.6%.
That’s a huge shift in expectations.
But here’s what makes this interesting… 👀
The Fed raised rates to 3.75%–4.00% in September, but recent weakness in jobs data and softer inflation have made another immediate hike look less certain.
And for crypto, this matters.
A Fed pause could reduce pressure on financial conditions and potentially improve risk appetite.
That could become a tailwind for BTC
But there’s a catch…
Bitcoin is already under pressure as the dollar and Treasury yields move higher.
So tonight’s minutes could become a volatility trigger.
Dovish Fed → liquidity hopes → bullish .
BTC narrative?
Hawkish Fed → higher-rate fears → more pressure on risk assets?
The real question:
Is October becoming the pause Bitcoin bulls have been waiting for… or could the Fed surprise the market again? 👀
Watch BTC + Fed expectations + Treasury yields closely.
#FederalReserve #Fed #Crypto #InterestRates
$ETH
$SOL
Shae Cassler Sw9r
·9 Likes
·19.6k views
BinanceLaunchesBinanceIntelligence
913,147 views
5,549 Discussing
RobinhoodAdds$25MInBitcoinToBalanceSheet
589 views
25 Discussing