

Sophia Bennett crypto
43 Posts

Sophia Bennett crypto
Report
Block User
🎓 Finance & Technology Educator | Crypto Content Creator 📊 Technical Analysis • Market Insights • Trading Psychology
Open Trade
Occasional Trader
5.4 Years
5 Following
10 Followers
9 Liked
Posts
Portfolio
#USSpotXRPETFsDraw$170MOver11Days
XRP ETF FLOWS ARE TURNING INTO A REAL SIGNAL
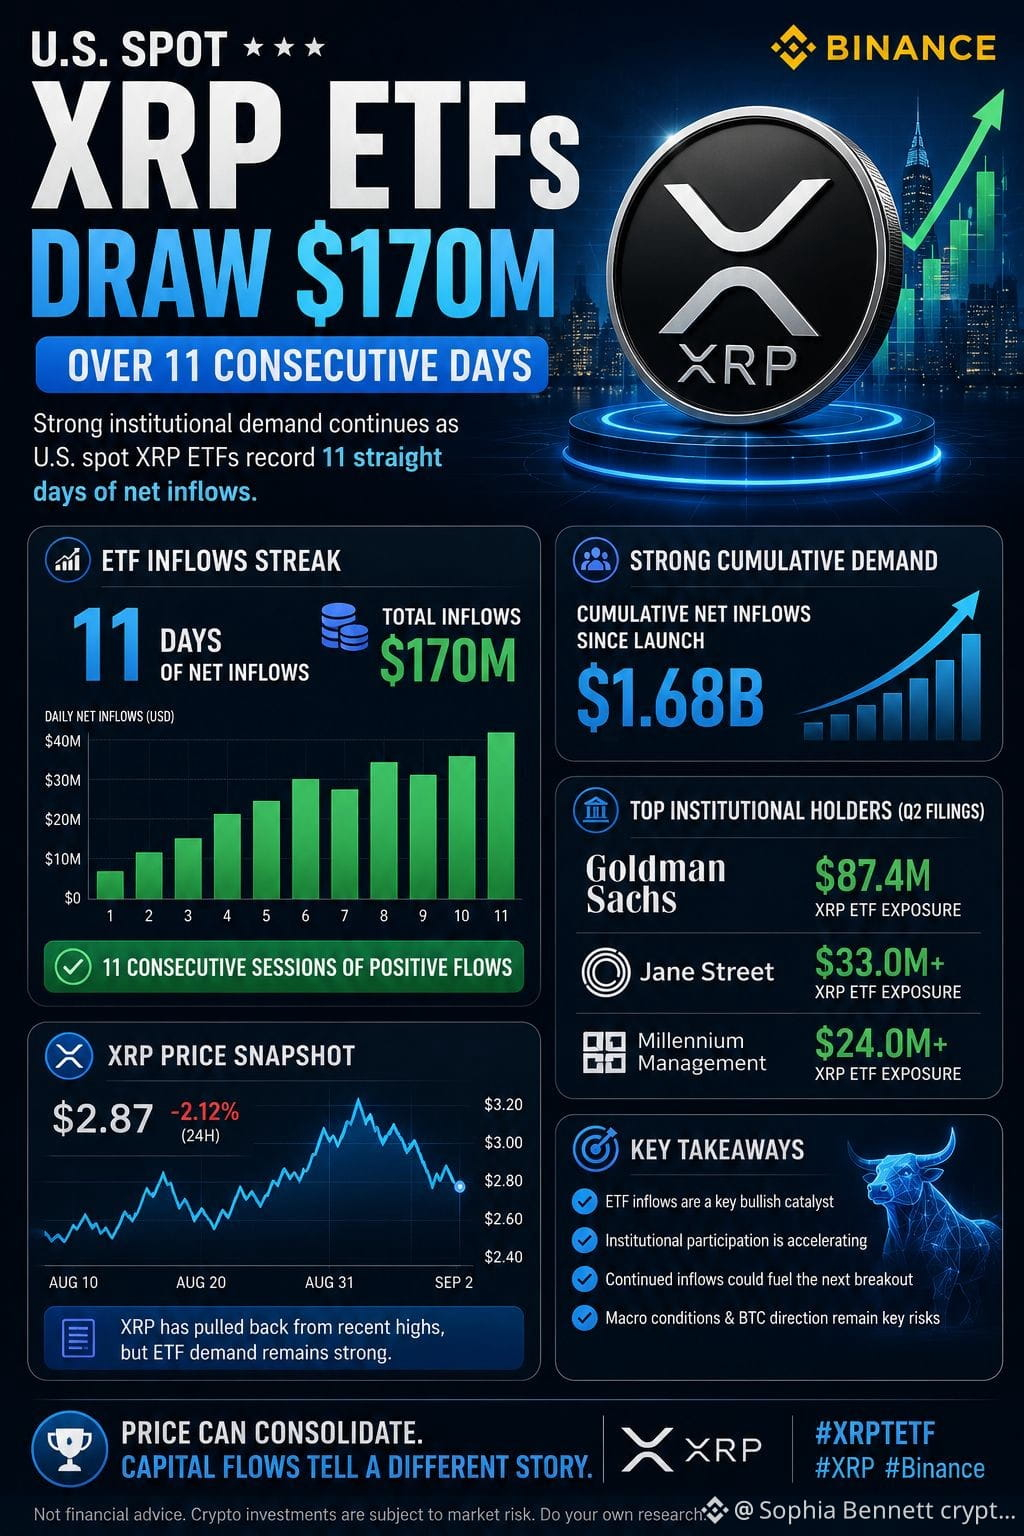
U.S. spot XRP ETFs have recorded 11 consecutive sessions of net inflows, attracting roughly $170M during the streak. Cumulative inflows since launch have now reached about $1.68B.
The more interesting part is the institutional footprint.
Q2 filings show Goldman Sachs, Jane Street and Millennium Management among the largest disclosed holders of XRP ETFs. Goldman alone reported roughly $87.4M of exposure.
XRP has pulled back from its late-August high, but persistent ETF demand suggests institutional interest hasn't disappeared.
What matters from here:
• ETF inflows remain the key bullish catalyst
• XRP needs price confirmation to validate the demand
• Continued inflows could strengthen the next breakout attempt
• Macro conditions and Bitcoin's direction remain important risks
The takeaway:
Price can consolidate.
Capital flows tell a different story.
If ETF demand continues while XRP holds its higher support structure, the next move could become increasingly interesting.
$XRP
{spot}(XRPUSDT)
#XRP #XRPETF #Ripple #Crypto #Altcoins #InstitutionalInvestors #ETF #BinanceCommunity
#USSpotXRPETFsDraw$170MOver11Days
XRP ETF FLOWS ARE TURNING INTO A REAL SIGNAL
U.S. spot XRP ETFs have recorded 11 consecutive sessions of net inflows, attracting roughly $170M during the streak. Cumulative inflows since launch have now reached about $1.68B.
The more interesting part is the institutional footprint.
Q2 filings show Goldman Sachs, Jane Street and Millennium Management among the largest disclosed holders of XRP ETFs. Goldman alone reported roughly $87.4M of exposure.
XRP has pulled back from its late-August high, but persistent ETF demand suggests institutional interest hasn't disappeared.
What matters from here:
• ETF inflows remain the key bullish catalyst
• XRP needs price confirmation to validate the demand
• Continued inflows could strengthen the next breakout attempt
• Macro conditions and Bitcoin's direction remain important risks
The takeaway:
Price can consolidate.
Capital flows tell a different story.
If ETF demand continues while XRP holds its higher support structure, the next move could become increasingly interesting.
$XRP
#XRP #XRPETF #Ripple #Crypto #Altcoins #InstitutionalInvestors #ETF #BinanceCommunity
XRP ETF FLOWS ARE TURNING INTO A REAL SIGNAL
U.S. spot XRP ETFs have recorded 11 consecutive sessions of net inflows, attracting roughly $170M during the streak. Cumulative inflows since launch have now reached about $1.68B.
The more interesting part is the institutional footprint.
Q2 filings show Goldman Sachs, Jane Street and Millennium Management among the largest disclosed holders of XRP ETFs. Goldman alone reported roughly $87.4M of exposure.
XRP has pulled back from its late-August high, but persistent ETF demand suggests institutional interest hasn't disappeared.
What matters from here:
• ETF inflows remain the key bullish catalyst
• XRP needs price confirmation to validate the demand
• Continued inflows could strengthen the next breakout attempt
• Macro conditions and Bitcoin's direction remain important risks
The takeaway:
Price can consolidate.
Capital flows tell a different story.
If ETF demand continues while XRP holds its higher support structure, the next move could become increasingly interesting.
$XRP
#XRP #XRPETF #Ripple #Crypto #Altcoins #InstitutionalInvestors #ETF #BinanceCommunity
97
Article
SOL/USDT — TRADE SETUPSOL/USDT — TRADE SETUP
SOL is currently trading around $100, after pulling back from the recent $110.60 swing high.
The broader daily structure remains constructive, but short-term momentum has weakened. Price is currently below the 7-day MA at $103.69, while holding well above the 25-day MA at $88.49 and 99-day MA at $77.92.
That makes the $100 area the key decision zone.
Technical Structure
Support
• $100–$98.30 — immediate support
• $96.50 — key invalidation area
• $94–$95 — next downside zone
• $88–$90 — major daily support
Resistance
• $103.70–$104.40 — first breakout zone
• $110.60 — recent swing high
• $115–$120 — next upside targets if momentum expands
Trade Idea — Long
Entry: $99.50–$101.50
Stop-Loss: $96.40
Target 1: $104.40
Target 2: $110.60
Target 3: $118–$120
Approximate risk/reward from a $100 entry:
T1: ~1.4R
T2: ~3.4R
T3: ~5.7R
The Trigger
I would not chase SOL at resistance.
The cleaner setup is either:
1. SOL holds the $99–$100 zone and starts reclaiming $103.70, or
2. SOL breaks and closes above $104.40 with convincing volume.
A daily close below $96.40–$97 would weaken this bullish setup and increase the probability of a move toward $94–$95.
Why the setup is interesting
Solana's fundamental backdrop remains supportive. U.S. spot SOL ETFs have continued attracting capital, while recent reports put cumulative ETF inflows around the $1.2B area. Solana's upcoming Alpenglow upgrade is also scheduled for late September, keeping the network's development story on the radar.
My technical read:
SOL is not in a confirmed breakdown. It's currently testing whether $100 can become a higher-timeframe support level.
Above $104.40 → momentum can accelerate toward $110.60.
Above $110.60 → $118–$120 becomes the next major area.
Below $96.40 → bullish setup is invalidated.
Key level: $100.
Key breakout: $104.40.
Key resistance: $110.60.
Trade the confirmation, not the candle.
This is a technical setup, not financial advice. Manage position size and risk accordingly.
#SOL #Solana #SOLUSDT #cryptouniverseofficial yptoTrading #TechnicalAnalysis #Binance #BinanceCommunity #Altcoins
$SOL
{spot}(SOLUSDT)
SOL/USDT — TRADE SETUP
SOL/USDT — TRADE SETUP
SOL is currently trading around $100, after pulling back from the recent $110.60 swing high.
The broader daily structure remains constructive, but short-term momentum has weakened. Price is currently below the 7-day MA at $103.69, while holding well above the 25-day MA at $88.49 and 99-day MA at $77.92.
That makes the $100 area the key decision zone.
Technical Structure
Support
• $100–$98.30 — immediate support
• $96.50 — key invalidation area
• $94–$95 — next downside zone
• $88–$90 — major daily support
Resistance
• $103.70–$104.40 — first breakout zone
• $110.60 — recent swing high
• $115–$120 — next upside targets if momentum expands
Trade Idea — Long
Entry: $99.50–$101.50
Stop-Loss: $96.40
Target 1: $104.40
Target 2: $110.60
Target 3: $118–$120
Approximate risk/reward from a $100 entry:
T1: ~1.4R
T2: ~3.4R
T3: ~5.7R
The Trigger
I would not chase SOL at resistance.
The cleaner setup is either:
1. SOL holds the $99–$100 zone and starts reclaiming $103.70, or
2. SOL breaks and closes above $104.40 with convincing volume.
A daily close below $96.40–$97 would weaken this bullish setup and increase the probability of a move toward $94–$95.
Why the setup is interesting
Solana's fundamental backdrop remains supportive. U.S. spot SOL ETFs have continued attracting capital, while recent reports put cumulative ETF inflows around the $1.2B area. Solana's upcoming Alpenglow upgrade is also scheduled for late September, keeping the network's development story on the radar.
My technical read:
SOL is not in a confirmed breakdown. It's currently testing whether $100 can become a higher-timeframe support level.
Above $104.40 → momentum can accelerate toward $110.60.
Above $110.60 → $118–$120 becomes the next major area.
Below $96.40 → bullish setup is invalidated.
Key level: $100.
Key breakout: $104.40.
Key resistance: $110.60.
Trade the confirmation, not the candle.
This is a technical setup, not financial advice. Manage position size and risk accordingly.
#SOL #Solana #SOLUSDT #cryptouniverseofficial yptoTrading #TechnicalAnalysis #Binance #BinanceCommunity #Altcoins
$SOL
SOL is currently trading around $100, after pulling back from the recent $110.60 swing high.
The broader daily structure remains constructive, but short-term momentum has weakened. Price is currently below the 7-day MA at $103.69, while holding well above the 25-day MA at $88.49 and 99-day MA at $77.92.
That makes the $100 area the key decision zone.
Technical Structure
Support
• $100–$98.30 — immediate support
• $96.50 — key invalidation area
• $94–$95 — next downside zone
• $88–$90 — major daily support
Resistance
• $103.70–$104.40 — first breakout zone
• $110.60 — recent swing high
• $115–$120 — next upside targets if momentum expands
Trade Idea — Long
Entry: $99.50–$101.50
Stop-Loss: $96.40
Target 1: $104.40
Target 2: $110.60
Target 3: $118–$120
Approximate risk/reward from a $100 entry:
T1: ~1.4R
T2: ~3.4R
T3: ~5.7R
The Trigger
I would not chase SOL at resistance.
The cleaner setup is either:
1. SOL holds the $99–$100 zone and starts reclaiming $103.70, or
2. SOL breaks and closes above $104.40 with convincing volume.
A daily close below $96.40–$97 would weaken this bullish setup and increase the probability of a move toward $94–$95.
Why the setup is interesting
Solana's fundamental backdrop remains supportive. U.S. spot SOL ETFs have continued attracting capital, while recent reports put cumulative ETF inflows around the $1.2B area. Solana's upcoming Alpenglow upgrade is also scheduled for late September, keeping the network's development story on the radar.
My technical read:
SOL is not in a confirmed breakdown. It's currently testing whether $100 can become a higher-timeframe support level.
Above $104.40 → momentum can accelerate toward $110.60.
Above $110.60 → $118–$120 becomes the next major area.
Below $96.40 → bullish setup is invalidated.
Key level: $100.
Key breakout: $104.40.
Key resistance: $110.60.
Trade the confirmation, not the candle.
This is a technical setup, not financial advice. Manage position size and risk accordingly.
#SOL #Solana #SOLUSDT #cryptouniverseofficial yptoTrading #TechnicalAnalysis #Binance #BinanceCommunity #Altcoins
$SOL
30
SOL/USDT — SIMPLE TRADE SETUP
SOL is trading near $100, with the daily chart still showing a broader bullish structure, but short-term momentum has weakened.
Trade idea: LONG
🟢 Entry: $99–$101
🛑 Stop: Below $96.40
🎯 TP1: $104.40
🎯 TP2: $110.60
🎯 TP3: $118–$120
Key levels:
Support → $98–$100
Breakout → $104.40
Major resistance → $110.60
The setup becomes stronger if SOL holds $100 and reclaims $104.40 with volume.
A daily breakdown below $96.40 would invalidate the bullish setup.
Simple plan: defend $100 → reclaim $104 → target $110+.
Don't chase the move. Wait for confirmation and manage risk.
Technical setup only, not financial advice.
#SOL #Solana #SOLUSDT
$SOL
{spot}(SOLUSDT)
SOL/USDT — SIMPLE TRADE SETUP
SOL is trading near $100, with the daily chart still showing a broader bullish structure, but short-term momentum has weakened.
Trade idea: LONG
🟢 Entry: $99–$101
🛑 Stop: Below $96.40
🎯 TP1: $104.40
🎯 TP2: $110.60
🎯 TP3: $118–$120
Key levels:
Support → $98–$100
Breakout → $104.40
Major resistance → $110.60
The setup becomes stronger if SOL holds $100 and reclaims $104.40 with volume.
A daily breakdown below $96.40 would invalidate the bullish setup.
Simple plan: defend $100 → reclaim $104 → target $110+.
Don't chase the move. Wait for confirmation and manage risk.
Technical setup only, not financial advice.
#SOL #Solana #SOLUSDT
$SOL
SOL is trading near $100, with the daily chart still showing a broader bullish structure, but short-term momentum has weakened.
Trade idea: LONG
🟢 Entry: $99–$101
🛑 Stop: Below $96.40
🎯 TP1: $104.40
🎯 TP2: $110.60
🎯 TP3: $118–$120
Key levels:
Support → $98–$100
Breakout → $104.40
Major resistance → $110.60
The setup becomes stronger if SOL holds $100 and reclaims $104.40 with volume.
A daily breakdown below $96.40 would invalidate the bullish setup.
Simple plan: defend $100 → reclaim $104 → target $110+.
Don't chase the move. Wait for confirmation and manage risk.
Technical setup only, not financial advice.
#SOL #Solana #SOLUSDT
$SOL
1
92
#ARBRises30%OnRobinhoodChainRevenue
Arbitrum (ARB) has repriced sharply higher, with the token gaining more than 30% as Robinhood Chain activity drives a new revenue narrative for the Arbitrum ecosystem.
The catalyst is straightforward: Robinhood Chain, built using Arbitrum technology, generated more than $2 million in 24-hour transaction revenue, while its revenue-sharing structure directs 10% of net protocol revenue back to the Arbitrum ecosystem.
This matters because the market is beginning to focus on actual economic activity, rather than ARB being valued primarily as a governance asset.
From a trading perspective, the move deserves some caution. Futures activity and open interest have increased sharply, meaning leverage is now a significant part of the rally. ARB has also moved quickly from a prolonged consolidation range, so a period of profit-taking or consolidation would not be surprising.
Key levels to monitor:
- $0.105–$0.11: near-term support zone
- $0.12: immediate resistance
- $0.14–$0.15: next major upside area
- A sustained move above resistance would strengthen the breakout structure.
The bigger question is whether Robinhood Chain can maintain this level of revenue and activity after current incentives normalize.
For ARB, this is an important fundamental development—but the next phase will be about proving that the revenue is sustainable, not simply trading the headline.
#ARB #Arbitrum #Robinhood #Ethereum #Layer2 #DeFi #Crypto #Altcoins #BinanceCommunity
#ARBRises30%OnRobinhoodChainRevenue
Arbitrum (ARB) has repriced sharply higher, with the token gaining more than 30% as Robinhood Chain activity drives a new revenue narrative for the Arbitrum ecosystem.
The catalyst is straightforward: Robinhood Chain, built using Arbitrum technology, generated more than $2 million in 24-hour transaction revenue, while its revenue-sharing structure directs 10% of net protocol revenue back to the Arbitrum ecosystem.
This matters because the market is beginning to focus on actual economic activity, rather than ARB being valued primarily as a governance asset.
From a trading perspective, the move deserves some caution. Futures activity and open interest have increased sharply, meaning leverage is now a significant part of the rally. ARB has also moved quickly from a prolonged consolidation range, so a period of profit-taking or consolidation would not be surprising.
Key levels to monitor:
- $0.105–$0.11: near-term support zone
- $0.12: immediate resistance
- $0.14–$0.15: next major upside area
- A sustained move above resistance would strengthen the breakout structure.
The bigger question is whether Robinhood Chain can maintain this level of revenue and activity after current incentives normalize.
For ARB, this is an important fundamental development—but the next phase will be about proving that the revenue is sustainable, not simply trading the headline.
#ARB #Arbitrum #Robinhood #Ethereum #Layer2 #DeFi #Crypto #Altcoins #BinanceCommunity
Arbitrum (ARB) has repriced sharply higher, with the token gaining more than 30% as Robinhood Chain activity drives a new revenue narrative for the Arbitrum ecosystem.
The catalyst is straightforward: Robinhood Chain, built using Arbitrum technology, generated more than $2 million in 24-hour transaction revenue, while its revenue-sharing structure directs 10% of net protocol revenue back to the Arbitrum ecosystem.
This matters because the market is beginning to focus on actual economic activity, rather than ARB being valued primarily as a governance asset.
From a trading perspective, the move deserves some caution. Futures activity and open interest have increased sharply, meaning leverage is now a significant part of the rally. ARB has also moved quickly from a prolonged consolidation range, so a period of profit-taking or consolidation would not be surprising.
Key levels to monitor:
- $0.105–$0.11: near-term support zone
- $0.12: immediate resistance
- $0.14–$0.15: next major upside area
- A sustained move above resistance would strengthen the breakout structure.
The bigger question is whether Robinhood Chain can maintain this level of revenue and activity after current incentives normalize.
For ARB, this is an important fundamental development—but the next phase will be about proving that the revenue is sustainable, not simply trading the headline.
#ARB #Arbitrum #Robinhood #Ethereum #Layer2 #DeFi #Crypto #Altcoins #BinanceCommunity
41
#Japan10YYieldHits3%FirstSince1996
🚨 Japan’s 10-Year Bond Yield Hits 3% — First Time Since 1996
Japan’s benchmark 10Y JGB yield briefly touched 3.00%, marking a level not seen since 1996.
This is more than a Japan story.
📈 Why markets care:
• Higher JGB yields increase global borrowing costs
• Rising inflation + fiscal concerns are pressuring Japanese bonds
• Markets are pricing greater odds of further BOJ tightening
• A stronger yield environment can reduce demand for risk assets
• Global bond yields are rising at the same time, increasing pressure on equities and crypto
For crypto traders, the key takeaway is liquidity.
If global yields continue moving higher, Bitcoin and high-beta altcoins could face additional volatility. But if yields stabilize, risk assets may regain momentum.
👀 What I’m watching now:
🇯🇵 Japan 10Y yield
💵 USD/JPY
🏦 BOJ rate expectations
🇺🇸 US 10Y Treasury yield
₿ Bitcoin’s reaction to rising global yields
The bond market is sending a message: global liquidity conditions are changing.
#Bitcoin #Crypto #Japan #JGB #BOJ #BondMarket #BTC #Macro #BinanceCommunity
#Japan10YYieldHits3%FirstSince1996
🚨 Japan’s 10-Year Bond Yield Hits 3% — First Time Since 1996
Japan’s benchmark 10Y JGB yield briefly touched 3.00%, marking a level not seen since 1996.
This is more than a Japan story.
📈 Why markets care:
• Higher JGB yields increase global borrowing costs
• Rising inflation + fiscal concerns are pressuring Japanese bonds
• Markets are pricing greater odds of further BOJ tightening
• A stronger yield environment can reduce demand for risk assets
• Global bond yields are rising at the same time, increasing pressure on equities and crypto
For crypto traders, the key takeaway is liquidity.
If global yields continue moving higher, Bitcoin and high-beta altcoins could face additional volatility. But if yields stabilize, risk assets may regain momentum.
👀 What I’m watching now:
🇯🇵 Japan 10Y yield
💵 USD/JPY
🏦 BOJ rate expectations
🇺🇸 US 10Y Treasury yield
₿ Bitcoin’s reaction to rising global yields
The bond market is sending a message: global liquidity conditions are changing.
#Bitcoin #Crypto #Japan #JGB #BOJ #BondMarket #BTC #Macro #BinanceCommunity
🚨 Japan’s 10-Year Bond Yield Hits 3% — First Time Since 1996
Japan’s benchmark 10Y JGB yield briefly touched 3.00%, marking a level not seen since 1996.
This is more than a Japan story.
📈 Why markets care:
• Higher JGB yields increase global borrowing costs
• Rising inflation + fiscal concerns are pressuring Japanese bonds
• Markets are pricing greater odds of further BOJ tightening
• A stronger yield environment can reduce demand for risk assets
• Global bond yields are rising at the same time, increasing pressure on equities and crypto
For crypto traders, the key takeaway is liquidity.
If global yields continue moving higher, Bitcoin and high-beta altcoins could face additional volatility. But if yields stabilize, risk assets may regain momentum.
👀 What I’m watching now:
🇯🇵 Japan 10Y yield
💵 USD/JPY
🏦 BOJ rate expectations
🇺🇸 US 10Y Treasury yield
₿ Bitcoin’s reaction to rising global yields
The bond market is sending a message: global liquidity conditions are changing.
#Bitcoin #Crypto #Japan #JGB #BOJ #BondMarket #BTC #Macro #BinanceCommunity
51
Article
Crypto Market Today₿ Crypto Market Today: Bitcoin Tests $77K–$78K as September Starts With a Macro Battle
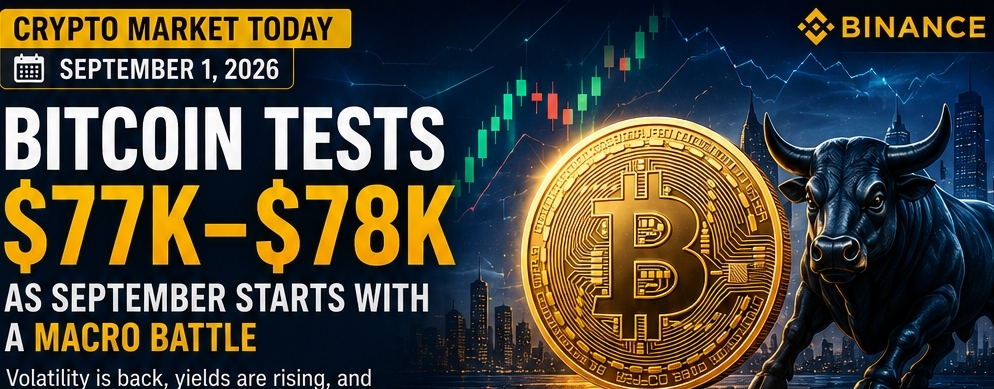
September has started exactly how traders would prefer it not to: strong volatility, rising Treasury yields and a market that is still trying to decide whether the late-August rally has further room to run.
Bitcoin is trading around $77K–$78K, below the recently reclaimed $80K level, while Ethereum is around $2.4K and Solana is near $100. The broader crypto market remains sizeable at roughly $2.69 trillion, with Bitcoin dominance around 57.8%.
CoinDesk +1
But the interesting part isn't today's red candle. The real story is what is happening underneath the market.
The $80K level is still the line in the sand
Bitcoin's August rally was impressive, but BTC has not yet managed to turn $80K into solid support.
For me, the chart is currently more about range management than chasing momentum.
A clean move back above $80K would improve the short-term structure and put the late-August highs back into focus. On the other hand, repeated rejection around $80K followed by a break below the recent $77K area would tell us that sellers are still willing to defend higher levels.
The important thing is not to confuse a pullback with a trend reversal.
Bitcoin is still roughly 20% higher over the past month, according to current market data.
CoinDesk
ETF flows are giving the market something to work with
This is probably the most constructive part of the current setup.
U.S. spot Bitcoin ETFs saw approximately $216.7 million of net inflows on August 31, led by BlackRock's IBIT with about $205.9 million. Ethereum ETFs also recorded approximately $87.7 million, extending their positive streak to 11 sessions.
FinanceFeeds
Even more interesting is that institutional interest is no longer restricted to BTC.
Ether, XRP and Solana products have continued to attract capital, suggesting that investors are becoming more comfortable expressing risk through different parts of the crypto market.
LCX
That is a much healthier market structure than simply having retail traders push prices higher with leverage.
But macro is fighting the bulls
This is where things get complicated.
U.S. Treasury yields have been climbing, with the 10-year yield reaching around 4.8% as inflation concerns and geopolitical tensions pushed investors toward a more cautious view of monetary policy.
Reuters
Markets are also pricing a significantly higher probability of a September Fed rate hike than they were before the recent hawkish comments from Fed Chair Kevin Warsh.
That matters because crypto remains highly sensitive to liquidity.
Higher yields → stronger dollar → tighter financial conditions → pressure on risk assets.
And Bitcoin is still trading below $80K.
So, despite the positive ETF flows, I wouldn't ignore the macro headwind.
Altcoins are quietly becoming more interesting
One thing I am watching closely is capital rotation.
Bitcoin has cooled after its August rally, while some large-cap altcoins are showing relative strength. Recent data shows Ethereum, XRP and Solana funds continuing their inflow streaks even while Bitcoin's ETF flows briefly turned negative before rebounding.
LCX +1
That doesn't automatically mean an altseason is starting.
But it does suggest that institutional crypto exposure is becoming broader.
Solana is particularly interesting here. Its BSOL product has now crossed $1 billion in assets, another sign that institutional access to assets beyond BTC and ETH is becoming more established.
Coinpaper
Russia is adding another piece to the adoption story
Russia's new crypto framework also took effect on September 1, bringing Bitcoin, Ethereum and USDT into a regulated market framework.
TradingView
This is worth watching because regulation is gradually moving from the question of “Should crypto exist?” toward “How should crypto be integrated into the financial system?”
That shift matters.
The long-term crypto story is increasingly about ETFs, stablecoins, tokenization, custody, regulated exchanges and institutional infrastructure—not just speculation.
What I'm watching now
For the next few sessions, I would keep the dashboard simple:
₿ BTC: Can it reclaim and hold $80K?
💵 Dollar: Does dollar strength continue?
🇺🇸 2Y/10Y Treasury yields: Do yields keep rising?
🏦 ETF flows: Does institutional buying continue?
⚡ ETH/SOL/XRP: Can altcoins maintain relative strength?
📊 Leverage: Are traders becoming too aggressive again?
If BTC breaks $80K with strong spot demand and ETF inflows, I would take that seriously.
If it repeatedly fails there while yields and the dollar continue climbing, I would expect more range trading and potentially another liquidity flush.
My take
I'm not bearish here—but I'm not chasing either.
The market has already delivered a strong August rally. September needs to prove that this is more than just a short-term momentum move.
The bullish case is still alive: institutional flows are returning, ETF demand remains broad, and crypto adoption continues expanding.
The problem is the macro environment.
Until Treasury yields calm down, Bitcoin needs to prove that it can absorb higher rates and still attract buyers.
That's the setup I want to see.
$80K is the battleground. ETF flows are the fuel. Macro liquidity is the referee.
And if Bitcoin wins that battle, September could become a very interesting month for crypto. 🚀
Not financial advice. Crypto markets are volatile; manage leverage and risk accordingly.
#Bitcoin #BTC #Ethereum #ETH #Solana #SOL #XRP #Crypto #CryptoMarket #BitcoinETF #EthereumETF #Altcoins #Fed #TreasuryYields #cryptouniverseofficial toNews #InstitutionalInvestors #BinanceCommunity #September2026
Crypto Market Today
₿ Crypto Market Today: Bitcoin Tests $77K–$78K as September Starts With a Macro Battle
September has started exactly how traders would prefer it not to: strong volatility, rising Treasury yields and a market that is still trying to decide whether the late-August rally has further room to run.
Bitcoin is trading around $77K–$78K, below the recently reclaimed $80K level, while Ethereum is around $2.4K and Solana is near $100. The broader crypto market remains sizeable at roughly $2.69 trillion, with Bitcoin dominance around 57.8%.
CoinDesk +1
But the interesting part isn't today's red candle. The real story is what is happening underneath the market.
The $80K level is still the line in the sand
Bitcoin's August rally was impressive, but BTC has not yet managed to turn $80K into solid support.
For me, the chart is currently more about range management than chasing momentum.
A clean move back above $80K would improve the short-term structure and put the late-August highs back into focus. On the other hand, repeated rejection around $80K followed by a break below the recent $77K area would tell us that sellers are still willing to defend higher levels.
The important thing is not to confuse a pullback with a trend reversal.
Bitcoin is still roughly 20% higher over the past month, according to current market data.
CoinDesk
ETF flows are giving the market something to work with
This is probably the most constructive part of the current setup.
U.S. spot Bitcoin ETFs saw approximately $216.7 million of net inflows on August 31, led by BlackRock's IBIT with about $205.9 million. Ethereum ETFs also recorded approximately $87.7 million, extending their positive streak to 11 sessions.
FinanceFeeds
Even more interesting is that institutional interest is no longer restricted to BTC.
Ether, XRP and Solana products have continued to attract capital, suggesting that investors are becoming more comfortable expressing risk through different parts of the crypto market.
LCX
That is a much healthier market structure than simply having retail traders push prices higher with leverage.
But macro is fighting the bulls
This is where things get complicated.
U.S. Treasury yields have been climbing, with the 10-year yield reaching around 4.8% as inflation concerns and geopolitical tensions pushed investors toward a more cautious view of monetary policy.
Reuters
Markets are also pricing a significantly higher probability of a September Fed rate hike than they were before the recent hawkish comments from Fed Chair Kevin Warsh.
That matters because crypto remains highly sensitive to liquidity.
Higher yields → stronger dollar → tighter financial conditions → pressure on risk assets.
And Bitcoin is still trading below $80K.
So, despite the positive ETF flows, I wouldn't ignore the macro headwind.
Altcoins are quietly becoming more interesting
One thing I am watching closely is capital rotation.
Bitcoin has cooled after its August rally, while some large-cap altcoins are showing relative strength. Recent data shows Ethereum, XRP and Solana funds continuing their inflow streaks even while Bitcoin's ETF flows briefly turned negative before rebounding.
LCX +1
That doesn't automatically mean an altseason is starting.
But it does suggest that institutional crypto exposure is becoming broader.
Solana is particularly interesting here. Its BSOL product has now crossed $1 billion in assets, another sign that institutional access to assets beyond BTC and ETH is becoming more established.
Coinpaper
Russia is adding another piece to the adoption story
Russia's new crypto framework also took effect on September 1, bringing Bitcoin, Ethereum and USDT into a regulated market framework.
TradingView
This is worth watching because regulation is gradually moving from the question of “Should crypto exist?” toward “How should crypto be integrated into the financial system?”
That shift matters.
The long-term crypto story is increasingly about ETFs, stablecoins, tokenization, custody, regulated exchanges and institutional infrastructure—not just speculation.
What I'm watching now
For the next few sessions, I would keep the dashboard simple:
₿ BTC: Can it reclaim and hold $80K?
💵 Dollar: Does dollar strength continue?
🇺🇸 2Y/10Y Treasury yields: Do yields keep rising?
🏦 ETF flows: Does institutional buying continue?
⚡ ETH/SOL/XRP: Can altcoins maintain relative strength?
📊 Leverage: Are traders becoming too aggressive again?
If BTC breaks $80K with strong spot demand and ETF inflows, I would take that seriously.
If it repeatedly fails there while yields and the dollar continue climbing, I would expect more range trading and potentially another liquidity flush.
My take
I'm not bearish here—but I'm not chasing either.
The market has already delivered a strong August rally. September needs to prove that this is more than just a short-term momentum move.
The bullish case is still alive: institutional flows are returning, ETF demand remains broad, and crypto adoption continues expanding.
The problem is the macro environment.
Until Treasury yields calm down, Bitcoin needs to prove that it can absorb higher rates and still attract buyers.
That's the setup I want to see.
$80K is the battleground. ETF flows are the fuel. Macro liquidity is the referee.
And if Bitcoin wins that battle, September could become a very interesting month for crypto. 🚀
Not financial advice. Crypto markets are volatile; manage leverage and risk accordingly.
#Bitcoin #BTC #Ethereum #ETH #Solana #SOL #XRP #Crypto #CryptoMarket #BitcoinETF #EthereumETF #Altcoins #Fed #TreasuryYields #cryptouniverseofficial toNews #InstitutionalInvestors #BinanceCommunity #September2026
September has started exactly how traders would prefer it not to: strong volatility, rising Treasury yields and a market that is still trying to decide whether the late-August rally has further room to run.
Bitcoin is trading around $77K–$78K, below the recently reclaimed $80K level, while Ethereum is around $2.4K and Solana is near $100. The broader crypto market remains sizeable at roughly $2.69 trillion, with Bitcoin dominance around 57.8%.
CoinDesk +1
But the interesting part isn't today's red candle. The real story is what is happening underneath the market.
The $80K level is still the line in the sand
Bitcoin's August rally was impressive, but BTC has not yet managed to turn $80K into solid support.
For me, the chart is currently more about range management than chasing momentum.
A clean move back above $80K would improve the short-term structure and put the late-August highs back into focus. On the other hand, repeated rejection around $80K followed by a break below the recent $77K area would tell us that sellers are still willing to defend higher levels.
The important thing is not to confuse a pullback with a trend reversal.
Bitcoin is still roughly 20% higher over the past month, according to current market data.
CoinDesk
ETF flows are giving the market something to work with
This is probably the most constructive part of the current setup.
U.S. spot Bitcoin ETFs saw approximately $216.7 million of net inflows on August 31, led by BlackRock's IBIT with about $205.9 million. Ethereum ETFs also recorded approximately $87.7 million, extending their positive streak to 11 sessions.
FinanceFeeds
Even more interesting is that institutional interest is no longer restricted to BTC.
Ether, XRP and Solana products have continued to attract capital, suggesting that investors are becoming more comfortable expressing risk through different parts of the crypto market.
LCX
That is a much healthier market structure than simply having retail traders push prices higher with leverage.
But macro is fighting the bulls
This is where things get complicated.
U.S. Treasury yields have been climbing, with the 10-year yield reaching around 4.8% as inflation concerns and geopolitical tensions pushed investors toward a more cautious view of monetary policy.
Reuters
Markets are also pricing a significantly higher probability of a September Fed rate hike than they were before the recent hawkish comments from Fed Chair Kevin Warsh.
That matters because crypto remains highly sensitive to liquidity.
Higher yields → stronger dollar → tighter financial conditions → pressure on risk assets.
And Bitcoin is still trading below $80K.
So, despite the positive ETF flows, I wouldn't ignore the macro headwind.
Altcoins are quietly becoming more interesting
One thing I am watching closely is capital rotation.
Bitcoin has cooled after its August rally, while some large-cap altcoins are showing relative strength. Recent data shows Ethereum, XRP and Solana funds continuing their inflow streaks even while Bitcoin's ETF flows briefly turned negative before rebounding.
LCX +1
That doesn't automatically mean an altseason is starting.
But it does suggest that institutional crypto exposure is becoming broader.
Solana is particularly interesting here. Its BSOL product has now crossed $1 billion in assets, another sign that institutional access to assets beyond BTC and ETH is becoming more established.
Coinpaper
Russia is adding another piece to the adoption story
Russia's new crypto framework also took effect on September 1, bringing Bitcoin, Ethereum and USDT into a regulated market framework.
TradingView
This is worth watching because regulation is gradually moving from the question of “Should crypto exist?” toward “How should crypto be integrated into the financial system?”
That shift matters.
The long-term crypto story is increasingly about ETFs, stablecoins, tokenization, custody, regulated exchanges and institutional infrastructure—not just speculation.
What I'm watching now
For the next few sessions, I would keep the dashboard simple:
₿ BTC: Can it reclaim and hold $80K?
💵 Dollar: Does dollar strength continue?
🇺🇸 2Y/10Y Treasury yields: Do yields keep rising?
🏦 ETF flows: Does institutional buying continue?
⚡ ETH/SOL/XRP: Can altcoins maintain relative strength?
📊 Leverage: Are traders becoming too aggressive again?
If BTC breaks $80K with strong spot demand and ETF inflows, I would take that seriously.
If it repeatedly fails there while yields and the dollar continue climbing, I would expect more range trading and potentially another liquidity flush.
My take
I'm not bearish here—but I'm not chasing either.
The market has already delivered a strong August rally. September needs to prove that this is more than just a short-term momentum move.
The bullish case is still alive: institutional flows are returning, ETF demand remains broad, and crypto adoption continues expanding.
The problem is the macro environment.
Until Treasury yields calm down, Bitcoin needs to prove that it can absorb higher rates and still attract buyers.
That's the setup I want to see.
$80K is the battleground. ETF flows are the fuel. Macro liquidity is the referee.
And if Bitcoin wins that battle, September could become a very interesting month for crypto. 🚀
Not financial advice. Crypto markets are volatile; manage leverage and risk accordingly.
#Bitcoin #BTC #Ethereum #ETH #Solana #SOL #XRP #Crypto #CryptoMarket #BitcoinETF #EthereumETF #Altcoins #Fed #TreasuryYields #cryptouniverseofficial toNews #InstitutionalInvestors #BinanceCommunity #September2026
172
#XRPRises40%InTwoWeeksAsOpenInterestFalls
🚀 XRP Rises 40% in Two Weeks as Open Interest Falls
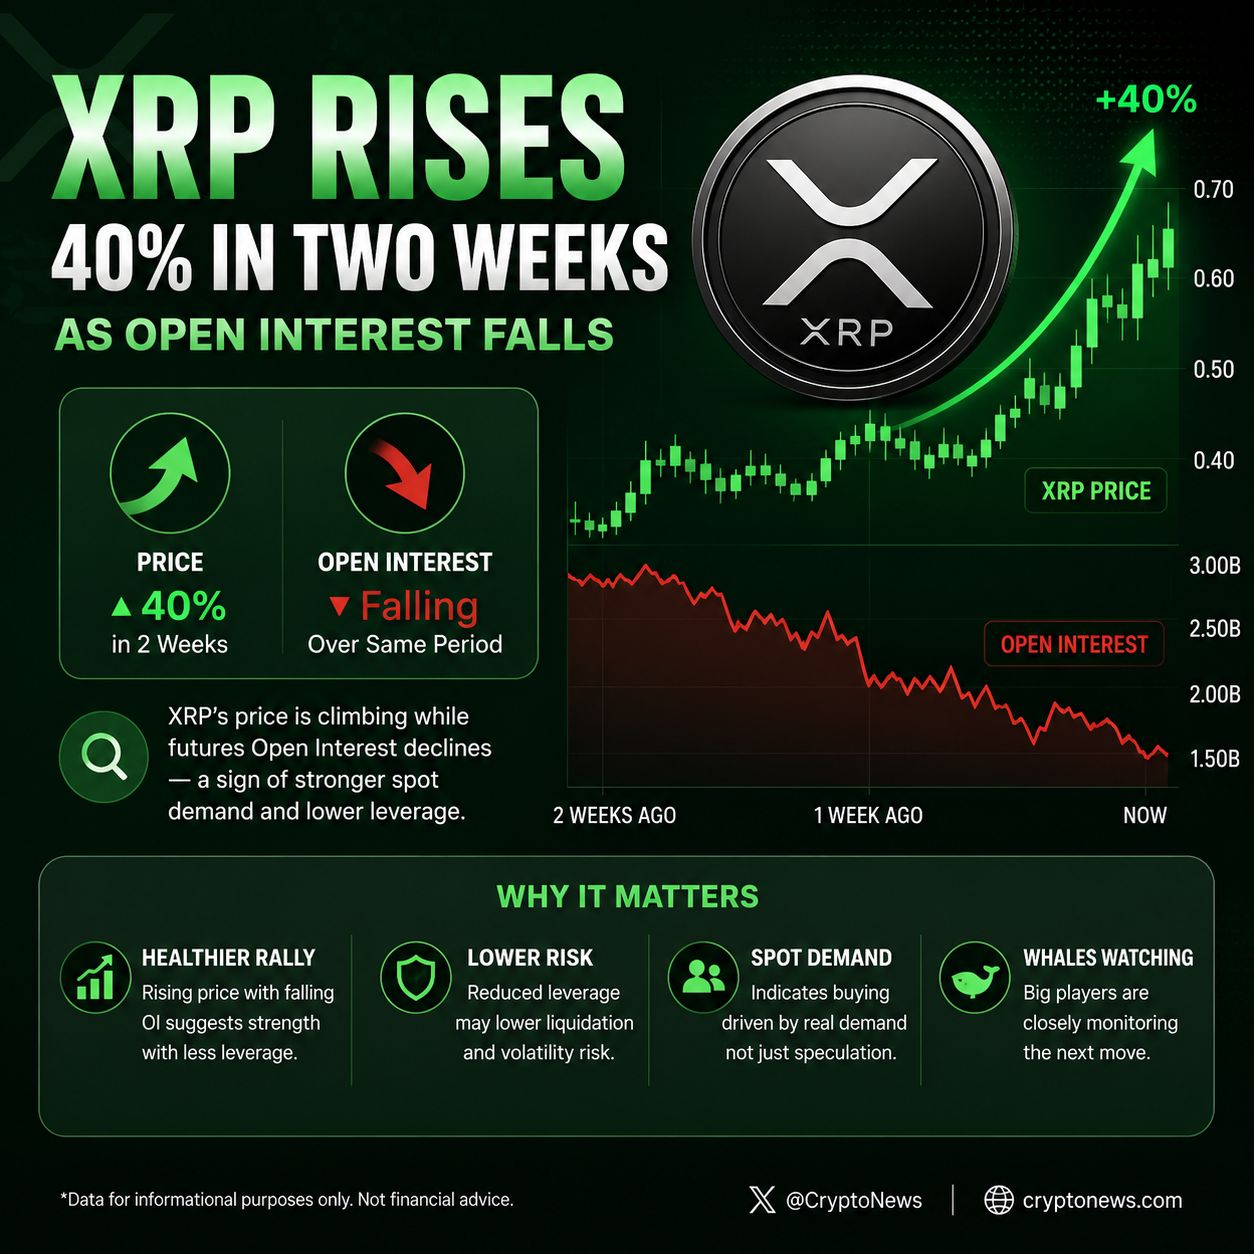
📈 XRP has surged nearly 40% over the past two weeks, while futures Open Interest (OI) has declined.
🔎 This divergence is notable: XRP’s price is rising even as leveraged positions decrease, potentially indicating that the move is being supported more by spot demand and reduced leverage rather than aggressive speculative positioning.
💡 Why it matters:
• 📈 +40% XRP rally in two weeks
• 📉 Falling Open Interest
• ⚖️ Lower leverage could reduce liquidation risk
• 🐋 Market participants are closely watching whether spot buying can sustain the momentum
🔥 If XRP continues climbing while OI remains controlled, the rally could signal a healthier market structure. However, a sharp rise in OI alongside price could increase volatility and liquidation risk.
#XRP #Ripple #Crypto #CryptoMarket #XRPUSD #Altcoins #Bitcoin #Trading #OpenInterest #CryptoNews
$XRP
{spot}(XRPUSDT)
#XRPRises40%InTwoWeeksAsOpenInterestFalls
🚀 XRP Rises 40% in Two Weeks as Open Interest Falls
📈 XRP has surged nearly 40% over the past two weeks, while futures Open Interest (OI) has declined.
🔎 This divergence is notable: XRP’s price is rising even as leveraged positions decrease, potentially indicating that the move is being supported more by spot demand and reduced leverage rather than aggressive speculative positioning.
💡 Why it matters:
• 📈 +40% XRP rally in two weeks
• 📉 Falling Open Interest
• ⚖️ Lower leverage could reduce liquidation risk
• 🐋 Market participants are closely watching whether spot buying can sustain the momentum
🔥 If XRP continues climbing while OI remains controlled, the rally could signal a healthier market structure. However, a sharp rise in OI alongside price could increase volatility and liquidation risk.
#XRP #Ripple #Crypto #CryptoMarket #XRPUSD #Altcoins #Bitcoin #Trading #OpenInterest #CryptoNews
$XRP
🚀 XRP Rises 40% in Two Weeks as Open Interest Falls
📈 XRP has surged nearly 40% over the past two weeks, while futures Open Interest (OI) has declined.
🔎 This divergence is notable: XRP’s price is rising even as leveraged positions decrease, potentially indicating that the move is being supported more by spot demand and reduced leverage rather than aggressive speculative positioning.
💡 Why it matters:
• 📈 +40% XRP rally in two weeks
• 📉 Falling Open Interest
• ⚖️ Lower leverage could reduce liquidation risk
• 🐋 Market participants are closely watching whether spot buying can sustain the momentum
🔥 If XRP continues climbing while OI remains controlled, the rally could signal a healthier market structure. However, a sharp rise in OI alongside price could increase volatility and liquidation risk.
#XRP #Ripple #Crypto #CryptoMarket #XRPUSD #Altcoins #Bitcoin #Trading #OpenInterest #CryptoNews
$XRP
92
Article
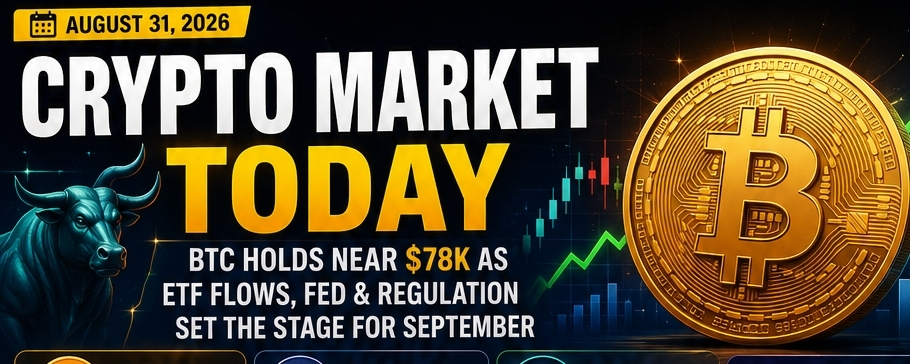
🚀 Crypto Market Today: Bitcoin Near $78K — ETFs, Fed & Regulation Set the Stage for SeptemberBitcoin Holds Near $78K as Fed, ETF Flows and Regulation Set the Stage for September
The crypto market is entering September with a mixed but highly significant setup. Bitcoin has pulled back from the $80,000 area, while institutional flows, Ethereum strength, regulatory developments and macroeconomic risks are creating a market where the next major move could depend heavily on U.S. monetary-policy expectations.
As of today, Bitcoin is trading around $78.6K, while Ethereum is around $2.47K. BTC is slightly lower over the past 24 hours, whereas both assets remain substantially higher than a month ago.
CoinGecko +1
🔥 1. Bitcoin: Strong August, but $80K Remains the Key Battle
Bitcoin has had a powerful August, gaining roughly 24% during the month, moving from the $60K region toward the $80K area.
BeInCrypto
However, BTC has struggled to establish a decisive breakout above $80K.
The current structure is therefore interesting:
$80K+ breakout → bullish continuation
$78K–$80K consolidation → potential accumulation
Loss of major support → deeper correction risk
Today's market is showing that $80,000 remains an important psychological and technical level. Bitcoin was recently quoted around $78,545, with traders watching upcoming U.S. economic data for clues about the Federal Reserve's next move.
Barron's
🏦 2. ETF Flows: Institutional Demand Is Still Important
One of the biggest developments of 2026 has been the growing role of U.S. spot crypto ETFs.
Bitcoin ETFs recently experienced a $201.9 million net outflow, ending a nine-session inflow streak that had brought approximately $3.04 billion into the funds.
CryptoSlate +1
At the same time, the broader institutional picture remains constructive.
Ethereum, XRP and Solana funds continued receiving capital during the same period, with those three categories collectively attracting roughly $145 million.
CryptoSlate
This is an important distinction:
Institutional demand has not disappeared; it has simply become more selective.
That could become particularly important for altcoins during the next phase of the market.
🟣 3. Ethereum Is Showing Relative Strength
Ethereum is trading around $2,470, and its recent performance has been stronger than Bitcoin's on several timeframes.
CoinDesk
Ethereum spot ETFs have also maintained a strong flow trend, with reports showing a 10-day inflow streak before the latest data point.
Crypto Daily
This creates an interesting possibility for September:
BTC → institutional store-of-value narrative
ETH → ETF + smart-contract + tokenization narrative
SOL → high-growth ecosystem + ETF narrative
The market could increasingly rotate between these themes instead of moving uniformly.
🟢 4. Solana Remains One of the Most Interesting Altcoins
Solana has been one of the strongest large-cap altcoins recently.
Reports indicate SOL gained around 40% during August, supported by network activity and ETF-related demand.
Pluang
That makes the $100 area particularly important.
If SOL can maintain that zone and regain momentum toward $110–$120, the altcoin market could receive another bullish signal.
However, traders should remember that SOL is more volatile than BTC and ETH, meaning a market-wide risk-off move can produce significantly larger percentage swings.
🇺🇸 5. The Biggest Threat: The Federal Reserve
The most important macro factor entering September is U.S. monetary policy.
Fed Chair Kevin Warsh's recent hawkish comments increased market expectations for a possible September rate hike. Reuters reported that the probability rose sharply following his Jackson Hole remarks, while Treasury yields also climbed.
Reuters
The U.S. 10-year Treasury yield reached around 4.76%, adding pressure to risk assets.
Reuters +1
For Bitcoin, the relationship is straightforward:
Higher yields + stronger dollar
⬇️
Less attractive liquidity environment
⬇️
Pressure on risk assets
⬇️
BTC/altcoin volatility
But there is another side.
If inflation and employment data weaken enough to reduce rate-hike expectations:
Lower yields + weaker dollar
⬇️
Improved liquidity expectations
⬇️
Potentially stronger risk appetite
⬇️
🚀 Bitcoin & crypto upside
This is why September's economic data could be more important than today's price movement.
⚖️ 6. Regulation Could Become a Major Bullish Catalyst
Another major theme is U.S. crypto regulation.
The CLARITY Act remains one of the most important pieces of legislation for the digital-asset industry, with a September Senate test becoming a key event for the market.
Bitcoin Foundation +1
If comprehensive market-structure legislation advances, it could provide greater clarity around:
Digital-asset classifications
SEC/CFTC jurisdiction
Exchanges
DeFi
Stablecoins
Institutional participation
Grayscale's research head Zach Pandl recently argued that a successful CLARITY Act could be particularly positive for Ethereum and Solana, potentially benefiting them more directly than Bitcoin.
TradingView
Therefore, regulation could become one of September's biggest crypto catalysts.
🇷🇺 7. Russia Is Also Expanding Its Crypto Market
Russia is preparing a regulated framework for cryptocurrency trading, and Sberbank reportedly estimates that regulated crypto-exchange trading could reach approximately 4 trillion rubles ($46.4 billion) during the first year.
The Block +1
This is significant because Russia represents another major economy moving toward a more formalized digital-asset market.
Combined with CBDC development and increasing institutional adoption globally, the direction of travel is clear:
Digital assets are becoming increasingly integrated into traditional financial infrastructure.
🌐 8. Tokenization Is Becoming a Bigger Theme
Another trend worth watching is real-world asset tokenization.
Traditional financial institutions are increasingly experimenting with tokenized funds, securities and financial infrastructure.
For example, Franklin Templeton recently partnered with HashKey Exchange to distribute a tokenized money-market fund in Asia.
The Block
This matters because the long-term crypto story is increasingly moving beyond simply:
“Bitcoin goes up or down.”
The bigger opportunity could involve:
Tokenized securities + stablecoins + blockchain settlement + digital funds + programmable finance.
📊 9. Leverage Is Still a Major Risk
Crypto derivatives remain highly leveraged, and today's market is showing the consequences.
Recent reports indicate approximately $245 million in crypto futures positions were liquidated during a 24-hour period as leveraged longs were squeezed.
Bitget
This is why even a relatively small Bitcoin move can trigger a much larger market reaction.
When leverage becomes excessive:
BTC falls → liquidations begin → forced selling → BTC falls further → more liquidations
The reverse can happen during a short squeeze.
Therefore, traders should watch open interest, funding rates and liquidation levels, not just spot prices.
🧭 What I'm Watching for September
🟢 Bullish Scenario
If:
BTC holds above major support
$80K is reclaimed decisively
ETF inflows strengthen
Treasury yields decline
Fed rate-hike expectations fall
CLARITY Act progress improves
ETH/SOL continue attracting institutional capital
then the market could enter another strong risk-on phase.
🔴 Bearish Scenario
If:
BTC repeatedly fails at $80K
Treasury yields continue rising
Dollar strengthens substantially
Fed becomes more hawkish
ETF outflows accelerate
Leverage builds again
then BTC could experience another significant correction, with altcoins potentially falling much faster.
🎯 The Big Picture
The crypto market is not simply bullish or bearish right now.
It is at an important transition point.
Bitcoin: strong August, but $80K remains a major hurdle.
Ethereum: benefiting from strong institutional interest.
Solana: showing impressive momentum and ecosystem strength.
ETFs: institutional demand remains significant but is becoming uneven.
Fed: the biggest short-term macro risk.
Regulation: potentially the biggest structural catalyst.
Tokenization: emerging as a major long-term adoption theme.
Leverage: remains the biggest source of short-term volatility.
🚀 September could therefore be one of the most important months of 2026 for crypto.
The key question isn't simply “Will Bitcoin go up?”
It is:
Can Bitcoin break $80K while liquidity, institutional demand and regulatory momentum remain supportive?
If the answer is yes, the market could be positioned for another major leg higher.
If macro conditions deteriorate, however, traders should expect sharp volatility before the next trend becomes clear.
₿ Stay focused on liquidity.
📊 Watch the macro.
🏦 Follow ETF flows.
⚖️ Track regulation.
🚀 Don't ignore the long-term adoption story.
This article is for market-information purposes only and is not financial advice. Crypto assets remain highly volatile.
#Bitcoin #BTC #Ethereum #ETH #Solana #SOL #Crypto #CryptoMarket #BitcoinETF #EthereumETF #DeFi #Stablecoins #Tokenization #CLARITYAct #FederalReserve #Fed #TreasuryYields #Altcoins #BinanceCommunity #CryptoNews
🚀 Crypto Market Today: Bitcoin Near $78K — ETFs, Fed & Regulation Set the Stage for September
Bitcoin Holds Near $78K as Fed, ETF Flows and Regulation Set the Stage for September
The crypto market is entering September with a mixed but highly significant setup. Bitcoin has pulled back from the $80,000 area, while institutional flows, Ethereum strength, regulatory developments and macroeconomic risks are creating a market where the next major move could depend heavily on U.S. monetary-policy expectations.
As of today, Bitcoin is trading around $78.6K, while Ethereum is around $2.47K. BTC is slightly lower over the past 24 hours, whereas both assets remain substantially higher than a month ago.
CoinGecko +1
🔥 1. Bitcoin: Strong August, but $80K Remains the Key Battle
Bitcoin has had a powerful August, gaining roughly 24% during the month, moving from the $60K region toward the $80K area.
BeInCrypto
However, BTC has struggled to establish a decisive breakout above $80K.
The current structure is therefore interesting:
$80K+ breakout → bullish continuation
$78K–$80K consolidation → potential accumulation
Loss of major support → deeper correction risk
Today's market is showing that $80,000 remains an important psychological and technical level. Bitcoin was recently quoted around $78,545, with traders watching upcoming U.S. economic data for clues about the Federal Reserve's next move.
Barron's
🏦 2. ETF Flows: Institutional Demand Is Still Important
One of the biggest developments of 2026 has been the growing role of U.S. spot crypto ETFs.
Bitcoin ETFs recently experienced a $201.9 million net outflow, ending a nine-session inflow streak that had brought approximately $3.04 billion into the funds.
CryptoSlate +1
At the same time, the broader institutional picture remains constructive.
Ethereum, XRP and Solana funds continued receiving capital during the same period, with those three categories collectively attracting roughly $145 million.
CryptoSlate
This is an important distinction:
Institutional demand has not disappeared; it has simply become more selective.
That could become particularly important for altcoins during the next phase of the market.
🟣 3. Ethereum Is Showing Relative Strength
Ethereum is trading around $2,470, and its recent performance has been stronger than Bitcoin's on several timeframes.
CoinDesk
Ethereum spot ETFs have also maintained a strong flow trend, with reports showing a 10-day inflow streak before the latest data point.
Crypto Daily
This creates an interesting possibility for September:
BTC → institutional store-of-value narrative
ETH → ETF + smart-contract + tokenization narrative
SOL → high-growth ecosystem + ETF narrative
The market could increasingly rotate between these themes instead of moving uniformly.
🟢 4. Solana Remains One of the Most Interesting Altcoins
Solana has been one of the strongest large-cap altcoins recently.
Reports indicate SOL gained around 40% during August, supported by network activity and ETF-related demand.
Pluang
That makes the $100 area particularly important.
If SOL can maintain that zone and regain momentum toward $110–$120, the altcoin market could receive another bullish signal.
However, traders should remember that SOL is more volatile than BTC and ETH, meaning a market-wide risk-off move can produce significantly larger percentage swings.
🇺🇸 5. The Biggest Threat: The Federal Reserve
The most important macro factor entering September is U.S. monetary policy.
Fed Chair Kevin Warsh's recent hawkish comments increased market expectations for a possible September rate hike. Reuters reported that the probability rose sharply following his Jackson Hole remarks, while Treasury yields also climbed.
Reuters
The U.S. 10-year Treasury yield reached around 4.76%, adding pressure to risk assets.
Reuters +1
For Bitcoin, the relationship is straightforward:
Higher yields + stronger dollar
⬇️
Less attractive liquidity environment
⬇️
Pressure on risk assets
⬇️
BTC/altcoin volatility
But there is another side.
If inflation and employment data weaken enough to reduce rate-hike expectations:
Lower yields + weaker dollar
⬇️
Improved liquidity expectations
⬇️
Potentially stronger risk appetite
⬇️
🚀 Bitcoin & crypto upside
This is why September's economic data could be more important than today's price movement.
⚖️ 6. Regulation Could Become a Major Bullish Catalyst
Another major theme is U.S. crypto regulation.
The CLARITY Act remains one of the most important pieces of legislation for the digital-asset industry, with a September Senate test becoming a key event for the market.
Bitcoin Foundation +1
If comprehensive market-structure legislation advances, it could provide greater clarity around:
Digital-asset classifications
SEC/CFTC jurisdiction
Exchanges
DeFi
Stablecoins
Institutional participation
Grayscale's research head Zach Pandl recently argued that a successful CLARITY Act could be particularly positive for Ethereum and Solana, potentially benefiting them more directly than Bitcoin.
TradingView
Therefore, regulation could become one of September's biggest crypto catalysts.
🇷🇺 7. Russia Is Also Expanding Its Crypto Market
Russia is preparing a regulated framework for cryptocurrency trading, and Sberbank reportedly estimates that regulated crypto-exchange trading could reach approximately 4 trillion rubles ($46.4 billion) during the first year.
The Block +1
This is significant because Russia represents another major economy moving toward a more formalized digital-asset market.
Combined with CBDC development and increasing institutional adoption globally, the direction of travel is clear:
Digital assets are becoming increasingly integrated into traditional financial infrastructure.
🌐 8. Tokenization Is Becoming a Bigger Theme
Another trend worth watching is real-world asset tokenization.
Traditional financial institutions are increasingly experimenting with tokenized funds, securities and financial infrastructure.
For example, Franklin Templeton recently partnered with HashKey Exchange to distribute a tokenized money-market fund in Asia.
The Block
This matters because the long-term crypto story is increasingly moving beyond simply:
“Bitcoin goes up or down.”
The bigger opportunity could involve:
Tokenized securities + stablecoins + blockchain settlement + digital funds + programmable finance.
📊 9. Leverage Is Still a Major Risk
Crypto derivatives remain highly leveraged, and today's market is showing the consequences.
Recent reports indicate approximately $245 million in crypto futures positions were liquidated during a 24-hour period as leveraged longs were squeezed.
Bitget
This is why even a relatively small Bitcoin move can trigger a much larger market reaction.
When leverage becomes excessive:
BTC falls → liquidations begin → forced selling → BTC falls further → more liquidations
The reverse can happen during a short squeeze.
Therefore, traders should watch open interest, funding rates and liquidation levels, not just spot prices.
🧭 What I'm Watching for September
🟢 Bullish Scenario
If:
BTC holds above major support
$80K is reclaimed decisively
ETF inflows strengthen
Treasury yields decline
Fed rate-hike expectations fall
CLARITY Act progress improves
ETH/SOL continue attracting institutional capital
then the market could enter another strong risk-on phase.
🔴 Bearish Scenario
If:
BTC repeatedly fails at $80K
Treasury yields continue rising
Dollar strengthens substantially
Fed becomes more hawkish
ETF outflows accelerate
Leverage builds again
then BTC could experience another significant correction, with altcoins potentially falling much faster.
🎯 The Big Picture
The crypto market is not simply bullish or bearish right now.
It is at an important transition point.
Bitcoin: strong August, but $80K remains a major hurdle.
Ethereum: benefiting from strong institutional interest.
Solana: showing impressive momentum and ecosystem strength.
ETFs: institutional demand remains significant but is becoming uneven.
Fed: the biggest short-term macro risk.
Regulation: potentially the biggest structural catalyst.
Tokenization: emerging as a major long-term adoption theme.
Leverage: remains the biggest source of short-term volatility.
🚀 September could therefore be one of the most important months of 2026 for crypto.
The key question isn't simply “Will Bitcoin go up?”
It is:
Can Bitcoin break $80K while liquidity, institutional demand and regulatory momentum remain supportive?
If the answer is yes, the market could be positioned for another major leg higher.
If macro conditions deteriorate, however, traders should expect sharp volatility before the next trend becomes clear.
₿ Stay focused on liquidity.
📊 Watch the macro.
🏦 Follow ETF flows.
⚖️ Track regulation.
🚀 Don't ignore the long-term adoption story.
This article is for market-information purposes only and is not financial advice. Crypto assets remain highly volatile.
#Bitcoin #BTC #Ethereum #ETH #Solana #SOL #Crypto #CryptoMarket #BitcoinETF #EthereumETF #DeFi #Stablecoins #Tokenization #CLARITYAct #FederalReserve #Fed #TreasuryYields #Altcoins #BinanceCommunity #CryptoNews
The crypto market is entering September with a mixed but highly significant setup. Bitcoin has pulled back from the $80,000 area, while institutional flows, Ethereum strength, regulatory developments and macroeconomic risks are creating a market where the next major move could depend heavily on U.S. monetary-policy expectations.
As of today, Bitcoin is trading around $78.6K, while Ethereum is around $2.47K. BTC is slightly lower over the past 24 hours, whereas both assets remain substantially higher than a month ago.
CoinGecko +1
🔥 1. Bitcoin: Strong August, but $80K Remains the Key Battle
Bitcoin has had a powerful August, gaining roughly 24% during the month, moving from the $60K region toward the $80K area.
BeInCrypto
However, BTC has struggled to establish a decisive breakout above $80K.
The current structure is therefore interesting:
$80K+ breakout → bullish continuation
$78K–$80K consolidation → potential accumulation
Loss of major support → deeper correction risk
Today's market is showing that $80,000 remains an important psychological and technical level. Bitcoin was recently quoted around $78,545, with traders watching upcoming U.S. economic data for clues about the Federal Reserve's next move.
Barron's
🏦 2. ETF Flows: Institutional Demand Is Still Important
One of the biggest developments of 2026 has been the growing role of U.S. spot crypto ETFs.
Bitcoin ETFs recently experienced a $201.9 million net outflow, ending a nine-session inflow streak that had brought approximately $3.04 billion into the funds.
CryptoSlate +1
At the same time, the broader institutional picture remains constructive.
Ethereum, XRP and Solana funds continued receiving capital during the same period, with those three categories collectively attracting roughly $145 million.
CryptoSlate
This is an important distinction:
Institutional demand has not disappeared; it has simply become more selective.
That could become particularly important for altcoins during the next phase of the market.
🟣 3. Ethereum Is Showing Relative Strength
Ethereum is trading around $2,470, and its recent performance has been stronger than Bitcoin's on several timeframes.
CoinDesk
Ethereum spot ETFs have also maintained a strong flow trend, with reports showing a 10-day inflow streak before the latest data point.
Crypto Daily
This creates an interesting possibility for September:
BTC → institutional store-of-value narrative
ETH → ETF + smart-contract + tokenization narrative
SOL → high-growth ecosystem + ETF narrative
The market could increasingly rotate between these themes instead of moving uniformly.
🟢 4. Solana Remains One of the Most Interesting Altcoins
Solana has been one of the strongest large-cap altcoins recently.
Reports indicate SOL gained around 40% during August, supported by network activity and ETF-related demand.
Pluang
That makes the $100 area particularly important.
If SOL can maintain that zone and regain momentum toward $110–$120, the altcoin market could receive another bullish signal.
However, traders should remember that SOL is more volatile than BTC and ETH, meaning a market-wide risk-off move can produce significantly larger percentage swings.
🇺🇸 5. The Biggest Threat: The Federal Reserve
The most important macro factor entering September is U.S. monetary policy.
Fed Chair Kevin Warsh's recent hawkish comments increased market expectations for a possible September rate hike. Reuters reported that the probability rose sharply following his Jackson Hole remarks, while Treasury yields also climbed.
Reuters
The U.S. 10-year Treasury yield reached around 4.76%, adding pressure to risk assets.
Reuters +1
For Bitcoin, the relationship is straightforward:
Higher yields + stronger dollar
⬇️
Less attractive liquidity environment
⬇️
Pressure on risk assets
⬇️
BTC/altcoin volatility
But there is another side.
If inflation and employment data weaken enough to reduce rate-hike expectations:
Lower yields + weaker dollar
⬇️
Improved liquidity expectations
⬇️
Potentially stronger risk appetite
⬇️
🚀 Bitcoin & crypto upside
This is why September's economic data could be more important than today's price movement.
⚖️ 6. Regulation Could Become a Major Bullish Catalyst
Another major theme is U.S. crypto regulation.
The CLARITY Act remains one of the most important pieces of legislation for the digital-asset industry, with a September Senate test becoming a key event for the market.
Bitcoin Foundation +1
If comprehensive market-structure legislation advances, it could provide greater clarity around:
Digital-asset classifications
SEC/CFTC jurisdiction
Exchanges
DeFi
Stablecoins
Institutional participation
Grayscale's research head Zach Pandl recently argued that a successful CLARITY Act could be particularly positive for Ethereum and Solana, potentially benefiting them more directly than Bitcoin.
TradingView
Therefore, regulation could become one of September's biggest crypto catalysts.
🇷🇺 7. Russia Is Also Expanding Its Crypto Market
Russia is preparing a regulated framework for cryptocurrency trading, and Sberbank reportedly estimates that regulated crypto-exchange trading could reach approximately 4 trillion rubles ($46.4 billion) during the first year.
The Block +1
This is significant because Russia represents another major economy moving toward a more formalized digital-asset market.
Combined with CBDC development and increasing institutional adoption globally, the direction of travel is clear:
Digital assets are becoming increasingly integrated into traditional financial infrastructure.
🌐 8. Tokenization Is Becoming a Bigger Theme
Another trend worth watching is real-world asset tokenization.
Traditional financial institutions are increasingly experimenting with tokenized funds, securities and financial infrastructure.
For example, Franklin Templeton recently partnered with HashKey Exchange to distribute a tokenized money-market fund in Asia.
The Block
This matters because the long-term crypto story is increasingly moving beyond simply:
“Bitcoin goes up or down.”
The bigger opportunity could involve:
Tokenized securities + stablecoins + blockchain settlement + digital funds + programmable finance.
📊 9. Leverage Is Still a Major Risk
Crypto derivatives remain highly leveraged, and today's market is showing the consequences.
Recent reports indicate approximately $245 million in crypto futures positions were liquidated during a 24-hour period as leveraged longs were squeezed.
Bitget
This is why even a relatively small Bitcoin move can trigger a much larger market reaction.
When leverage becomes excessive:
BTC falls → liquidations begin → forced selling → BTC falls further → more liquidations
The reverse can happen during a short squeeze.
Therefore, traders should watch open interest, funding rates and liquidation levels, not just spot prices.
🧭 What I'm Watching for September
🟢 Bullish Scenario
If:
BTC holds above major support
$80K is reclaimed decisively
ETF inflows strengthen
Treasury yields decline
Fed rate-hike expectations fall
CLARITY Act progress improves
ETH/SOL continue attracting institutional capital
then the market could enter another strong risk-on phase.
🔴 Bearish Scenario
If:
BTC repeatedly fails at $80K
Treasury yields continue rising
Dollar strengthens substantially
Fed becomes more hawkish
ETF outflows accelerate
Leverage builds again
then BTC could experience another significant correction, with altcoins potentially falling much faster.
🎯 The Big Picture
The crypto market is not simply bullish or bearish right now.
It is at an important transition point.
Bitcoin: strong August, but $80K remains a major hurdle.
Ethereum: benefiting from strong institutional interest.
Solana: showing impressive momentum and ecosystem strength.
ETFs: institutional demand remains significant but is becoming uneven.
Fed: the biggest short-term macro risk.
Regulation: potentially the biggest structural catalyst.
Tokenization: emerging as a major long-term adoption theme.
Leverage: remains the biggest source of short-term volatility.
🚀 September could therefore be one of the most important months of 2026 for crypto.
The key question isn't simply “Will Bitcoin go up?”
It is:
Can Bitcoin break $80K while liquidity, institutional demand and regulatory momentum remain supportive?
If the answer is yes, the market could be positioned for another major leg higher.
If macro conditions deteriorate, however, traders should expect sharp volatility before the next trend becomes clear.
₿ Stay focused on liquidity.
📊 Watch the macro.
🏦 Follow ETF flows.
⚖️ Track regulation.
🚀 Don't ignore the long-term adoption story.
This article is for market-information purposes only and is not financial advice. Crypto assets remain highly volatile.
#Bitcoin #BTC #Ethereum #ETH #Solana #SOL #Crypto #CryptoMarket #BitcoinETF #EthereumETF #DeFi #Stablecoins #Tokenization #CLARITYAct #FederalReserve #Fed #TreasuryYields #Altcoins #BinanceCommunity #CryptoNews
85
#RussiaStartsLargeScaleDigitalRubleRolloutSep1
🚨🇷🇺 Russia Begins Large-Scale Digital Ruble Rollout — September 1!
Russia is taking a major step toward mainstream CBDC adoption, with the digital ruble becoming available on a much broader scale from September 1, 2026.
Central Bank of Russia +1
💰 What changes?
🏦 Major banks must provide digital-ruble services to customers.
🛍️ Large retailers connected to major banks must accept digital-ruble payments.
📱 Users can open a digital-ruble account through participating bank apps.
⚡ Payments and transfers for individuals are designed to be fee-free.
🔄 The digital ruble will exist alongside cash and traditional bank deposits, not replace them immediately.
Central Bank of Russia +1
🇷🇺 The Bank of Russia has set a ₽300,000 monthly limit for individuals funding their digital-ruble balance from bank accounts/e-money starting September 1.
Central Bank of Russia
🌐 Why Crypto Should Pay Attention
Russia's rollout is another major example of a large economy moving from CBDC testing toward real-world digital payments.
Unlike Bitcoin, the digital ruble is a central-bank-issued currency, so it is not decentralized or permissionless. However, the expansion of CBDCs could accelerate public familiarity with digital money, blockchain-related infrastructure and programmable payments.
🔥 The bigger trend:
Digital money is moving from experiments → real-world financial infrastructure.
For crypto investors, the key question is whether growing CBDC adoption ultimately complements the broader digital-asset ecosystem or creates greater competition for privately issued cryptocurrencies and stablecoins.
#Russia #DigitalRuble #CBDC #Crypto #Bitcoin #BTC #Blockchain #DigitalAssets #Stablecoins #Web3 #CryptoNews #BinanceCommunity #CBDC #DigitalCurrency
#RussiaStartsLargeScaleDigitalRubleRolloutSep1
🚨🇷🇺 Russia Begins Large-Scale Digital Ruble Rollout — September 1!
Russia is taking a major step toward mainstream CBDC adoption, with the digital ruble becoming available on a much broader scale from September 1, 2026.
Central Bank of Russia +1
💰 What changes?
🏦 Major banks must provide digital-ruble services to customers.
🛍️ Large retailers connected to major banks must accept digital-ruble payments.
📱 Users can open a digital-ruble account through participating bank apps.
⚡ Payments and transfers for individuals are designed to be fee-free.
🔄 The digital ruble will exist alongside cash and traditional bank deposits, not replace them immediately.
Central Bank of Russia +1
🇷🇺 The Bank of Russia has set a ₽300,000 monthly limit for individuals funding their digital-ruble balance from bank accounts/e-money starting September 1.
Central Bank of Russia
🌐 Why Crypto Should Pay Attention
Russia's rollout is another major example of a large economy moving from CBDC testing toward real-world digital payments.
Unlike Bitcoin, the digital ruble is a central-bank-issued currency, so it is not decentralized or permissionless. However, the expansion of CBDCs could accelerate public familiarity with digital money, blockchain-related infrastructure and programmable payments.
🔥 The bigger trend:
Digital money is moving from experiments → real-world financial infrastructure.
For crypto investors, the key question is whether growing CBDC adoption ultimately complements the broader digital-asset ecosystem or creates greater competition for privately issued cryptocurrencies and stablecoins.
#Russia #DigitalRuble #CBDC #Crypto #Bitcoin #BTC #Blockchain #DigitalAssets #Stablecoins #Web3 #CryptoNews #BinanceCommunity #CBDC #DigitalCurrency
🚨🇷🇺 Russia Begins Large-Scale Digital Ruble Rollout — September 1!
Russia is taking a major step toward mainstream CBDC adoption, with the digital ruble becoming available on a much broader scale from September 1, 2026.
Central Bank of Russia +1
💰 What changes?
🏦 Major banks must provide digital-ruble services to customers.
🛍️ Large retailers connected to major banks must accept digital-ruble payments.
📱 Users can open a digital-ruble account through participating bank apps.
⚡ Payments and transfers for individuals are designed to be fee-free.
🔄 The digital ruble will exist alongside cash and traditional bank deposits, not replace them immediately.
Central Bank of Russia +1
🇷🇺 The Bank of Russia has set a ₽300,000 monthly limit for individuals funding their digital-ruble balance from bank accounts/e-money starting September 1.
Central Bank of Russia
🌐 Why Crypto Should Pay Attention
Russia's rollout is another major example of a large economy moving from CBDC testing toward real-world digital payments.
Unlike Bitcoin, the digital ruble is a central-bank-issued currency, so it is not decentralized or permissionless. However, the expansion of CBDCs could accelerate public familiarity with digital money, blockchain-related infrastructure and programmable payments.
🔥 The bigger trend:
Digital money is moving from experiments → real-world financial infrastructure.
For crypto investors, the key question is whether growing CBDC adoption ultimately complements the broader digital-asset ecosystem or creates greater competition for privately issued cryptocurrencies and stablecoins.
#Russia #DigitalRuble #CBDC #Crypto #Bitcoin #BTC #Blockchain #DigitalAssets #Stablecoins #Web3 #CryptoNews #BinanceCommunity #CBDC #DigitalCurrency

1
111
🔥 BTRUSDT SHORT TRADE UPDATE
📉 Position: BTRUSDT Perpetual — 10X Short
🎯 Entry: $0.15725
💰 Mark Price: $0.10049
📊 Unrealized PNL: +$1.82 USDT
🚀 ROI: +565%
💵 Margin: $0.32 USDT
A small margin, but a massive 565% ROI thanks to the sharp move in favor of the short position. ⚡
⚠️ 10X leverage = high risk. Profit can increase quickly, but so can liquidation risk if price reverses.
#BTR #BTRUSDT #Crypto #CryptoTrading #Futures #ShortTrade #Binance #Trading #Altcoins #CryptoMarket
$BTR
🔥 BTRUSDT SHORT TRADE UPDATE
📉 Position: BTRUSDT Perpetual — 10X Short
🎯 Entry: $0.15725
💰 Mark Price: $0.10049
📊 Unrealized PNL: +$1.82 USDT
🚀 ROI: +565%
💵 Margin: $0.32 USDT
A small margin, but a massive 565% ROI thanks to the sharp move in favor of the short position. ⚡
⚠️ 10X leverage = high risk. Profit can increase quickly, but so can liquidation risk if price reverses.
#BTR #BTRUSDT #Crypto #CryptoTrading #Futures #ShortTrade #Binance #Trading #Altcoins #CryptoMarket
$BTR
📉 Position: BTRUSDT Perpetual — 10X Short
🎯 Entry: $0.15725
💰 Mark Price: $0.10049
📊 Unrealized PNL: +$1.82 USDT
🚀 ROI: +565%
💵 Margin: $0.32 USDT
A small margin, but a massive 565% ROI thanks to the sharp move in favor of the short position. ⚡
⚠️ 10X leverage = high risk. Profit can increase quickly, but so can liquidation risk if price reverses.
#BTR #BTRUSDT #Crypto #CryptoTrading #Futures #ShortTrade #Binance #Trading #Altcoins #CryptoMarket
$BTR
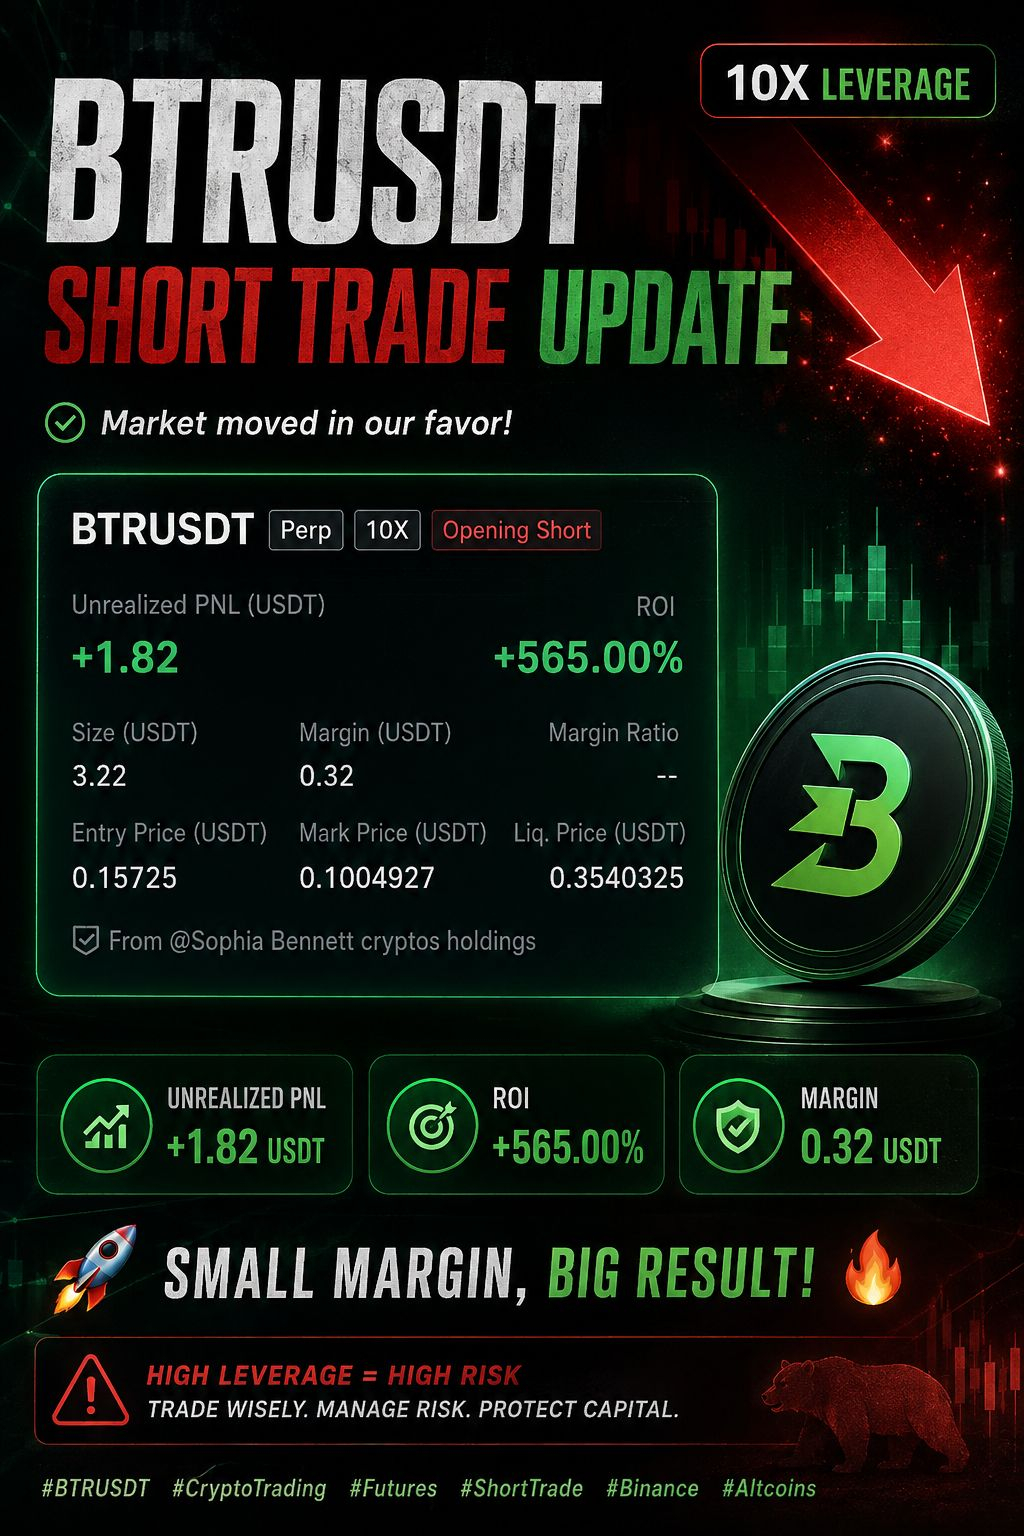
167
#USShortTermTreasuryYieldsJump
🚨 🇺🇸 U.S. SHORT-TERM TREASURY YIELDS JUMP!
U.S. short-term Treasury yields surged as markets priced in a more hawkish Fed outlook and potentially higher-for-longer interest rates.
📈 2Y Yield: ~4.35%
💵 Dollar: Strengthening
₿ Bitcoin: Short-term pressure
📉 Risk Assets: Volatility rising
🔥 Why Crypto Traders Should Care
Higher Treasury yields make relatively safer U.S. assets more attractive and can strengthen the dollar, creating short-term headwinds for Bitcoin and altcoins.
But if inflation cools and yields eventually decline, liquidity expectations could improve—potentially creating a more bullish environment for crypto.
🎯 Watch closely: 2Y Treasury yield + U.S. Dollar + Fed expectations + BTC price action.
Macro moves → Crypto moves. ₿📊
#Bitcoin #BTC #Crypto #TreasuryYields #FederalReserve #Fed #InterestRates #USDollar #CryptoMarket #BinanceCommunity #Macro #altcoins
#USShortTermTreasuryYieldsJump
🚨 🇺🇸 U.S. SHORT-TERM TREASURY YIELDS JUMP!
U.S. short-term Treasury yields surged as markets priced in a more hawkish Fed outlook and potentially higher-for-longer interest rates.
📈 2Y Yield: ~4.35%
💵 Dollar: Strengthening
₿ Bitcoin: Short-term pressure
📉 Risk Assets: Volatility rising
🔥 Why Crypto Traders Should Care
Higher Treasury yields make relatively safer U.S. assets more attractive and can strengthen the dollar, creating short-term headwinds for Bitcoin and altcoins.
But if inflation cools and yields eventually decline, liquidity expectations could improve—potentially creating a more bullish environment for crypto.
🎯 Watch closely: 2Y Treasury yield + U.S. Dollar + Fed expectations + BTC price action.
Macro moves → Crypto moves. ₿📊
#Bitcoin #BTC #Crypto #TreasuryYields #FederalReserve #Fed #InterestRates #USDollar #CryptoMarket #BinanceCommunity #Macro #altcoins
🚨 🇺🇸 U.S. SHORT-TERM TREASURY YIELDS JUMP!
U.S. short-term Treasury yields surged as markets priced in a more hawkish Fed outlook and potentially higher-for-longer interest rates.
📈 2Y Yield: ~4.35%
💵 Dollar: Strengthening
₿ Bitcoin: Short-term pressure
📉 Risk Assets: Volatility rising
🔥 Why Crypto Traders Should Care
Higher Treasury yields make relatively safer U.S. assets more attractive and can strengthen the dollar, creating short-term headwinds for Bitcoin and altcoins.
But if inflation cools and yields eventually decline, liquidity expectations could improve—potentially creating a more bullish environment for crypto.
🎯 Watch closely: 2Y Treasury yield + U.S. Dollar + Fed expectations + BTC price action.
Macro moves → Crypto moves. ₿📊
#Bitcoin #BTC #Crypto #TreasuryYields #FederalReserve #Fed #InterestRates #USDollar #CryptoMarket #BinanceCommunity #Macro #altcoins
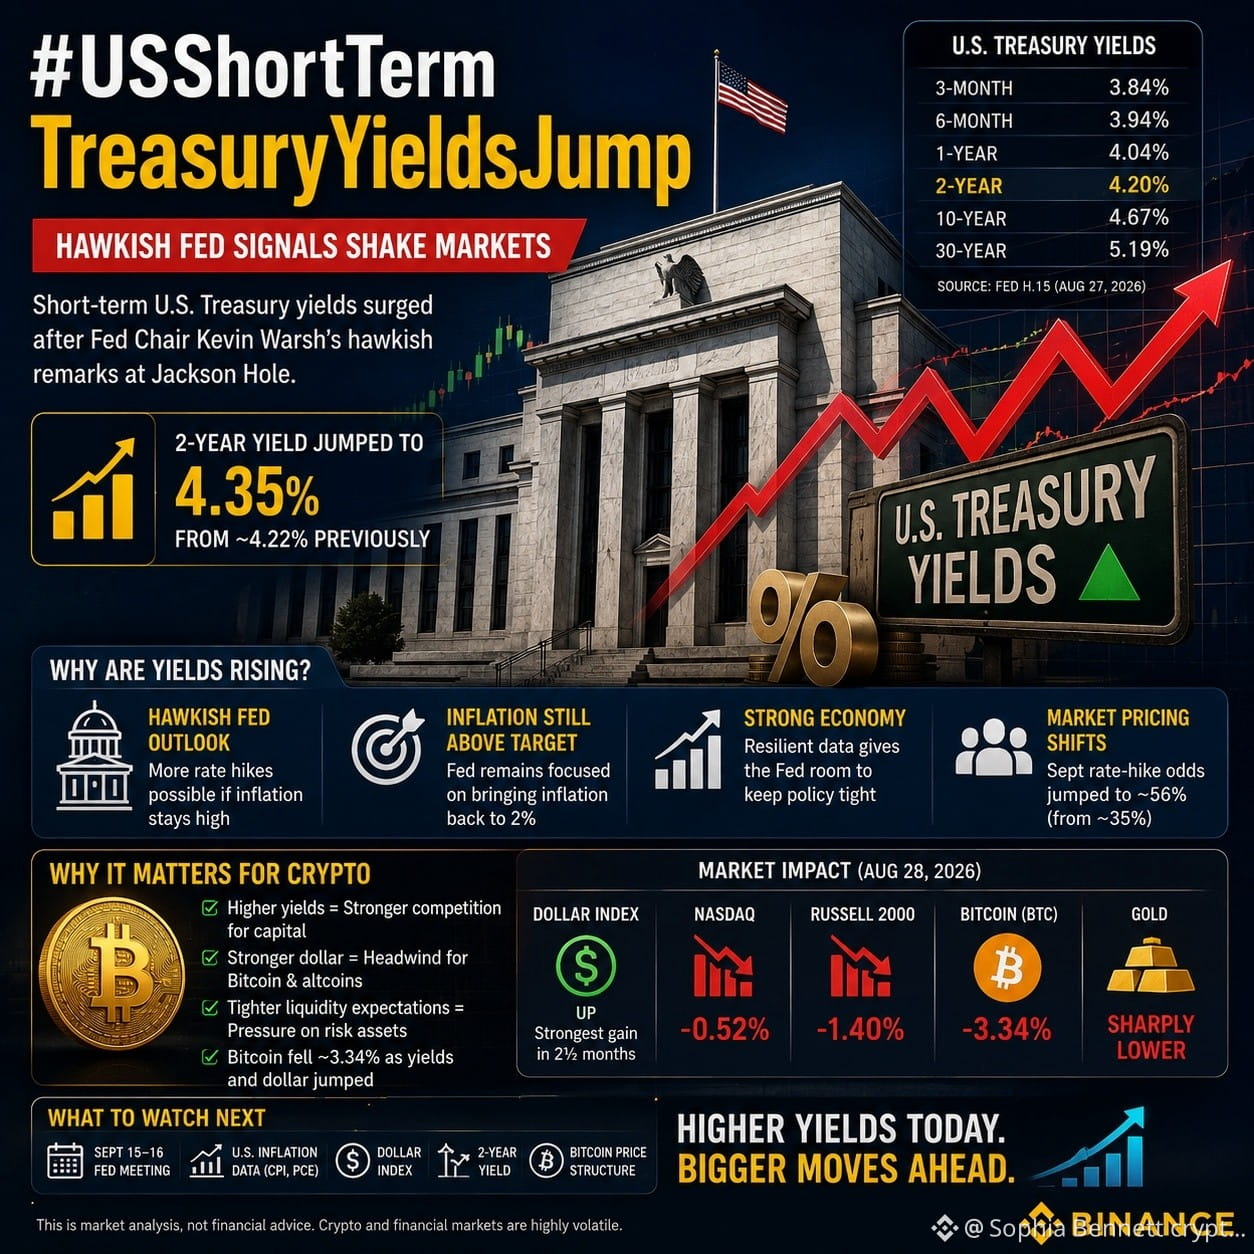
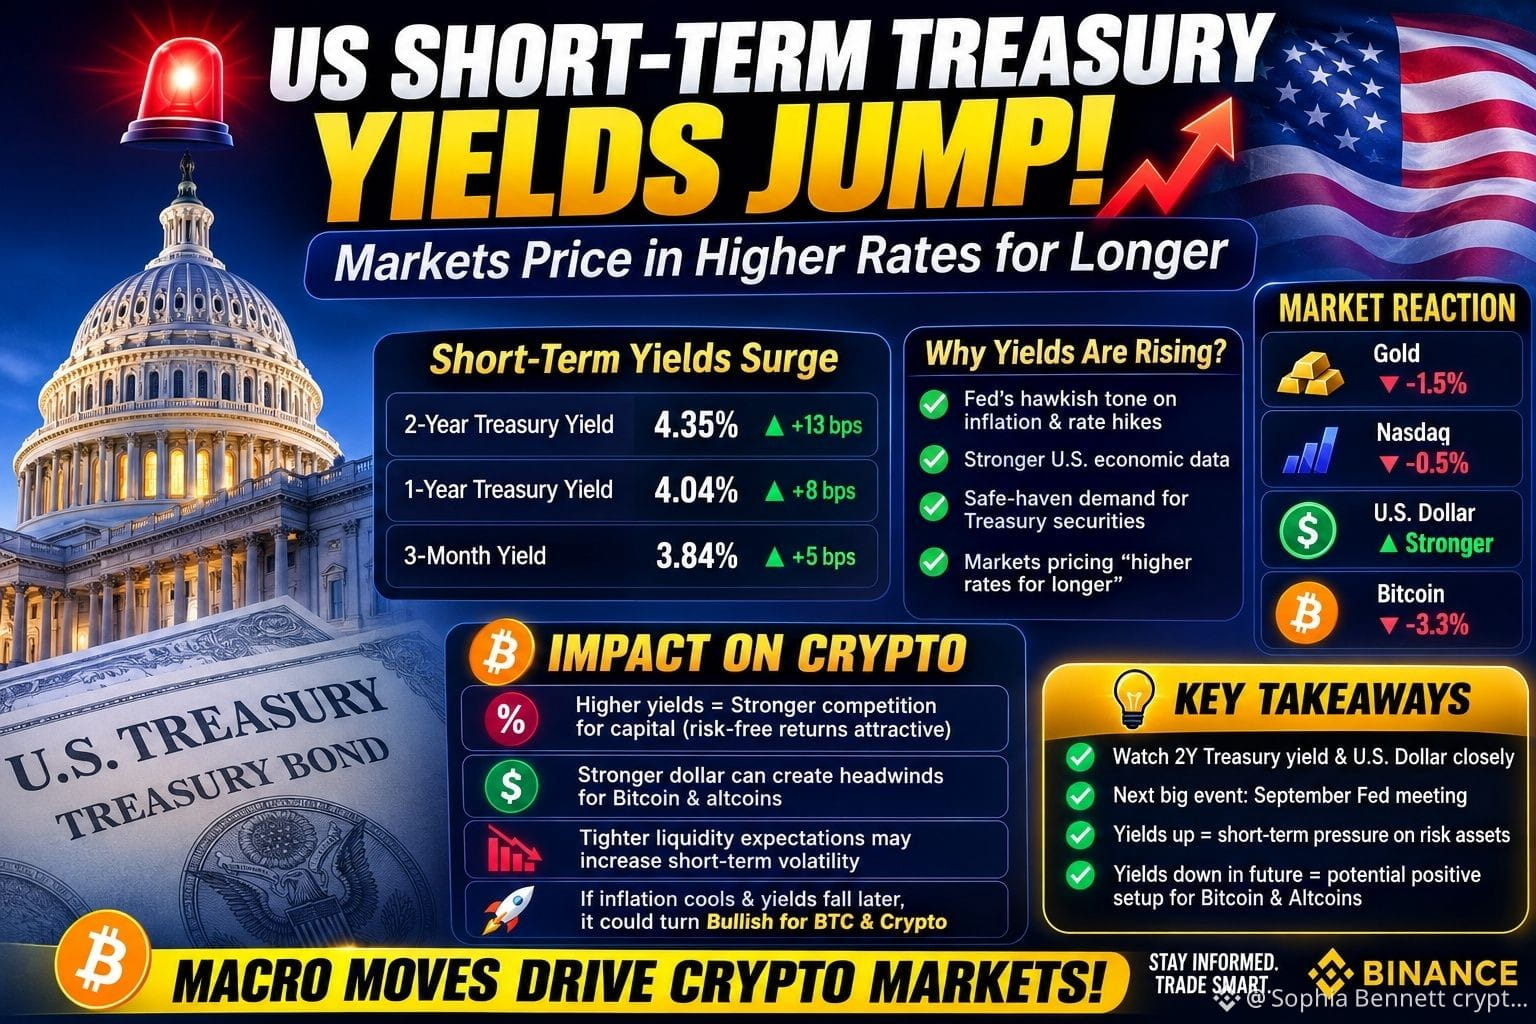
1
1
184
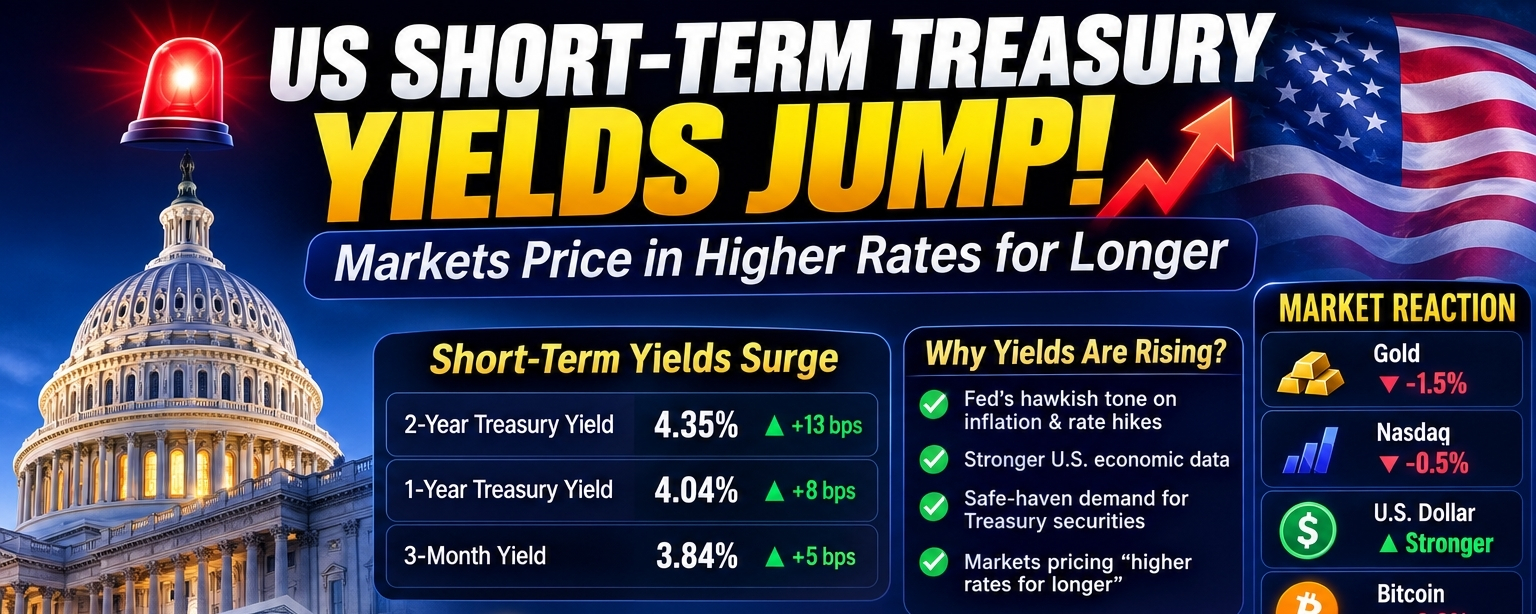
Article
US Short Term Treasury Yields Jump🇺🇸 #USShortTermTreasuryYieldsJump
USShortTermTreasuryYieldsJump — Why This Matters for Bitcoin & Crypto
U.S. Treasury yields moved sharply higher at the short end of the curve after Federal Reserve Chair Kevin Warsh delivered a more hawkish message at the Jackson Hole symposium. The move is important for crypto investors because short-term Treasury yields are closely tied to expectations for the Fed’s next policy decision—and therefore to global liquidity and the relative attractiveness of risk assets.
📈 What happened?
On August 28, the U.S. 2-year Treasury yield jumped to around 4.35%, from roughly 4.22% previously, while the 10-year yield also moved higher. Reuters reported that market-implied odds of a September Fed rate hike increased to about 56%, from roughly 35% the previous day.
Reuters +1
The latest Federal Reserve H.15 data shows that, as of August 27, Treasury constant-maturity yields were:
3-month: 3.84%
6-month: 3.94%
1-year: 4.04%
2-year: 4.20%
3-year: 4.30%
10-year: 4.67%
30-year: 5.19%
The Fed's data also shows the effective federal-funds rate at 3.63%.
Federal Reserve
The key point is that shorter-dated yields have risen more aggressively than longer-dated yields, producing what is commonly described as a bear flattening of the yield curve.
The Wall Street Journal
🔥 Why is the market reacting?
The catalyst was Federal Reserve Chair Kevin Warsh's Jackson Hole speech.
Warsh emphasized that inflation remains above the Fed's 2% objective and indicated that additional rate increases could become necessary if inflation fails to move convincingly lower. He also argued that current financial conditions may not be restrictive enough to bring inflation back to target.
AP News +1
That changed the market's interest-rate calculation almost immediately.
Before the speech:
September rate-hike expectations ≈ 35%
After the speech:
September rate-hike expectations ≈ 56–60%
Different market sources report slightly different probabilities depending on the time of measurement, but the direction is unmistakable: expectations for tighter monetary policy increased sharply.
Reuters +1
₿ Why Should Crypto Investors Care?
This is where the story becomes particularly important for Bitcoin and altcoins.
1️⃣ Higher Treasury yields = stronger competition for capital
U.S. Treasury securities are generally viewed as among the safest dollar-denominated assets.
When short-term Treasury yields rise, investors can obtain a relatively attractive yield without taking the same level of market risk associated with equities or crypto.
That can reduce the incentive to chase speculative assets.
Higher yields → stronger safe-asset returns → potentially less appetite for risk.
2️⃣ Higher rates can strengthen the U.S. dollar
Rate-hike expectations helped push the dollar higher on Friday. Reuters reported that the dollar recorded its largest daily gain in about 2½ months.
Reuters
A stronger dollar can create additional headwinds for Bitcoin because BTC is globally priced in dollars and often trades inversely with dollar liquidity and real yields over certain periods.
This is one reason the market reaction was not limited to bonds.
3️⃣ Bitcoin already reacted
Bitcoin fell approximately 3.34% on Friday as Treasury yields and the dollar climbed following Warsh's comments.
Reuters
That doesn't necessarily mean the long-term Bitcoin bull thesis has ended.
Rather, it shows that macro liquidity remains extremely important for BTC.
Bitcoin can rally strongly when liquidity expectations improve—but it can also experience sharp corrections when markets suddenly price in tighter monetary policy.
⚠️ But There Is an Important Twist
The move in Treasury yields is not automatically bearish forever.
Markets are forward-looking.
If inflation subsequently cools and economic growth or employment weakens, expectations for future rate hikes could reverse quickly.
That could lead to:
Lower yields → weaker dollar → easier financial conditions → renewed risk appetite → potential Bitcoin recovery.
So crypto traders shouldn't focus only on today's Treasury yield.
The bigger question is:
Where are yields going next—and what will the Fed do in response?
🏦 Treasury vs. Crypto: The Liquidity Battle
The current market can essentially be viewed as a competition between two forces:
🐻 Bearish macro force
Persistent inflation ↓
Fed stays hawkish
↓
Rate-hike expectations increase
↓
Treasury yields rise
↓
Dollar strengthens
↓
Risk assets face pressure
🐂 Bullish macro force
Inflation cools
↓
Fed becomes less hawkish
↓
Rate-hike expectations fall
↓
Treasury yields decline
↓
Dollar weakens
↓
Liquidity conditions improve
↓
Bitcoin & crypto regain momentum
This is why Treasury yields are one of the most important macro indicators for crypto traders right now.
📊 The Bigger Market Picture
The reaction hasn't been limited to bonds.
Following Warsh's comments:
🇺🇸 2-year Treasury: sharply higher
💵 U.S. dollar: stronger
📉 Nasdaq: down
📉 Russell 2000: down more sharply
₿ Bitcoin: down around 3.3%
🪙 Gold: sharply lower
🥈 Silver: also fell
Reuters reported that the Nasdaq declined about 0.52% and the Russell 2000 about 1.4% on Friday.
Reuters
That tells us this is primarily a macro risk-off reaction, rather than a problem isolated to cryptocurrency.
🔮 What Should Crypto Traders Watch Next?
1. 🇺🇸 September 15–16 Fed meeting
This is now one of the biggest macro events on the calendar.
If the Fed signals a rate hike, risk assets could remain under pressure.
If economic data weakens enough to reduce the probability of a hike, Treasury yields could reverse.
2. 📊 U.S. inflation data
Watch CPI, PCE and other inflation indicators.
The Fed's biggest concern remains whether inflation can sustainably move toward 2%.
AP News
3. 💵 Dollar Index
A continued dollar rally could make conditions more difficult for Bitcoin and altcoins.
4. 📈 2-year Treasury yield
This may be even more important than the 10-year yield for the immediate crypto reaction because the 2-year maturity is highly sensitive to expectations for Fed policy.
5. ₿ Bitcoin price structure
If BTC can absorb the macro shock and regain important technical levels despite rising yields, that could demonstrate significant underlying demand.
🚀 The Bullish Scenario for Crypto
There is still a path toward a positive outcome.
If upcoming inflation and employment data begin to soften, markets could rapidly unwind the current rate-hike expectations.
That could produce:
Lower 2Y yields + weaker USD + improved liquidity expectations = potentially bullish environment for BTC and altcoins.
In that scenario, the current Treasury-yield spike could eventually become a temporary macro shakeout rather than the beginning of a prolonged crypto downtrend.
🎯 Bottom Line
#USShortTermTreasuryYieldsJump is much bigger than a bond-market headline.
It represents a significant shift in expectations about Fed policy, inflation, dollar strength and global liquidity.
For crypto investors, the message is clear:
Don't watch Bitcoin in isolation—watch the 2-year Treasury yield, the U.S. dollar and Fed expectations alongside BTC.
If yields continue climbing and the dollar strengthens, crypto could face additional short-term volatility.
But if inflation cools and rate-hike expectations reverse, the same market could quickly transition back toward risk-on conditions. 🚀₿
The next major battle may not be between Bitcoin bulls and bears—it may be between inflation and the Federal Reserve.
This is market analysis, not financial advice. Crypto and financial markets can be highly volatile.
#Bitcoin #BTC #Crypto #US10Y #US2Y #TreasuryYields #FederalReserve #Fed #InterestRates #Dollar #Liquidity #RiskOn #RiskOff #Ethereum #Altcoins #Macro #CryptoMarket #BinanceCommunity
US Short Term Treasury Yields Jump
🇺🇸 #USShortTermTreasuryYieldsJump
USShortTermTreasuryYieldsJump — Why This Matters for Bitcoin & Crypto
U.S. Treasury yields moved sharply higher at the short end of the curve after Federal Reserve Chair Kevin Warsh delivered a more hawkish message at the Jackson Hole symposium. The move is important for crypto investors because short-term Treasury yields are closely tied to expectations for the Fed’s next policy decision—and therefore to global liquidity and the relative attractiveness of risk assets.
📈 What happened?
On August 28, the U.S. 2-year Treasury yield jumped to around 4.35%, from roughly 4.22% previously, while the 10-year yield also moved higher. Reuters reported that market-implied odds of a September Fed rate hike increased to about 56%, from roughly 35% the previous day.
Reuters +1
The latest Federal Reserve H.15 data shows that, as of August 27, Treasury constant-maturity yields were:
3-month: 3.84%
6-month: 3.94%
1-year: 4.04%
2-year: 4.20%
3-year: 4.30%
10-year: 4.67%
30-year: 5.19%
The Fed's data also shows the effective federal-funds rate at 3.63%.
Federal Reserve
The key point is that shorter-dated yields have risen more aggressively than longer-dated yields, producing what is commonly described as a bear flattening of the yield curve.
The Wall Street Journal
🔥 Why is the market reacting?
The catalyst was Federal Reserve Chair Kevin Warsh's Jackson Hole speech.
Warsh emphasized that inflation remains above the Fed's 2% objective and indicated that additional rate increases could become necessary if inflation fails to move convincingly lower. He also argued that current financial conditions may not be restrictive enough to bring inflation back to target.
AP News +1
That changed the market's interest-rate calculation almost immediately.
Before the speech:
September rate-hike expectations ≈ 35%
After the speech:
September rate-hike expectations ≈ 56–60%
Different market sources report slightly different probabilities depending on the time of measurement, but the direction is unmistakable: expectations for tighter monetary policy increased sharply.
Reuters +1
₿ Why Should Crypto Investors Care?
This is where the story becomes particularly important for Bitcoin and altcoins.
1️⃣ Higher Treasury yields = stronger competition for capital
U.S. Treasury securities are generally viewed as among the safest dollar-denominated assets.
When short-term Treasury yields rise, investors can obtain a relatively attractive yield without taking the same level of market risk associated with equities or crypto.
That can reduce the incentive to chase speculative assets.
Higher yields → stronger safe-asset returns → potentially less appetite for risk.
2️⃣ Higher rates can strengthen the U.S. dollar
Rate-hike expectations helped push the dollar higher on Friday. Reuters reported that the dollar recorded its largest daily gain in about 2½ months.
Reuters
A stronger dollar can create additional headwinds for Bitcoin because BTC is globally priced in dollars and often trades inversely with dollar liquidity and real yields over certain periods.
This is one reason the market reaction was not limited to bonds.
3️⃣ Bitcoin already reacted
Bitcoin fell approximately 3.34% on Friday as Treasury yields and the dollar climbed following Warsh's comments.
Reuters
That doesn't necessarily mean the long-term Bitcoin bull thesis has ended.
Rather, it shows that macro liquidity remains extremely important for BTC.
Bitcoin can rally strongly when liquidity expectations improve—but it can also experience sharp corrections when markets suddenly price in tighter monetary policy.
⚠️ But There Is an Important Twist
The move in Treasury yields is not automatically bearish forever.
Markets are forward-looking.
If inflation subsequently cools and economic growth or employment weakens, expectations for future rate hikes could reverse quickly.
That could lead to:
Lower yields → weaker dollar → easier financial conditions → renewed risk appetite → potential Bitcoin recovery.
So crypto traders shouldn't focus only on today's Treasury yield.
The bigger question is:
Where are yields going next—and what will the Fed do in response?
🏦 Treasury vs. Crypto: The Liquidity Battle
The current market can essentially be viewed as a competition between two forces:
🐻 Bearish macro force
Persistent inflation ↓
Fed stays hawkish
↓
Rate-hike expectations increase
↓
Treasury yields rise
↓
Dollar strengthens
↓
Risk assets face pressure
🐂 Bullish macro force
Inflation cools
↓
Fed becomes less hawkish
↓
Rate-hike expectations fall
↓
Treasury yields decline
↓
Dollar weakens
↓
Liquidity conditions improve
↓
Bitcoin & crypto regain momentum
This is why Treasury yields are one of the most important macro indicators for crypto traders right now.
📊 The Bigger Market Picture
The reaction hasn't been limited to bonds.
Following Warsh's comments:
🇺🇸 2-year Treasury: sharply higher
💵 U.S. dollar: stronger
📉 Nasdaq: down
📉 Russell 2000: down more sharply
₿ Bitcoin: down around 3.3%
🪙 Gold: sharply lower
🥈 Silver: also fell
Reuters reported that the Nasdaq declined about 0.52% and the Russell 2000 about 1.4% on Friday.
Reuters
That tells us this is primarily a macro risk-off reaction, rather than a problem isolated to cryptocurrency.
🔮 What Should Crypto Traders Watch Next?
1. 🇺🇸 September 15–16 Fed meeting
This is now one of the biggest macro events on the calendar.
If the Fed signals a rate hike, risk assets could remain under pressure.
If economic data weakens enough to reduce the probability of a hike, Treasury yields could reverse.
2. 📊 U.S. inflation data
Watch CPI, PCE and other inflation indicators.
The Fed's biggest concern remains whether inflation can sustainably move toward 2%.
AP News
3. 💵 Dollar Index
A continued dollar rally could make conditions more difficult for Bitcoin and altcoins.
4. 📈 2-year Treasury yield
This may be even more important than the 10-year yield for the immediate crypto reaction because the 2-year maturity is highly sensitive to expectations for Fed policy.
5. ₿ Bitcoin price structure
If BTC can absorb the macro shock and regain important technical levels despite rising yields, that could demonstrate significant underlying demand.
🚀 The Bullish Scenario for Crypto
There is still a path toward a positive outcome.
If upcoming inflation and employment data begin to soften, markets could rapidly unwind the current rate-hike expectations.
That could produce:
Lower 2Y yields + weaker USD + improved liquidity expectations = potentially bullish environment for BTC and altcoins.
In that scenario, the current Treasury-yield spike could eventually become a temporary macro shakeout rather than the beginning of a prolonged crypto downtrend.
🎯 Bottom Line
#USShortTermTreasuryYieldsJump is much bigger than a bond-market headline.
It represents a significant shift in expectations about Fed policy, inflation, dollar strength and global liquidity.
For crypto investors, the message is clear:
Don't watch Bitcoin in isolation—watch the 2-year Treasury yield, the U.S. dollar and Fed expectations alongside BTC.
If yields continue climbing and the dollar strengthens, crypto could face additional short-term volatility.
But if inflation cools and rate-hike expectations reverse, the same market could quickly transition back toward risk-on conditions. 🚀₿
The next major battle may not be between Bitcoin bulls and bears—it may be between inflation and the Federal Reserve.
This is market analysis, not financial advice. Crypto and financial markets can be highly volatile.
#Bitcoin #BTC #Crypto #US10Y #US2Y #TreasuryYields #FederalReserve #Fed #InterestRates #Dollar #Liquidity #RiskOn #RiskOff #Ethereum #Altcoins #Macro #CryptoMarket #BinanceCommunity
USShortTermTreasuryYieldsJump — Why This Matters for Bitcoin & Crypto
U.S. Treasury yields moved sharply higher at the short end of the curve after Federal Reserve Chair Kevin Warsh delivered a more hawkish message at the Jackson Hole symposium. The move is important for crypto investors because short-term Treasury yields are closely tied to expectations for the Fed’s next policy decision—and therefore to global liquidity and the relative attractiveness of risk assets.
📈 What happened?
On August 28, the U.S. 2-year Treasury yield jumped to around 4.35%, from roughly 4.22% previously, while the 10-year yield also moved higher. Reuters reported that market-implied odds of a September Fed rate hike increased to about 56%, from roughly 35% the previous day.
Reuters +1
The latest Federal Reserve H.15 data shows that, as of August 27, Treasury constant-maturity yields were:
3-month: 3.84%
6-month: 3.94%
1-year: 4.04%
2-year: 4.20%
3-year: 4.30%
10-year: 4.67%
30-year: 5.19%
The Fed's data also shows the effective federal-funds rate at 3.63%.
Federal Reserve
The key point is that shorter-dated yields have risen more aggressively than longer-dated yields, producing what is commonly described as a bear flattening of the yield curve.
The Wall Street Journal
🔥 Why is the market reacting?
The catalyst was Federal Reserve Chair Kevin Warsh's Jackson Hole speech.
Warsh emphasized that inflation remains above the Fed's 2% objective and indicated that additional rate increases could become necessary if inflation fails to move convincingly lower. He also argued that current financial conditions may not be restrictive enough to bring inflation back to target.
AP News +1
That changed the market's interest-rate calculation almost immediately.
Before the speech:
September rate-hike expectations ≈ 35%
After the speech:
September rate-hike expectations ≈ 56–60%
Different market sources report slightly different probabilities depending on the time of measurement, but the direction is unmistakable: expectations for tighter monetary policy increased sharply.
Reuters +1
₿ Why Should Crypto Investors Care?
This is where the story becomes particularly important for Bitcoin and altcoins.
1️⃣ Higher Treasury yields = stronger competition for capital
U.S. Treasury securities are generally viewed as among the safest dollar-denominated assets.
When short-term Treasury yields rise, investors can obtain a relatively attractive yield without taking the same level of market risk associated with equities or crypto.
That can reduce the incentive to chase speculative assets.
Higher yields → stronger safe-asset returns → potentially less appetite for risk.
2️⃣ Higher rates can strengthen the U.S. dollar
Rate-hike expectations helped push the dollar higher on Friday. Reuters reported that the dollar recorded its largest daily gain in about 2½ months.
Reuters
A stronger dollar can create additional headwinds for Bitcoin because BTC is globally priced in dollars and often trades inversely with dollar liquidity and real yields over certain periods.
This is one reason the market reaction was not limited to bonds.
3️⃣ Bitcoin already reacted
Bitcoin fell approximately 3.34% on Friday as Treasury yields and the dollar climbed following Warsh's comments.
Reuters
That doesn't necessarily mean the long-term Bitcoin bull thesis has ended.
Rather, it shows that macro liquidity remains extremely important for BTC.
Bitcoin can rally strongly when liquidity expectations improve—but it can also experience sharp corrections when markets suddenly price in tighter monetary policy.
⚠️ But There Is an Important Twist
The move in Treasury yields is not automatically bearish forever.
Markets are forward-looking.
If inflation subsequently cools and economic growth or employment weakens, expectations for future rate hikes could reverse quickly.
That could lead to:
Lower yields → weaker dollar → easier financial conditions → renewed risk appetite → potential Bitcoin recovery.
So crypto traders shouldn't focus only on today's Treasury yield.
The bigger question is:
Where are yields going next—and what will the Fed do in response?
🏦 Treasury vs. Crypto: The Liquidity Battle
The current market can essentially be viewed as a competition between two forces:
🐻 Bearish macro force
Persistent inflation ↓
Fed stays hawkish
↓
Rate-hike expectations increase
↓
Treasury yields rise
↓
Dollar strengthens
↓
Risk assets face pressure
🐂 Bullish macro force
Inflation cools
↓
Fed becomes less hawkish
↓
Rate-hike expectations fall
↓
Treasury yields decline
↓
Dollar weakens
↓
Liquidity conditions improve
↓
Bitcoin & crypto regain momentum
This is why Treasury yields are one of the most important macro indicators for crypto traders right now.
📊 The Bigger Market Picture
The reaction hasn't been limited to bonds.
Following Warsh's comments:
🇺🇸 2-year Treasury: sharply higher
💵 U.S. dollar: stronger
📉 Nasdaq: down
📉 Russell 2000: down more sharply
₿ Bitcoin: down around 3.3%
🪙 Gold: sharply lower
🥈 Silver: also fell
Reuters reported that the Nasdaq declined about 0.52% and the Russell 2000 about 1.4% on Friday.
Reuters
That tells us this is primarily a macro risk-off reaction, rather than a problem isolated to cryptocurrency.
🔮 What Should Crypto Traders Watch Next?
1. 🇺🇸 September 15–16 Fed meeting
This is now one of the biggest macro events on the calendar.
If the Fed signals a rate hike, risk assets could remain under pressure.
If economic data weakens enough to reduce the probability of a hike, Treasury yields could reverse.
2. 📊 U.S. inflation data
Watch CPI, PCE and other inflation indicators.
The Fed's biggest concern remains whether inflation can sustainably move toward 2%.
AP News
3. 💵 Dollar Index
A continued dollar rally could make conditions more difficult for Bitcoin and altcoins.
4. 📈 2-year Treasury yield
This may be even more important than the 10-year yield for the immediate crypto reaction because the 2-year maturity is highly sensitive to expectations for Fed policy.
5. ₿ Bitcoin price structure
If BTC can absorb the macro shock and regain important technical levels despite rising yields, that could demonstrate significant underlying demand.
🚀 The Bullish Scenario for Crypto
There is still a path toward a positive outcome.
If upcoming inflation and employment data begin to soften, markets could rapidly unwind the current rate-hike expectations.
That could produce:
Lower 2Y yields + weaker USD + improved liquidity expectations = potentially bullish environment for BTC and altcoins.
In that scenario, the current Treasury-yield spike could eventually become a temporary macro shakeout rather than the beginning of a prolonged crypto downtrend.
🎯 Bottom Line
#USShortTermTreasuryYieldsJump is much bigger than a bond-market headline.
It represents a significant shift in expectations about Fed policy, inflation, dollar strength and global liquidity.
For crypto investors, the message is clear:
Don't watch Bitcoin in isolation—watch the 2-year Treasury yield, the U.S. dollar and Fed expectations alongside BTC.
If yields continue climbing and the dollar strengthens, crypto could face additional short-term volatility.
But if inflation cools and rate-hike expectations reverse, the same market could quickly transition back toward risk-on conditions. 🚀₿
The next major battle may not be between Bitcoin bulls and bears—it may be between inflation and the Federal Reserve.
This is market analysis, not financial advice. Crypto and financial markets can be highly volatile.
#Bitcoin #BTC #Crypto #US10Y #US2Y #TreasuryYields #FederalReserve #Fed #InterestRates #Dollar #Liquidity #RiskOn #RiskOff #Ethereum #Altcoins #Macro #CryptoMarket #BinanceCommunity
167
#NvidiaRises8.74%AfterEarnings
🚀 NVIDIA SURGES 8.74% AFTER EARNINGS! 📈🔥
NVIDIA has delivered another powerful earnings performance, sending its stock +8.74% higher as investors react positively to strong AI-driven demand and the company’s growth outlook.
💡 Why it matters for crypto & markets:
• 🤖 AI infrastructure demand remains a major growth engine
• 🖥️ Strong GPU demand supports the broader AI ecosystem
• 📈 NVIDIA strength can boost overall risk appetite across tech markets
• ₿ AI + crypto narratives could continue attracting capital
• 🌐 The broader technology sector may benefit from renewed investor confidence
🔥 Market takeaway:
NVIDIA’s rally highlights that the AI investment cycle remains strong. If this momentum continues, it could provide a positive backdrop for Bitcoin, AI tokens and the wider crypto market.
📊 NVIDIA +8.74% = Strong AI Market Signal
#Nvidia #NvidiaEarnings #AI #ArtificialIntelligence #Bitcoin #Crypto #BTC #Ethereum #Altcoins #StockMarket #TechStocks #CryptoNews
$NVDA.US
{stock_us}(NVDA.US)
#NvidiaRises8.74%AfterEarnings
🚀 NVIDIA SURGES 8.74% AFTER EARNINGS! 📈🔥
NVIDIA has delivered another powerful earnings performance, sending its stock +8.74% higher as investors react positively to strong AI-driven demand and the company’s growth outlook.
💡 Why it matters for crypto & markets:
• 🤖 AI infrastructure demand remains a major growth engine
• 🖥️ Strong GPU demand supports the broader AI ecosystem
• 📈 NVIDIA strength can boost overall risk appetite across tech markets
• ₿ AI + crypto narratives could continue attracting capital
• 🌐 The broader technology sector may benefit from renewed investor confidence
🔥 Market takeaway:
NVIDIA’s rally highlights that the AI investment cycle remains strong. If this momentum continues, it could provide a positive backdrop for Bitcoin, AI tokens and the wider crypto market.
📊 NVIDIA +8.74% = Strong AI Market Signal
#Nvidia #NvidiaEarnings #AI #ArtificialIntelligence #Bitcoin #Crypto #BTC #Ethereum #Altcoins #StockMarket #TechStocks #CryptoNews
$NVDA.US
🚀 NVIDIA SURGES 8.74% AFTER EARNINGS! 📈🔥
NVIDIA has delivered another powerful earnings performance, sending its stock +8.74% higher as investors react positively to strong AI-driven demand and the company’s growth outlook.
💡 Why it matters for crypto & markets:
• 🤖 AI infrastructure demand remains a major growth engine
• 🖥️ Strong GPU demand supports the broader AI ecosystem
• 📈 NVIDIA strength can boost overall risk appetite across tech markets
• ₿ AI + crypto narratives could continue attracting capital
• 🌐 The broader technology sector may benefit from renewed investor confidence
🔥 Market takeaway:
NVIDIA’s rally highlights that the AI investment cycle remains strong. If this momentum continues, it could provide a positive backdrop for Bitcoin, AI tokens and the wider crypto market.
📊 NVIDIA +8.74% = Strong AI Market Signal
#Nvidia #NvidiaEarnings #AI #ArtificialIntelligence #Bitcoin #Crypto #BTC #Ethereum #Altcoins #StockMarket #TechStocks #CryptoNews
$NVDA.US
NVDAUS+1.25%
135
🚀🔥 SOLANA ($SOL) IS BACK IN THE SPOTLIGHT! — BULLS TAKE CONTROL 🟢
SOL/USDT: $108.01 | +11.11% (24H)
📈 24H High: $109.62
📉 24H Low: $96.30
💎 24H Volume: 5.11M SOL / ~$529M USDT
🟢 WHY SOL LOOKS STRONG RIGHT NOW
🔹 Momentum is accelerating:
SOL is up approximately 11% today, 32% in 7 days, 42% in 30 days and 31% in 90 days according to the chart shown.
🔹 Major moving-average breakout:
SOL is trading well above its MA(7) ≈ $98.37, MA(25) ≈ $82.57 and MA(99) ≈ $77.03. This is a strong technical structure, with the shorter-term average moving sharply above the longer-term trend.
🔹 Institutional demand is growing:
U.S. spot Solana ETFs have reached approximately $1.22 billion in cumulative net inflows, with a five-day positive-flow streak. One recent session saw about $33.5M of inflows, the strongest single-day result reported for 2026.
🔹 Bitcoin is supporting the altcoin market:
BTC has moved back above $80K, while recent U.S. spot Bitcoin ETF demand has remained strong. This type of Bitcoin strength can provide a healthier environment for high-beta large-cap altcoins such as SOL.
🔹 Solana fundamentals continue to develop:
The Solana ecosystem has been expanding its on-chain financial infrastructure, including tokenized equities and increased network capacity.
🎯 KEY LEVELS TO WATCH
Resistance:
🔥 $109.60–$110 — immediate breakout zone
🚀 $115 — next psychological target
🚀 $120 — major momentum milestone
$SOL
The next few sessions are crucial.
If SOL converts $100–$110 into a strong support zone, the market could start looking toward the next major leg higher. 🚀
Are we watching the beginning of SOL's next major move? 👀🔥
#Solana #SOL #SOLUSDT #Binance #BinanceCommunity #Crypto #CryptoNews #Altcoins #Bitcoin #BTC #Ethereum #ETF #SolanaETF #DeFi #Bullish #CryptoMarket #Web3
🚀🔥 SOLANA ($SOL ) IS BACK IN THE SPOTLIGHT! — BULLS TAKE CONTROL 🟢
SOL/USDT: $108.01 | +11.11% (24H)
📈 24H High: $109.62
📉 24H Low: $96.30
💎 24H Volume: 5.11M SOL / ~$529M USDT
🟢 WHY SOL LOOKS STRONG RIGHT NOW
🔹 Momentum is accelerating:
SOL is up approximately 11% today, 32% in 7 days, 42% in 30 days and 31% in 90 days according to the chart shown.
🔹 Major moving-average breakout:
SOL is trading well above its MA(7) ≈ $98.37, MA(25) ≈ $82.57 and MA(99) ≈ $77.03. This is a strong technical structure, with the shorter-term average moving sharply above the longer-term trend.
🔹 Institutional demand is growing:
U.S. spot Solana ETFs have reached approximately $1.22 billion in cumulative net inflows, with a five-day positive-flow streak. One recent session saw about $33.5M of inflows, the strongest single-day result reported for 2026.
🔹 Bitcoin is supporting the altcoin market:
BTC has moved back above $80K, while recent U.S. spot Bitcoin ETF demand has remained strong. This type of Bitcoin strength can provide a healthier environment for high-beta large-cap altcoins such as SOL.
🔹 Solana fundamentals continue to develop:
The Solana ecosystem has been expanding its on-chain financial infrastructure, including tokenized equities and increased network capacity.
🎯 KEY LEVELS TO WATCH
Resistance:
🔥 $109.60–$110 — immediate breakout zone
🚀 $115 — next psychological target
🚀 $120 — major momentum milestone
$SOL
The next few sessions are crucial.
If SOL converts $100–$110 into a strong support zone, the market could start looking toward the next major leg higher. 🚀
Are we watching the beginning of SOL's next major move? 👀🔥
#Solana #SOL #SOLUSDT #Binance #BinanceCommunity #Crypto #CryptoNews #Altcoins #Bitcoin #BTC #Ethereum #ETF #SolanaETF #DeFi #Bullish #CryptoMarket #Web3
SOL/USDT: $108.01 | +11.11% (24H)
📈 24H High: $109.62
📉 24H Low: $96.30
💎 24H Volume: 5.11M SOL / ~$529M USDT
🟢 WHY SOL LOOKS STRONG RIGHT NOW
🔹 Momentum is accelerating:
SOL is up approximately 11% today, 32% in 7 days, 42% in 30 days and 31% in 90 days according to the chart shown.
🔹 Major moving-average breakout:
SOL is trading well above its MA(7) ≈ $98.37, MA(25) ≈ $82.57 and MA(99) ≈ $77.03. This is a strong technical structure, with the shorter-term average moving sharply above the longer-term trend.
🔹 Institutional demand is growing:
U.S. spot Solana ETFs have reached approximately $1.22 billion in cumulative net inflows, with a five-day positive-flow streak. One recent session saw about $33.5M of inflows, the strongest single-day result reported for 2026.
🔹 Bitcoin is supporting the altcoin market:
BTC has moved back above $80K, while recent U.S. spot Bitcoin ETF demand has remained strong. This type of Bitcoin strength can provide a healthier environment for high-beta large-cap altcoins such as SOL.
🔹 Solana fundamentals continue to develop:
The Solana ecosystem has been expanding its on-chain financial infrastructure, including tokenized equities and increased network capacity.
🎯 KEY LEVELS TO WATCH
Resistance:
🔥 $109.60–$110 — immediate breakout zone
🚀 $115 — next psychological target
🚀 $120 — major momentum milestone
$SOL
The next few sessions are crucial.
If SOL converts $100–$110 into a strong support zone, the market could start looking toward the next major leg higher. 🚀
Are we watching the beginning of SOL's next major move? 👀🔥
#Solana #SOL #SOLUSDT #Binance #BinanceCommunity #Crypto #CryptoNews #Altcoins #Bitcoin #BTC #Ethereum #ETF #SolanaETF #DeFi #Bullish #CryptoMarket #Web3
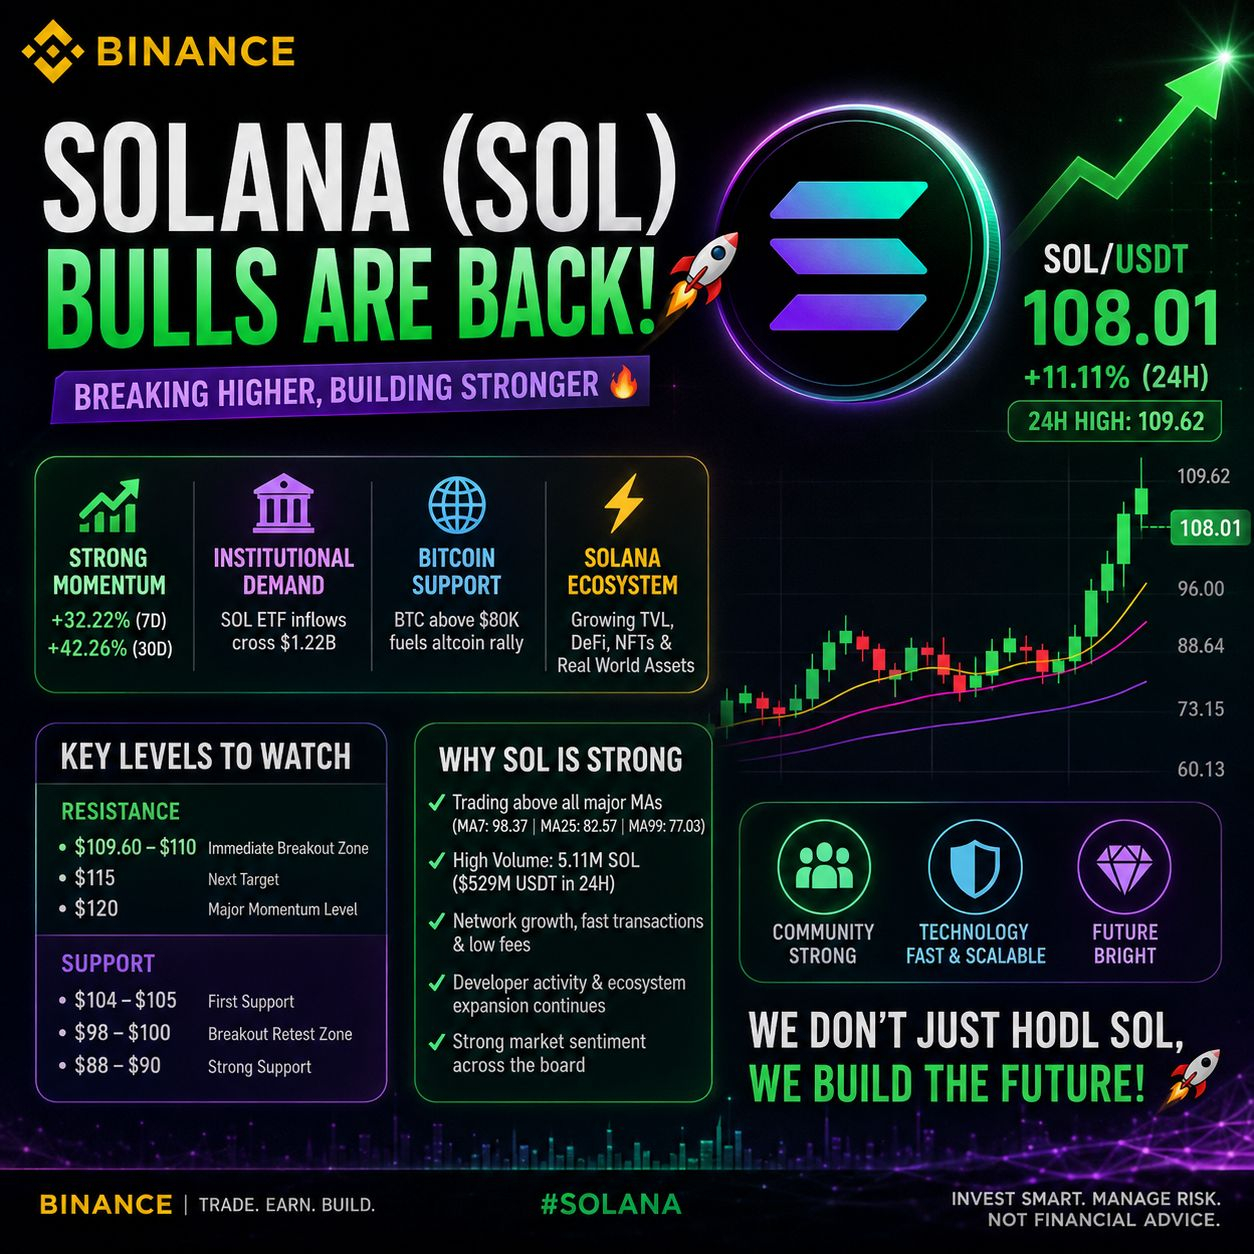
82
Article
🚀 Solana (SOL) Bulls Are Back: Can SOL Break Above $110 and Target $120?🚀🔥 SOLANA ($SOL) IS BACK IN THE SPOTLIGHT! — BULLS TAKE CONTROL 🟢
SOL/USDT: $108.01 | +11.11% (24H)
📈 24H High: $109.62
📉 24H Low: $96.30
💎 24H Volume: 5.11M SOL / ~$529M USDT
The chart is showing a powerful breakout, and the broader crypto market is providing an increasingly supportive backdrop. SOL has recently traded around the $109–$110 area, its strongest level of the year, while Bitcoin has reclaimed $80,000.
🟢 WHY SOL LOOKS STRONG RIGHT NOW
🔹 Momentum is accelerating:
SOL is up approximately 11% today, 32% in 7 days, 42% in 30 days and 31% in 90 days according to the chart shown.
🔹 Major moving-average breakout:
SOL is trading well above its MA(7) ≈ $98.37, MA(25) ≈ $82.57 and MA(99) ≈ $77.03. This is a strong technical structure, with the shorter-term average moving sharply above the longer-term trend.
🔹 Institutional demand is growing:
U.S. spot Solana ETFs have reached approximately $1.22 billion in cumulative net inflows, with a five-day positive-flow streak. One recent session saw about $33.5M of inflows, the strongest single-day result reported for 2026.
🔹 Bitcoin is supporting the altcoin market:
BTC has moved back above $80K, while recent U.S. spot Bitcoin ETF demand has remained strong. This type of Bitcoin strength can provide a healthier environment for high-beta large-cap altcoins such as SOL.
🔹 Solana fundamentals continue to develop:
The Solana ecosystem has been expanding its on-chain financial infrastructure, including tokenized equities and increased network capacity.
🎯 KEY LEVELS TO WATCH
Resistance:
🔥 $109.60–$110 — immediate breakout zone
🚀 $115 — next psychological target
🚀 $120 — major momentum milestone
Support:
🛡️ $104–$105 — first support
🛡️ $98–$100 — important breakout/retest zone
🛡️ $88–$90 — deeper technical support
A sustained daily close above $110 with strong volume could strengthen the bullish continuation setup. A pullback toward $100 that holds as support could also be viewed as a healthy retest rather than a trend reversal.
⚡ ONE IMPORTANT WARNING
SOL's recent rally has been extremely fast, so short-term indicators are becoming stretched. Some market data currently shows SOL in overbought territory.
That doesn't automatically mean the rally is over — but profit-taking and sharp pullbacks are possible even inside a bullish trend.
🌎 THE BIGGER CRYPTO PICTURE
BTC reclaiming $80K + strong ETF flows + renewed institutional interest + SOL ETF demand + improving altcoin momentum = a much more constructive setup for the crypto market.
The next few sessions are crucial.
If SOL converts $100–$110 into a strong support zone, the market could start looking toward the next major leg higher. 🚀
Not financial advice. Crypto remains highly volatile — manage risk and never trade more than you can afford to lose.
Are we watching the beginning of SOL's next major move? 👀🔥
#Solana #SOL #SOLUSDT #Binance #BinanceCommunity #Crypto #CryptoNews #Altcoins #Bitcoin #BTC #Ethereum #ETF #SolanaETF #DeFi #Bullish #CryptoMarket #Web3
$SOL
{spot}(SOLUSDT)
🚀 Solana (SOL) Bulls Are Back: Can SOL Break Above $110 and Target $120?
🚀🔥 SOLANA ($SOL ) IS BACK IN THE SPOTLIGHT! — BULLS TAKE CONTROL 🟢
SOL/USDT: $108.01 | +11.11% (24H)
📈 24H High: $109.62
📉 24H Low: $96.30
💎 24H Volume: 5.11M SOL / ~$529M USDT
The chart is showing a powerful breakout, and the broader crypto market is providing an increasingly supportive backdrop. SOL has recently traded around the $109–$110 area, its strongest level of the year, while Bitcoin has reclaimed $80,000.
🟢 WHY SOL LOOKS STRONG RIGHT NOW
🔹 Momentum is accelerating:
SOL is up approximately 11% today, 32% in 7 days, 42% in 30 days and 31% in 90 days according to the chart shown.
🔹 Major moving-average breakout:
SOL is trading well above its MA(7) ≈ $98.37, MA(25) ≈ $82.57 and MA(99) ≈ $77.03. This is a strong technical structure, with the shorter-term average moving sharply above the longer-term trend.
🔹 Institutional demand is growing:
U.S. spot Solana ETFs have reached approximately $1.22 billion in cumulative net inflows, with a five-day positive-flow streak. One recent session saw about $33.5M of inflows, the strongest single-day result reported for 2026.
🔹 Bitcoin is supporting the altcoin market:
BTC has moved back above $80K, while recent U.S. spot Bitcoin ETF demand has remained strong. This type of Bitcoin strength can provide a healthier environment for high-beta large-cap altcoins such as SOL.
🔹 Solana fundamentals continue to develop:
The Solana ecosystem has been expanding its on-chain financial infrastructure, including tokenized equities and increased network capacity.
🎯 KEY LEVELS TO WATCH
Resistance:
🔥 $109.60–$110 — immediate breakout zone
🚀 $115 — next psychological target
🚀 $120 — major momentum milestone
Support:
🛡️ $104–$105 — first support
🛡️ $98–$100 — important breakout/retest zone
🛡️ $88–$90 — deeper technical support
A sustained daily close above $110 with strong volume could strengthen the bullish continuation setup. A pullback toward $100 that holds as support could also be viewed as a healthy retest rather than a trend reversal.
⚡ ONE IMPORTANT WARNING
SOL's recent rally has been extremely fast, so short-term indicators are becoming stretched. Some market data currently shows SOL in overbought territory.
That doesn't automatically mean the rally is over — but profit-taking and sharp pullbacks are possible even inside a bullish trend.
🌎 THE BIGGER CRYPTO PICTURE
BTC reclaiming $80K + strong ETF flows + renewed institutional interest + SOL ETF demand + improving altcoin momentum = a much more constructive setup for the crypto market.
The next few sessions are crucial.
If SOL converts $100–$110 into a strong support zone, the market could start looking toward the next major leg higher. 🚀
Not financial advice. Crypto remains highly volatile — manage risk and never trade more than you can afford to lose.
Are we watching the beginning of SOL's next major move? 👀🔥
#Solana #SOL #SOLUSDT #Binance #BinanceCommunity #Crypto #CryptoNews #Altcoins #Bitcoin #BTC #Ethereum #ETF #SolanaETF #DeFi #Bullish #CryptoMarket #Web3
$SOL
SOL/USDT: $108.01 | +11.11% (24H)
📈 24H High: $109.62
📉 24H Low: $96.30
💎 24H Volume: 5.11M SOL / ~$529M USDT
The chart is showing a powerful breakout, and the broader crypto market is providing an increasingly supportive backdrop. SOL has recently traded around the $109–$110 area, its strongest level of the year, while Bitcoin has reclaimed $80,000.
🟢 WHY SOL LOOKS STRONG RIGHT NOW
🔹 Momentum is accelerating:
SOL is up approximately 11% today, 32% in 7 days, 42% in 30 days and 31% in 90 days according to the chart shown.
🔹 Major moving-average breakout:
SOL is trading well above its MA(7) ≈ $98.37, MA(25) ≈ $82.57 and MA(99) ≈ $77.03. This is a strong technical structure, with the shorter-term average moving sharply above the longer-term trend.
🔹 Institutional demand is growing:
U.S. spot Solana ETFs have reached approximately $1.22 billion in cumulative net inflows, with a five-day positive-flow streak. One recent session saw about $33.5M of inflows, the strongest single-day result reported for 2026.
🔹 Bitcoin is supporting the altcoin market:
BTC has moved back above $80K, while recent U.S. spot Bitcoin ETF demand has remained strong. This type of Bitcoin strength can provide a healthier environment for high-beta large-cap altcoins such as SOL.
🔹 Solana fundamentals continue to develop:
The Solana ecosystem has been expanding its on-chain financial infrastructure, including tokenized equities and increased network capacity.
🎯 KEY LEVELS TO WATCH
Resistance:
🔥 $109.60–$110 — immediate breakout zone
🚀 $115 — next psychological target
🚀 $120 — major momentum milestone
Support:
🛡️ $104–$105 — first support
🛡️ $98–$100 — important breakout/retest zone
🛡️ $88–$90 — deeper technical support
A sustained daily close above $110 with strong volume could strengthen the bullish continuation setup. A pullback toward $100 that holds as support could also be viewed as a healthy retest rather than a trend reversal.
⚡ ONE IMPORTANT WARNING
SOL's recent rally has been extremely fast, so short-term indicators are becoming stretched. Some market data currently shows SOL in overbought territory.
That doesn't automatically mean the rally is over — but profit-taking and sharp pullbacks are possible even inside a bullish trend.
🌎 THE BIGGER CRYPTO PICTURE
BTC reclaiming $80K + strong ETF flows + renewed institutional interest + SOL ETF demand + improving altcoin momentum = a much more constructive setup for the crypto market.
The next few sessions are crucial.
If SOL converts $100–$110 into a strong support zone, the market could start looking toward the next major leg higher. 🚀
Not financial advice. Crypto remains highly volatile — manage risk and never trade more than you can afford to lose.
Are we watching the beginning of SOL's next major move? 👀🔥
#Solana #SOL #SOLUSDT #Binance #BinanceCommunity #Crypto #CryptoNews #Altcoins #Bitcoin #BTC #Ethereum #ETF #SolanaETF #DeFi #Bullish #CryptoMarket #Web3
$SOL
100
#BestBuyQ2RevenueTopsEstimatesLiftsOutlook
📊🔥 Best Buy Q2 Revenue Beats Estimates — Outlook Raised!
’s stronger-than-expected Q2 revenue and improved outlook are more than just a retail story — they could also offer an interesting signal for the crypto & risk-asset market. ₿📈
💡 Why crypto traders may care:
🔹 Consumer resilience: Better retail performance can indicate that consumers are still willing to spend, potentially supporting broader risk appetite across financial markets.
🔹 Tech demand remains important: Best Buy’s exposure to electronics, computing and emerging technology reflects continued demand for tech-related products. Strong technology spending can reinforce the broader narrative around innovation and digital assets.
🔹 Risk-on sentiment: When economic data and corporate earnings come in stronger than expected, investors may become more comfortable taking risk. That can create a supportive backdrop for assets such as Bitcoin and major cryptocurrencies.
🔹 But watch the Fed: Strong economic activity can also complicate the interest-rate outlook. If markets interpret stronger growth as reducing the need for rate cuts, Treasury yields and the U.S. dollar could rise — potentially creating short-term pressure on Bitcoin.
🔹 Bitcoin correlation isn’t guaranteed: Best Buy’s earnings do not directly determine BTC’s price. Crypto will still be driven by liquidity, ETF flows, monetary policy, regulation, derivatives positioning and overall market sentiment.
📌 Bottom line:
A stronger Best Buy outlook is another piece of the macro puzzle. If corporate earnings remain resilient without pushing inflation and interest-rate expectations higher, the environment could remain constructive for risk assets — including crypto.
₿ For Bitcoin traders, the key question is not simply “Is the economy strong?” but “How will strong economic data change liquidity and Fed expectations?”
#BestBuy #Bitcoin #BTC #Crypto #CryptoMarket #StockMarket #RiskOn #Fed #InterestRates #BitcoinNews #BTCUSD #DigitalAssets
#BestBuyQ2RevenueTopsEstimatesLiftsOutlook
📊🔥 Best Buy Q2 Revenue Beats Estimates — Outlook Raised!
’s stronger-than-expected Q2 revenue and improved outlook are more than just a retail story — they could also offer an interesting signal for the crypto & risk-asset market. ₿📈
💡 Why crypto traders may care:
🔹 Consumer resilience: Better retail performance can indicate that consumers are still willing to spend, potentially supporting broader risk appetite across financial markets.
🔹 Tech demand remains important: Best Buy’s exposure to electronics, computing and emerging technology reflects continued demand for tech-related products. Strong technology spending can reinforce the broader narrative around innovation and digital assets.
🔹 Risk-on sentiment: When economic data and corporate earnings come in stronger than expected, investors may become more comfortable taking risk. That can create a supportive backdrop for assets such as Bitcoin and major cryptocurrencies.
🔹 But watch the Fed: Strong economic activity can also complicate the interest-rate outlook. If markets interpret stronger growth as reducing the need for rate cuts, Treasury yields and the U.S. dollar could rise — potentially creating short-term pressure on Bitcoin.
🔹 Bitcoin correlation isn’t guaranteed: Best Buy’s earnings do not directly determine BTC’s price. Crypto will still be driven by liquidity, ETF flows, monetary policy, regulation, derivatives positioning and overall market sentiment.
📌 Bottom line:
A stronger Best Buy outlook is another piece of the macro puzzle. If corporate earnings remain resilient without pushing inflation and interest-rate expectations higher, the environment could remain constructive for risk assets — including crypto.
₿ For Bitcoin traders, the key question is not simply “Is the economy strong?” but “How will strong economic data change liquidity and Fed expectations?”
#BestBuy #Bitcoin #BTC #Crypto #CryptoMarket #StockMarket #RiskOn #Fed #InterestRates #BitcoinNews #BTCUSD #DigitalAssets
📊🔥 Best Buy Q2 Revenue Beats Estimates — Outlook Raised!
’s stronger-than-expected Q2 revenue and improved outlook are more than just a retail story — they could also offer an interesting signal for the crypto & risk-asset market. ₿📈
💡 Why crypto traders may care:
🔹 Consumer resilience: Better retail performance can indicate that consumers are still willing to spend, potentially supporting broader risk appetite across financial markets.
🔹 Tech demand remains important: Best Buy’s exposure to electronics, computing and emerging technology reflects continued demand for tech-related products. Strong technology spending can reinforce the broader narrative around innovation and digital assets.
🔹 Risk-on sentiment: When economic data and corporate earnings come in stronger than expected, investors may become more comfortable taking risk. That can create a supportive backdrop for assets such as Bitcoin and major cryptocurrencies.
🔹 But watch the Fed: Strong economic activity can also complicate the interest-rate outlook. If markets interpret stronger growth as reducing the need for rate cuts, Treasury yields and the U.S. dollar could rise — potentially creating short-term pressure on Bitcoin.
🔹 Bitcoin correlation isn’t guaranteed: Best Buy’s earnings do not directly determine BTC’s price. Crypto will still be driven by liquidity, ETF flows, monetary policy, regulation, derivatives positioning and overall market sentiment.
📌 Bottom line:
A stronger Best Buy outlook is another piece of the macro puzzle. If corporate earnings remain resilient without pushing inflation and interest-rate expectations higher, the environment could remain constructive for risk assets — including crypto.
₿ For Bitcoin traders, the key question is not simply “Is the economy strong?” but “How will strong economic data change liquidity and Fed expectations?”
#BestBuy #Bitcoin #BTC #Crypto #CryptoMarket #StockMarket #RiskOn #Fed #InterestRates #BitcoinNews #BTCUSD #DigitalAssets
93
#BitcoinTops$80KThreeMonthHigh
🚀 BITCOIN TOPS $80K — THREE-MONTH HIGH! ₿🔥
Bitcoin has officially climbed above the $80,000 level, reaching a fresh three-month high and putting the spotlight back on the world’s largest cryptocurrency.
📈 Why this move matters:
• $80K reclaimed: A major psychological and technical milestone for BTC bulls.
• Three-month high: The breakout signals renewed strength after a period of consolidation and volatility.
• Bullish momentum: Sustained trading above $80K could attract fresh buyers and strengthen market confidence.
• Key level to watch: If Bitcoin can turn $80K into strong support, traders may look toward the next resistance zones.
• Risk remains: A rejection above $80K or a quick drop back below the level could trigger profit-taking and short-term volatility.
🔥 The big question now:
Can Bitcoin hold above $80K and build the foundation for the next major rally?
The crypto market is watching. 👀📊
₿ BTC is back in the spotlight.
#Bitcoin #BTC #Bitcoin80K #Crypto #CryptoMarket #BitcoinPrice #BTCUSD #BullMarket #CryptoNews #BitcoinRally
$BTC
{spot}(BTCUSDT)
#BitcoinTops$80KThreeMonthHigh
🚀 BITCOIN TOPS $80K — THREE-MONTH HIGH! ₿🔥
Bitcoin has officially climbed above the $80,000 level, reaching a fresh three-month high and putting the spotlight back on the world’s largest cryptocurrency.
📈 Why this move matters:
• $80K reclaimed: A major psychological and technical milestone for BTC bulls.
• Three-month high: The breakout signals renewed strength after a period of consolidation and volatility.
• Bullish momentum: Sustained trading above $80K could attract fresh buyers and strengthen market confidence.
• Key level to watch: If Bitcoin can turn $80K into strong support, traders may look toward the next resistance zones.
• Risk remains: A rejection above $80K or a quick drop back below the level could trigger profit-taking and short-term volatility.
🔥 The big question now:
Can Bitcoin hold above $80K and build the foundation for the next major rally?
The crypto market is watching. 👀📊
₿ BTC is back in the spotlight.
#Bitcoin #BTC #Bitcoin80K #Crypto #CryptoMarket #BitcoinPrice #BTCUSD #BullMarket #CryptoNews #BitcoinRally
$BTC
🚀 BITCOIN TOPS $80K — THREE-MONTH HIGH! ₿🔥
Bitcoin has officially climbed above the $80,000 level, reaching a fresh three-month high and putting the spotlight back on the world’s largest cryptocurrency.
📈 Why this move matters:
• $80K reclaimed: A major psychological and technical milestone for BTC bulls.
• Three-month high: The breakout signals renewed strength after a period of consolidation and volatility.
• Bullish momentum: Sustained trading above $80K could attract fresh buyers and strengthen market confidence.
• Key level to watch: If Bitcoin can turn $80K into strong support, traders may look toward the next resistance zones.
• Risk remains: A rejection above $80K or a quick drop back below the level could trigger profit-taking and short-term volatility.
🔥 The big question now:
Can Bitcoin hold above $80K and build the foundation for the next major rally?
The crypto market is watching. 👀📊
₿ BTC is back in the spotlight.
#Bitcoin #BTC #Bitcoin80K #Crypto #CryptoMarket #BitcoinPrice #BTCUSD #BullMarket #CryptoNews #BitcoinRally
$BTC
89
#BitcoinHoldsNear$79400
🚨 Bitcoin Holds Near $79,400! ₿
Bitcoin continues to defend the $79.4K level as traders watch closely for the next major move. 📊
🔥 Holding this zone could set the stage for a push toward $80K+.
⚠️ A breakdown could bring renewed selling pressure.
The battle between bulls 🐂 and bears 🐻 is heating up!
#Bitcoin #BTC #Crypto #BitcoinPrice #BTCUSD #CryptoMarket #Bullish
$BTC
{spot}(BTCUSDT)
#BitcoinHoldsNear$79400
🚨 Bitcoin Holds Near $79,400! ₿
Bitcoin continues to defend the $79.4K level as traders watch closely for the next major move. 📊
🔥 Holding this zone could set the stage for a push toward $80K+.
⚠️ A breakdown could bring renewed selling pressure.
The battle between bulls 🐂 and bears 🐻 is heating up!
#Bitcoin #BTC #Crypto #BitcoinPrice #BTCUSD #CryptoMarket #Bullish
$BTC
🚨 Bitcoin Holds Near $79,400! ₿
Bitcoin continues to defend the $79.4K level as traders watch closely for the next major move. 📊
🔥 Holding this zone could set the stage for a push toward $80K+.
⚠️ A breakdown could bring renewed selling pressure.
The battle between bulls 🐂 and bears 🐻 is heating up!
#Bitcoin #BTC #Crypto #BitcoinPrice #BTCUSD #CryptoMarket #Bullish
$BTC
113
#SECSendsCryptoCustodyRuleToWhiteHouse
🚨 BREAKING: #SEC has reportedly sent its crypto custody rule to the White House for review.
🏛️ A potential step toward clearer regulatory rules for how digital assets are held and safeguarded.
📈 Could this be another major milestone for institutional crypto adoption?
#Crypto #Bitcoin #Ethereum #DigitalAssets #SEC #Regulation
#SECSendsCryptoCustodyRuleToWhiteHouse
🚨 BREAKING: #SEC has reportedly sent its crypto custody rule to the White House for review.
🏛️ A potential step toward clearer regulatory rules for how digital assets are held and safeguarded.
📈 Could this be another major milestone for institutional crypto adoption?
#Crypto #Bitcoin #Ethereum #DigitalAssets #SEC #Regulation
🚨 BREAKING: #SEC has reportedly sent its crypto custody rule to the White House for review.
🏛️ A potential step toward clearer regulatory rules for how digital assets are held and safeguarded.
📈 Could this be another major milestone for institutional crypto adoption?
#Crypto #Bitcoin #Ethereum #DigitalAssets #SEC #Regulation
57
#XRPRallies44%InAWeek
🚀 XRP Rallies 44% in Just One Week! 📈
XRP is making a major move, surging 44% in a single week as bullish momentum takes over the market. 🔥
👀 Traders are watching closely to see whether XRP can sustain this rally and push toward new highs.
#XRP #Ripple #Crypto #XRPUSD #Altcoins #CryptoMarket #bullish
$XRP
{spot}(XRPUSDT)
#XRPRallies44%InAWeek
🚀 XRP Rallies 44% in Just One Week! 📈
XRP is making a major move, surging 44% in a single week as bullish momentum takes over the market. 🔥
👀 Traders are watching closely to see whether XRP can sustain this rally and push toward new highs.
#XRP #Ripple #Crypto #XRPUSD #Altcoins #CryptoMarket #bullish
$XRP
🚀 XRP Rallies 44% in Just One Week! 📈
XRP is making a major move, surging 44% in a single week as bullish momentum takes over the market. 🔥
👀 Traders are watching closely to see whether XRP can sustain this rally and push toward new highs.
#XRP #Ripple #Crypto #XRPUSD #Altcoins #CryptoMarket #bullish
$XRP
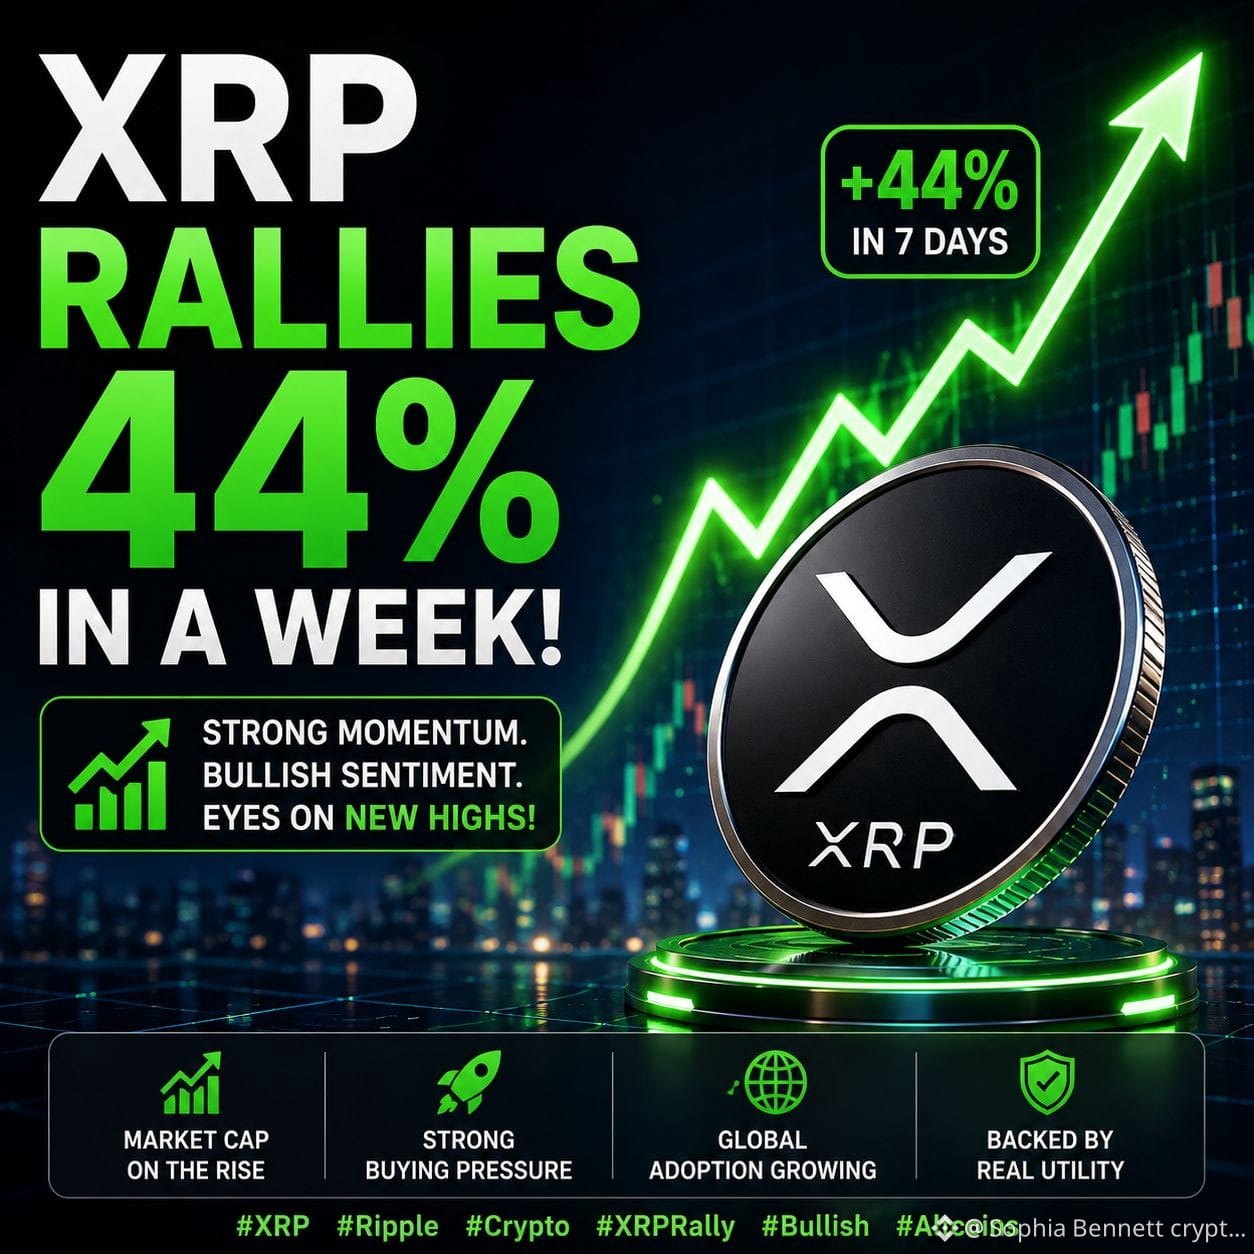
133
Log in to explore more content
Join global crypto users on Binance Square
⚡️ Get latest and useful information about crypto.
💬 Trusted by the world’s largest crypto exchange.
👍 Discover real insights from verified creators.
Email / Phone number
Trending Topics
NEARFallsToAround$4.70Down14%
9,107 views
19 Discussing
🚨 $NEAR — FROM ETF HYPE TO A 14% SLAP IN THE FACE.
NEAR has dropped toward $4.70, giving back a big chunk of its recent run after briefly trading above $5.50. The selloff also came as NEAR Intents disclosed a security incident tied to its cross-chain infrastructure, with reported losses around $3.8M. The underlying NEAR blockchain itself was not reported as compromised.
Here’s the part traders should care about:
$4.69–$4.74 is now the key support zone.
Hold it, and this could simply be a violent retest after the September breakout.
Lose it?
The next downside references sit closer to $4.58, then ~$4.30.
And the irony?
The new Bitwise NEAR ETF was still seeing positive inflows around launch week.
So this isn’t a simple “nobody wants NEAR” story.
It’s a battle between:
fresh institutional access
vs.
post-rally profit-taking + security fear.
$NEAR doesn’t need hype right now. It needs $4.70 to hold. 👀
#NEARFallsToAround$4.70Down14% #EvernorthPlansNasdaqListingOct8 #SECProposesCryptoCustodyFramework #IMFApproves$139MDisbursementToElSalvador #AnthropicTargetsIPOAsSoonAsMidNovember
KimHotbae
·0 Likes
·254 views
EthereumFoundationLaunchesZkAPIOnMainnet
1,058 views
96 Discussing
EvernorthPlansNasdaqListingOct8
8,844 views
120 Discussing