

Crypto Daily Digest
1.3k Posts

Crypto Daily Digest
Report
Block User
Welcome to Crypto Daily Digest, your daily dose of the latest news, trends, and insights from the world of cryptocurrency.
Open Trade
High-Frequency Trader
4.9 Years
47 Following
10.3K+ Followers
61.7K+ Liked
Posts
Portfolio
All
Quotes
Videos
expect $ETH to outperform $BTC
{spot}(ETHUSDT)
{spot}(BTCUSDT)
expect $ETH to outperform $BTC
1
38
·
--
Bullish
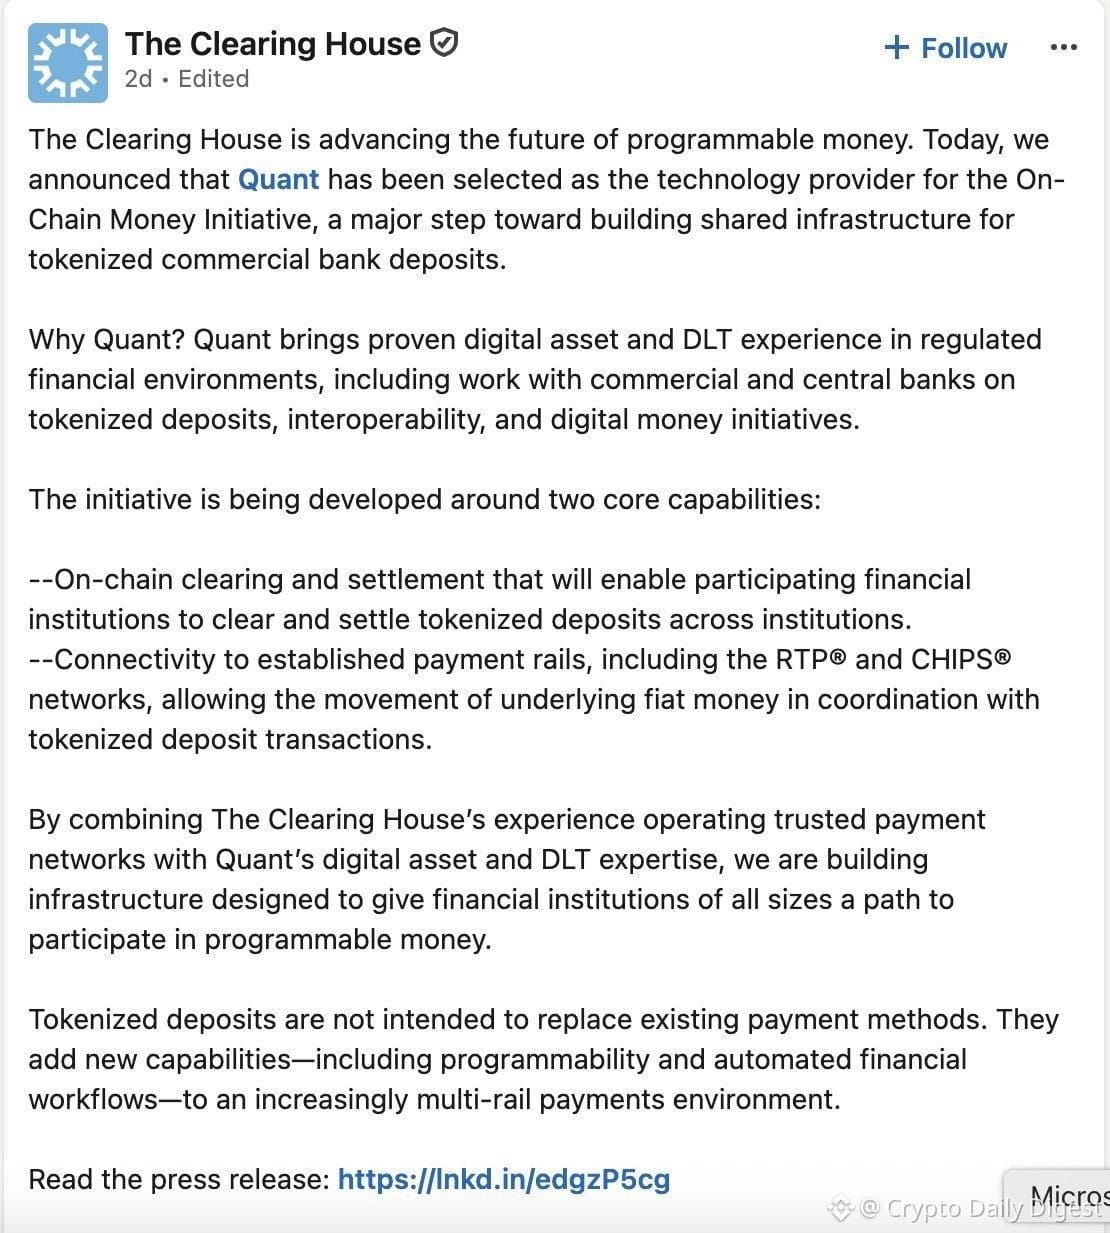
Here's why $QNT is pumping hard
👉 The Clearing House, which settles $2 trillion a day, selected Quant #QNT to power its tokenized deposit network, backed by 25 of the largest US banks 🔥
Here's why $QNT is pumping hard
👉 The Clearing House, which settles $2 trillion a day, selected Quant #QNT to power its tokenized deposit network, backed by 25 of the largest US banks 🔥
👉 The Clearing House, which settles $2 trillion a day, selected Quant #QNT to power its tokenized deposit network, backed by 25 of the largest US banks 🔥
13
🇺🇸HUGE: The CFTC has OFFICIALLY approved Coinbase's own clearinghouse, built for USDC collateral and 24/7 settlement.
Coinbase Clearing is now registered to clear fully collateralized futures, options on futures and swaps, per the CFTC's order.
Coinbase says clearing these contracts directly should speed up development of new regulated products.
It calls Coinbase Clearing the first USDC-native clearinghouse, though it will still use outside partners for some products, including its planned single-stock perps.
#CFTC #coinbase #USDC
🇺🇸HUGE: The CFTC has OFFICIALLY approved Coinbase's own clearinghouse, built for USDC collateral and 24/7 settlement.
Coinbase Clearing is now registered to clear fully collateralized futures, options on futures and swaps, per the CFTC's order.
Coinbase says clearing these contracts directly should speed up development of new regulated products.
It calls Coinbase Clearing the first USDC-native clearinghouse, though it will still use outside partners for some products, including its planned single-stock perps.
#CFTC #coinbase #USDC
Coinbase Clearing is now registered to clear fully collateralized futures, options on futures and swaps, per the CFTC's order.
Coinbase says clearing these contracts directly should speed up development of new regulated products.
It calls Coinbase Clearing the first USDC-native clearinghouse, though it will still use outside partners for some products, including its planned single-stock perps.
#CFTC #coinbase #USDC


58
🇮🇷🇺🇸 NOW: Iranian officials are reportedly pessimistic about striking a deal with the US to end hostilities and reopen the Strait of Hormuz before November's midterms, per Bloomberg.
#iran #usa #StraitofHurmuz #IranUS
🇮🇷🇺🇸 NOW: Iranian officials are reportedly pessimistic about striking a deal with the US to end hostilities and reopen the Strait of Hormuz before November's midterms, per Bloomberg.
#iran #usa #StraitofHurmuz #IranUS
#iran #usa #StraitofHurmuz #IranUS


60
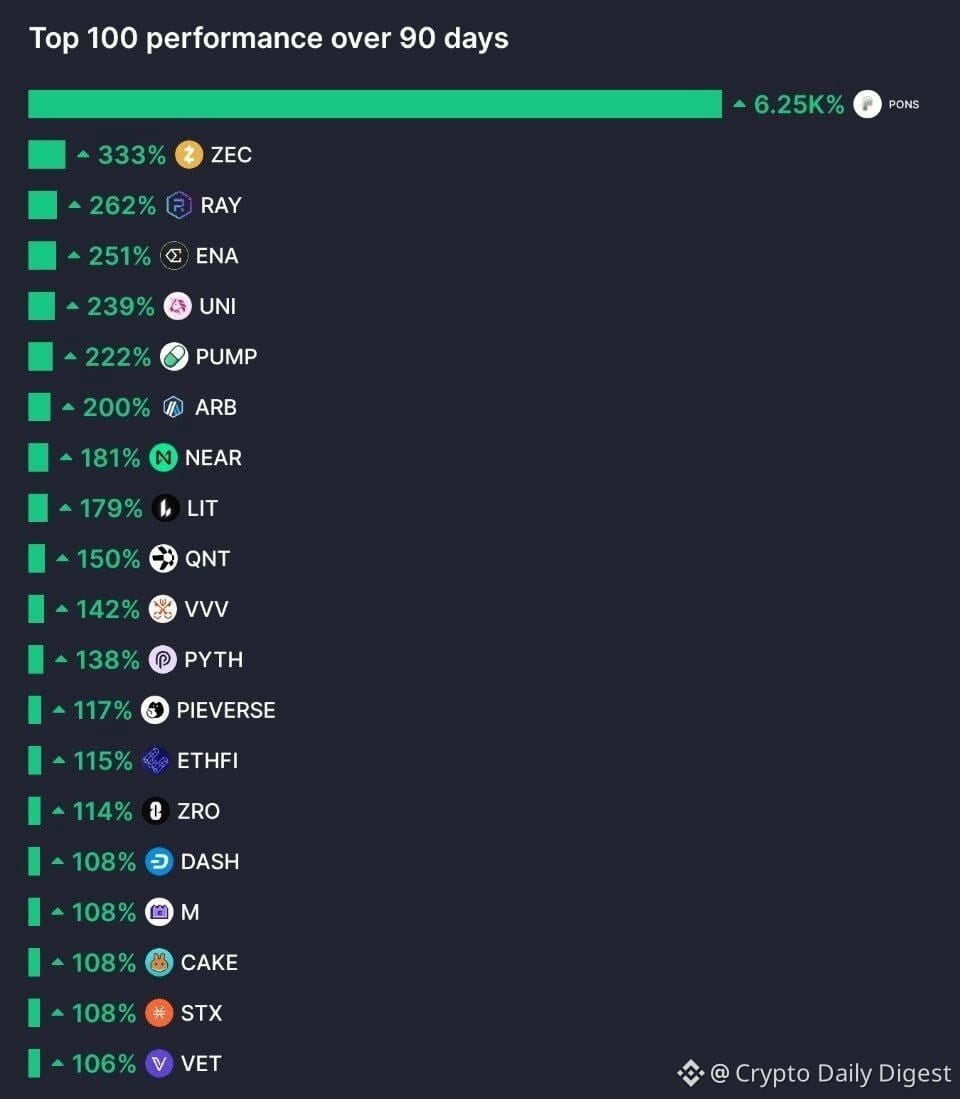
⚡ BIG: Out of the top 100 alts, only 9 are red over the past 90 days.
22 of them are up at least 100%.
⚡ BIG: Out of the top 100 alts, only 9 are red over the past 90 days.
22 of them are up at least 100%.
22 of them are up at least 100%.
92
Article
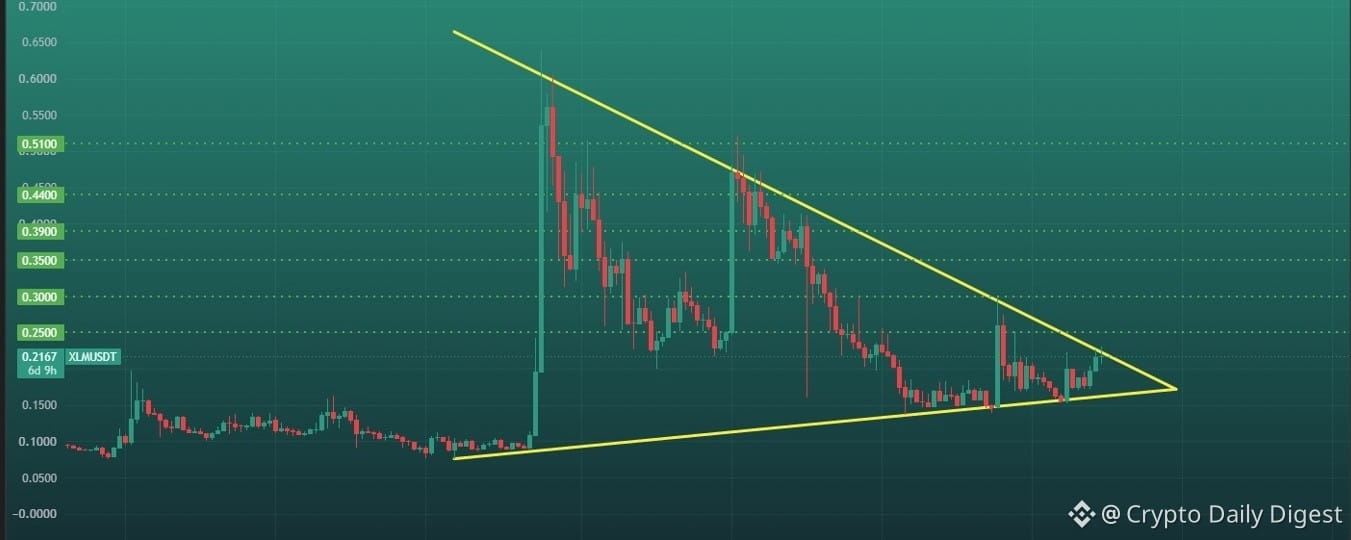
#XLM Weekly: Breakout or Breakdown? The Critical Levels to Watch$XLM (Stellar Lumens/USDT) is consolidating tightly inside a multi-year Symmetrical Triangle pattern on the 1W chart! Price action is compressing toward the apex of this macro triangle, setting up a major structural breakout opportunity.
A decisive weekly candle close above diagonal resistance could trigger an explosive trend reversal back toward key multi-year horizontal levels! 🎯
---
💵 Coin: $XLM #XLM
📈 Pair: XLM/USDT
⏳ Time Frame: 1 Week (1W)
📐 Pattern: Symmetrical Triangle
📍 Current Area: around $0.2167
🎯 Key Resistance Levels: 0.2500 → 0.3000 → 0.3500 → 0.4400 → 0.5100 → 0.6500
🛡️ Major Support: Ascending trendline below price
---
🔺 Pattern Description
📐 The XLM chart on the weekly time frame is showing a Symmetrical Triangle structure, formed by two converging trendlines:
🔻 Descending Resistance — Extends from the major cycle high near $0.6800 (late 2024), connecting lower highs through 2025 and 2026. This line has acted as macro dynamic overhead resistance for over nearly two years.
🔺 Ascending Support — Extends from the macro low around $0.0800 (July 2024), connecting a series of higher lows through 2025 and 2026 (~$0.1200 - $0.1500).
⚡ This structure indicates that volatility is being compressed as price moves closer to a key decision area.
💡 A Symmetrical Triangle is generally considered a continuation/breakout pattern, but the final direction cannot be confirmed until a breakout occurs.
---
🟢 Bullish Scenario
🚀 A sustained weekly candle close above 0.2300 – 0.2500 confirms a breakout from the multi-year symmetrical triangle.
📈 A successful breakout confirmation opens up major upside liquidity targets:
🎯 Target 1: 0.2500 (Triangle breakout validation / Immediate supply)
🎯 Target 2: 0.3000 – 0.3500 (Mid-range structural resistance)
🎯 Target 3: 0.4400 – 0.5100 (Major supply zone / 2025 swing high level)
🚀 Macro Target: 0.6300 (Multi-year pattern height projection)
🔄 After a breakout, a retest of the broken resistance could become an important area to watch for confirmation.
⚠️ If price only breaks the trendline intrawick but closes back inside the triangle, the breakout should be treated with caution as a potential false breakout.
---
🔴 Bearish Scenario
📉 The bearish scenario becomes more relevant if XLM loses the ascending support trendline.
❌ A weekly close below ascending support could indicate that the higher-low structure is beginning to break down.
⚠️ In this situation, the bullish triangle breakout setup could fail, potentially causing price to search for lower support levels.
🔻 Bearish confirmation would become stronger if the breakdown occurs with increased volume and price fails to reclaim the lost support area.
---
🧭 Key Levels
🟢 $0.2500 → First resistance / important breakout area
🟡 $0.3000 → Next resistance
🟠 $0.3500 → Medium-term resistance
🔵 $0.4400 → Next major resistance
🟣 $0.5100 → Major resistance
💎 $0.6374 → Major high shown on the chart
📍 $0.2167 → Approximate price area shown when the chart was created.
🎯 Summary
📊 XLM/USDT is coiling at the apex of a Multi-Year Symmetrical Triangle on the 1W timeframe.
🟢 Bullish: Weekly close above 0.2500 → Triggers high-timeframe expansion toward $0.3000 → $0.3500 → $0.3900 → $0.4400 → $0.5100 → $0.6374.
🔴 Bearish: Breakdown + weekly close below ascending support → could invalidate the triangle structure and increase the risk of further downside.
🎯 Confirmation levels are more important than a simple wick breakout. For a weekly setup like this, waiting for the candle close and observing the price reaction during a retest can help distinguish a valid breakout from a false breakout.
Keep a close eye on weekly volume confirmation—macro apex breakouts typically trigger fast, extended moves! 📈
⚠️ Disclaimer: Not Financial Advice (NFA). Always Do Your Own Research (DYOR) before entering any trade.
💬 Are you accumulating $XLM inside this macro apex or waiting for the weekly candle close above $0.25? Share your price targets below! 👇
#XLM #XLMUSDT #stellar #crypto #WeeklyBreakout #SymmetricalTriangle #Altcoins #TechnicalAnalysiss
#XLM Weekly: Breakout or Breakdown? The Critical Levels to Watch
$XLM (Stellar Lumens/USDT) is consolidating tightly inside a multi-year Symmetrical Triangle pattern on the 1W chart! Price action is compressing toward the apex of this macro triangle, setting up a major structural breakout opportunity.
A decisive weekly candle close above diagonal resistance could trigger an explosive trend reversal back toward key multi-year horizontal levels! 🎯
---
💵 Coin: $XLM #XLM
📈 Pair: XLM/USDT
⏳ Time Frame: 1 Week (1W)
📐 Pattern: Symmetrical Triangle
📍 Current Area: around $0.2167
🎯 Key Resistance Levels: 0.2500 → 0.3000 → 0.3500 → 0.4400 → 0.5100 → 0.6500
🛡️ Major Support: Ascending trendline below price
---
🔺 Pattern Description
📐 The XLM chart on the weekly time frame is showing a Symmetrical Triangle structure, formed by two converging trendlines:
🔻 Descending Resistance — Extends from the major cycle high near $0.6800 (late 2024), connecting lower highs through 2025 and 2026. This line has acted as macro dynamic overhead resistance for over nearly two years.
🔺 Ascending Support — Extends from the macro low around $0.0800 (July 2024), connecting a series of higher lows through 2025 and 2026 (~$0.1200 - $0.1500).
⚡ This structure indicates that volatility is being compressed as price moves closer to a key decision area.
💡 A Symmetrical Triangle is generally considered a continuation/breakout pattern, but the final direction cannot be confirmed until a breakout occurs.
---
🟢 Bullish Scenario
🚀 A sustained weekly candle close above 0.2300 – 0.2500 confirms a breakout from the multi-year symmetrical triangle.
📈 A successful breakout confirmation opens up major upside liquidity targets:
🎯 Target 1: 0.2500 (Triangle breakout validation / Immediate supply)
🎯 Target 2: 0.3000 – 0.3500 (Mid-range structural resistance)
🎯 Target 3: 0.4400 – 0.5100 (Major supply zone / 2025 swing high level)
🚀 Macro Target: 0.6300 (Multi-year pattern height projection)
🔄 After a breakout, a retest of the broken resistance could become an important area to watch for confirmation.
⚠️ If price only breaks the trendline intrawick but closes back inside the triangle, the breakout should be treated with caution as a potential false breakout.
---
🔴 Bearish Scenario
📉 The bearish scenario becomes more relevant if XLM loses the ascending support trendline.
❌ A weekly close below ascending support could indicate that the higher-low structure is beginning to break down.
⚠️ In this situation, the bullish triangle breakout setup could fail, potentially causing price to search for lower support levels.
🔻 Bearish confirmation would become stronger if the breakdown occurs with increased volume and price fails to reclaim the lost support area.
---
🧭 Key Levels
🟢 $0.2500 → First resistance / important breakout area
🟡 $0.3000 → Next resistance
🟠 $0.3500 → Medium-term resistance
🔵 $0.4400 → Next major resistance
🟣 $0.5100 → Major resistance
💎 $0.6374 → Major high shown on the chart
📍 $0.2167 → Approximate price area shown when the chart was created.
🎯 Summary
📊 XLM/USDT is coiling at the apex of a Multi-Year Symmetrical Triangle on the 1W timeframe.
🟢 Bullish: Weekly close above 0.2500 → Triggers high-timeframe expansion toward $0.3000 → $0.3500 → $0.3900 → $0.4400 → $0.5100 → $0.6374.
🔴 Bearish: Breakdown + weekly close below ascending support → could invalidate the triangle structure and increase the risk of further downside.
🎯 Confirmation levels are more important than a simple wick breakout. For a weekly setup like this, waiting for the candle close and observing the price reaction during a retest can help distinguish a valid breakout from a false breakout.
Keep a close eye on weekly volume confirmation—macro apex breakouts typically trigger fast, extended moves! 📈
⚠️ Disclaimer: Not Financial Advice (NFA). Always Do Your Own Research (DYOR) before entering any trade.
💬 Are you accumulating $XLM inside this macro apex or waiting for the weekly candle close above $0.25? Share your price targets below! 👇
#XLM #XLMUSDT #stellar #crypto #WeeklyBreakout #SymmetricalTriangle #Altcoins #TechnicalAnalysiss
A decisive weekly candle close above diagonal resistance could trigger an explosive trend reversal back toward key multi-year horizontal levels! 🎯
---
💵 Coin: $XLM #XLM
📈 Pair: XLM/USDT
⏳ Time Frame: 1 Week (1W)
📐 Pattern: Symmetrical Triangle
📍 Current Area: around $0.2167
🎯 Key Resistance Levels: 0.2500 → 0.3000 → 0.3500 → 0.4400 → 0.5100 → 0.6500
🛡️ Major Support: Ascending trendline below price
---
🔺 Pattern Description
📐 The XLM chart on the weekly time frame is showing a Symmetrical Triangle structure, formed by two converging trendlines:
🔻 Descending Resistance — Extends from the major cycle high near $0.6800 (late 2024), connecting lower highs through 2025 and 2026. This line has acted as macro dynamic overhead resistance for over nearly two years.
🔺 Ascending Support — Extends from the macro low around $0.0800 (July 2024), connecting a series of higher lows through 2025 and 2026 (~$0.1200 - $0.1500).
⚡ This structure indicates that volatility is being compressed as price moves closer to a key decision area.
💡 A Symmetrical Triangle is generally considered a continuation/breakout pattern, but the final direction cannot be confirmed until a breakout occurs.
---
🟢 Bullish Scenario
🚀 A sustained weekly candle close above 0.2300 – 0.2500 confirms a breakout from the multi-year symmetrical triangle.
📈 A successful breakout confirmation opens up major upside liquidity targets:
🎯 Target 1: 0.2500 (Triangle breakout validation / Immediate supply)
🎯 Target 2: 0.3000 – 0.3500 (Mid-range structural resistance)
🎯 Target 3: 0.4400 – 0.5100 (Major supply zone / 2025 swing high level)
🚀 Macro Target: 0.6300 (Multi-year pattern height projection)
🔄 After a breakout, a retest of the broken resistance could become an important area to watch for confirmation.
⚠️ If price only breaks the trendline intrawick but closes back inside the triangle, the breakout should be treated with caution as a potential false breakout.
---
🔴 Bearish Scenario
📉 The bearish scenario becomes more relevant if XLM loses the ascending support trendline.
❌ A weekly close below ascending support could indicate that the higher-low structure is beginning to break down.
⚠️ In this situation, the bullish triangle breakout setup could fail, potentially causing price to search for lower support levels.
🔻 Bearish confirmation would become stronger if the breakdown occurs with increased volume and price fails to reclaim the lost support area.
---
🧭 Key Levels
🟢 $0.2500 → First resistance / important breakout area
🟡 $0.3000 → Next resistance
🟠 $0.3500 → Medium-term resistance
🔵 $0.4400 → Next major resistance
🟣 $0.5100 → Major resistance
💎 $0.6374 → Major high shown on the chart
📍 $0.2167 → Approximate price area shown when the chart was created.
🎯 Summary
📊 XLM/USDT is coiling at the apex of a Multi-Year Symmetrical Triangle on the 1W timeframe.
🟢 Bullish: Weekly close above 0.2500 → Triggers high-timeframe expansion toward $0.3000 → $0.3500 → $0.3900 → $0.4400 → $0.5100 → $0.6374.
🔴 Bearish: Breakdown + weekly close below ascending support → could invalidate the triangle structure and increase the risk of further downside.
🎯 Confirmation levels are more important than a simple wick breakout. For a weekly setup like this, waiting for the candle close and observing the price reaction during a retest can help distinguish a valid breakout from a false breakout.
Keep a close eye on weekly volume confirmation—macro apex breakouts typically trigger fast, extended moves! 📈
⚠️ Disclaimer: Not Financial Advice (NFA). Always Do Your Own Research (DYOR) before entering any trade.
💬 Are you accumulating $XLM inside this macro apex or waiting for the weekly candle close above $0.25? Share your price targets below! 👇
#XLM #XLMUSDT #stellar #crypto #WeeklyBreakout #SymmetricalTriangle #Altcoins #TechnicalAnalysiss
2
159
🔥 #ICP MULTI-YEAR DOWNTREND ENDING SOON! PAY CLOSE ATTENTION!
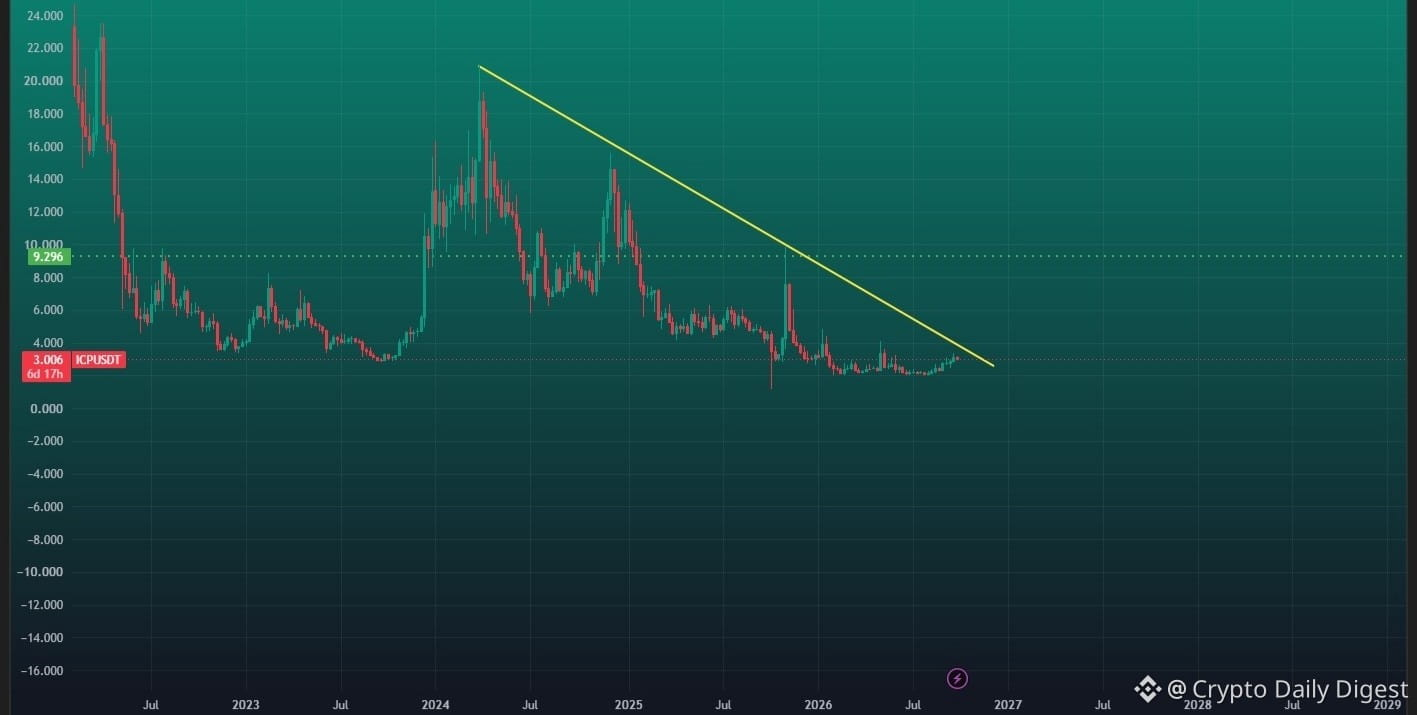
$ICP (Internet Computer/USDT) is approaching the apex of a massive multi-year descending trendline on the 1W chart! Price is consolidating near key historical demand around $3.00, building momentum for a potential macro trend shift.
A clean weekly candle close breaking above the yellow diagonal trendline resistance could trigger an explosive trend reversal back toward major horizontal resistance nodes! 🎯
📊 Technical Snapshot:
• Timeframe: 1-Week (1W) Chart
• Pattern: Multi-Year Diagonal Downtrend / Apex Compression
• Current Price: ~$2.96
• Key Demand Base: $2.80 – $3.00
• Primary Resistance / Trigger Level: ~$4.50 – $5.00
• Macro Target Region: $9.30 – $9.80 (~+200%+ upside potential upon breakout confirmation)
Keep close tabs on weekly volume inflows and the diagonal trendline test before the next major expansion leg! 📈
🎯 Conclusion
📊 ICP/USDT is at a critical macro inflection point on the 1W timeframe, testing a multi-year descending trendline that has suppressed price for over 2 years.
🟢 Bullish: Confirmed 1W candle close above $3.500 → Confirms macro trend reversal toward $4.00, $6.00, and $8.00+.
🔴 Bearish: Rejection at dynamic resistance → Re-enters base accumulation range near $2.800 – $2.200.
⚠️ Macro 1W breakouts carry high reliability, but always wait for the weekly candle to close to confirm the breakout before taking position.
⚠️ Disclaimer: Not Financial Advice (NFA). Always Do Your Own Research (DYOR) before entering any position.
💬 Are you accumulating $ICP at these macro bottom levels or waiting for the weekly trendline breakout? Drop your thoughts below! 👇
#ICP #InternetComputer #ICPUSDT #ICPBTC #CryptoSignals #TechnicalAnalysis #Altcoins #CryptoTrading #Bullish #Bitcoin #DYOR #NFA
{future}(ICPUSDT)
🔥 #ICP MULTI-YEAR DOWNTREND ENDING SOON! PAY CLOSE ATTENTION!
$ICP (Internet Computer/USDT) is approaching the apex of a massive multi-year descending trendline on the 1W chart! Price is consolidating near key historical demand around $3.00, building momentum for a potential macro trend shift.
A clean weekly candle close breaking above the yellow diagonal trendline resistance could trigger an explosive trend reversal back toward major horizontal resistance nodes! 🎯
📊 Technical Snapshot:
• Timeframe: 1-Week (1W) Chart
• Pattern: Multi-Year Diagonal Downtrend / Apex Compression
• Current Price: ~$2.96
• Key Demand Base: $2.80 – $3.00
• Primary Resistance / Trigger Level: ~$4.50 – $5.00
• Macro Target Region: $9.30 – $9.80 (~+200%+ upside potential upon breakout confirmation)
Keep close tabs on weekly volume inflows and the diagonal trendline test before the next major expansion leg! 📈
🎯 Conclusion
📊 ICP/USDT is at a critical macro inflection point on the 1W timeframe, testing a multi-year descending trendline that has suppressed price for over 2 years.
🟢 Bullish: Confirmed 1W candle close above $3.500 → Confirms macro trend reversal toward $4.00, $6.00, and $8.00+.
🔴 Bearish: Rejection at dynamic resistance → Re-enters base accumulation range near $2.800 – $2.200.
⚠️ Macro 1W breakouts carry high reliability, but always wait for the weekly candle to close to confirm the breakout before taking position.
⚠️ Disclaimer: Not Financial Advice (NFA). Always Do Your Own Research (DYOR) before entering any position.
💬 Are you accumulating $ICP at these macro bottom levels or waiting for the weekly trendline breakout? Drop your thoughts below! 👇
#ICP #InternetComputer #ICPUSDT #ICPBTC #CryptoSignals #TechnicalAnalysis #Altcoins #CryptoTrading #Bullish #Bitcoin #DYOR #NFA
$ICP (Internet Computer/USDT) is approaching the apex of a massive multi-year descending trendline on the 1W chart! Price is consolidating near key historical demand around $3.00, building momentum for a potential macro trend shift.
A clean weekly candle close breaking above the yellow diagonal trendline resistance could trigger an explosive trend reversal back toward major horizontal resistance nodes! 🎯
📊 Technical Snapshot:
• Timeframe: 1-Week (1W) Chart
• Pattern: Multi-Year Diagonal Downtrend / Apex Compression
• Current Price: ~$2.96
• Key Demand Base: $2.80 – $3.00
• Primary Resistance / Trigger Level: ~$4.50 – $5.00
• Macro Target Region: $9.30 – $9.80 (~+200%+ upside potential upon breakout confirmation)
Keep close tabs on weekly volume inflows and the diagonal trendline test before the next major expansion leg! 📈
🎯 Conclusion
📊 ICP/USDT is at a critical macro inflection point on the 1W timeframe, testing a multi-year descending trendline that has suppressed price for over 2 years.
🟢 Bullish: Confirmed 1W candle close above $3.500 → Confirms macro trend reversal toward $4.00, $6.00, and $8.00+.
🔴 Bearish: Rejection at dynamic resistance → Re-enters base accumulation range near $2.800 – $2.200.
⚠️ Macro 1W breakouts carry high reliability, but always wait for the weekly candle to close to confirm the breakout before taking position.
⚠️ Disclaimer: Not Financial Advice (NFA). Always Do Your Own Research (DYOR) before entering any position.
💬 Are you accumulating $ICP at these macro bottom levels or waiting for the weekly trendline breakout? Drop your thoughts below! 👇
#ICP #InternetComputer #ICPUSDT #ICPBTC #CryptoSignals #TechnicalAnalysis #Altcoins #CryptoTrading #Bullish #Bitcoin #DYOR #NFA
1
315
Article
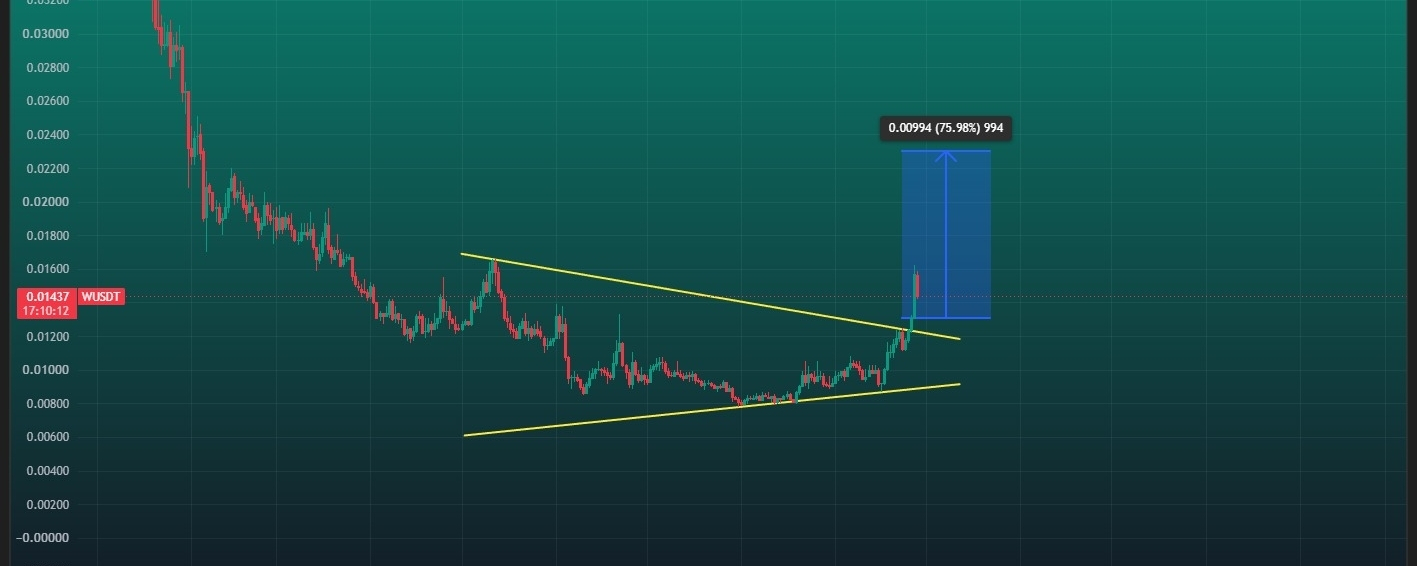
W — Symmetrical Triangle Breakout & Retest in Progress!🔥 #W Symmetrical Triangle Breakout – Retest Phase Active!
$W (Wormhole/USDT) has broken out of its multi-month Symmetrical Triangle pattern on the 1D chart and is currently undergoing a key retest of the broken resistance trendline!
Price spiked to test local highs and is now holding right above the breakout line. A successful retest and bounce off this converted support level could spark a strong expansion wave toward major targets! 🎯
💵 Coin: W (Wormhole) / USDT
⌛ Time Frame: 1D (Daily)
🏦 Exchange: Binance
📍 Current Price: around 0.01437
📉 Pattern: Symmetrical Triangle (Breakout & Retest Phase)
🎯 Current Area: around 0.01437
📉 Immediate Retest Zone: 0.01250 – 0.01300
🎯 Key Resistance: 0.01600 → 0.01800 → 0.02000 → 0.02300 (Measured Target)
🛡️ Key Support: 0.01250 → 0.01000 → 0.00800
📐 Pattern & Technical Structure
🔻 Descending Trendline Resistance
Formed from lower highs since mid-May (~0.01700). This trendline served as dynamic overhead resistance limiting all upside attempts.
🔺 Ascending Support Trendline
Extends across higher lows formed since May (~0.00600) and August (~0.00800), showing persistent accumulation by buyers.
🔄 Breakout & Retest Phase
Price recently pushed out of the triangle apex with a spike up to ~0.01600 and is now pulling back to retest the broken trendline area around 0.01250 – 0.01300 as potential new support.
⚡ Bullish Setup
A successful hold on this retest confirms the symmetrical triangle breakout, signaling the end of multi-month consolidation.
📐 Pattern Explanation — Symmetrical Triangle
A Symmetrical Triangle forms when price action compresses between converging descending resistance and ascending support trendlines:
Lower Highs & Higher Lows: Represents tightening supply and demand balance.
Breakout & Retest: A breakout above the upper boundary followed by a successful retest indicates that buyers have absorbed overhead selling pressure and are ready to initiate a new mark-up phase.
🟢 Bullish Scenario
🚀 If W holds the retest zone at 0.01250 – 0.01300, a follow-through expansion can trigger.
📈 A strong rebound from the retest level targets the following supply zones:
🎯 Target 1: 0.01600 (Recent breakout high)
🎯 Target 2: 0.01800 (Intermediate horizontal resistance)
🎯 Target 3: 0.02000 (Major psychological resistance level)
🚀 Target 4 (Chart Projection): 0.02300 (+75.98% measured target from breakout base)
🔴 Bearish Scenario
⚠️ If W fails to hold above 0.01250 and drops back inside the triangle, the breakout risks turning into a false breakout (fakeout).
📉 Re-entering the pattern would force a retest of lower support boundaries.
🎯 Key Support Levels:
🛡️ 0.01250: Retest support level
🛡️ 0.01000: Mid-triangle horizontal support
🛡️ 0.00800: Ascending support trendline
❌ Bullish Invalidation: A daily candle close below 0.01000.
🎯 Conclusion
📊 W/USDT has executed a clear breakout out of its multi-month Symmetrical Triangle on the 1D chart and is currently retesting broken resistance as support.
🟢 Bullish: Successful retest confirmation around 0.01250 – 0.01300 → Rebound toward 0.01600, 0.01800, and the measured target at 0.02300 (+75.98%).
🔴 Bearish: Breakdown back inside the triangle (< 0.01250) → Risk of retracement toward 0.01000 – 0.00800.
⚠️ Wait for daily candle confirmation and buyer response around the retest zone before taking position.
⚠️ Disclaimer: Not Financial Advice (NFA). Always Do Your Own Research (DYOR) before taking any trade.
💬 Are you taking an entry on this $W retest or waiting for a strong daily bullish close? Share your price targets below! 👇
#w #Wormhole #wusdt #CryptoSignals #TechnicalAnalysis #Altcoins #CryptoTrading #Bullish #Bitcoin #DYOR #NFA
W — Symmetrical Triangle Breakout & Retest in Progress!
🔥 #W Symmetrical Triangle Breakout – Retest Phase Active!
$W (Wormhole/USDT) has broken out of its multi-month Symmetrical Triangle pattern on the 1D chart and is currently undergoing a key retest of the broken resistance trendline!
Price spiked to test local highs and is now holding right above the breakout line. A successful retest and bounce off this converted support level could spark a strong expansion wave toward major targets! 🎯
💵 Coin: W (Wormhole) / USDT
⌛ Time Frame: 1D (Daily)
🏦 Exchange: Binance
📍 Current Price: around 0.01437
📉 Pattern: Symmetrical Triangle (Breakout & Retest Phase)
🎯 Current Area: around 0.01437
📉 Immediate Retest Zone: 0.01250 – 0.01300
🎯 Key Resistance: 0.01600 → 0.01800 → 0.02000 → 0.02300 (Measured Target)
🛡️ Key Support: 0.01250 → 0.01000 → 0.00800
📐 Pattern & Technical Structure
🔻 Descending Trendline Resistance
Formed from lower highs since mid-May (~0.01700). This trendline served as dynamic overhead resistance limiting all upside attempts.
🔺 Ascending Support Trendline
Extends across higher lows formed since May (~0.00600) and August (~0.00800), showing persistent accumulation by buyers.
🔄 Breakout & Retest Phase
Price recently pushed out of the triangle apex with a spike up to ~0.01600 and is now pulling back to retest the broken trendline area around 0.01250 – 0.01300 as potential new support.
⚡ Bullish Setup
A successful hold on this retest confirms the symmetrical triangle breakout, signaling the end of multi-month consolidation.
📐 Pattern Explanation — Symmetrical Triangle
A Symmetrical Triangle forms when price action compresses between converging descending resistance and ascending support trendlines:
Lower Highs & Higher Lows: Represents tightening supply and demand balance.
Breakout & Retest: A breakout above the upper boundary followed by a successful retest indicates that buyers have absorbed overhead selling pressure and are ready to initiate a new mark-up phase.
🟢 Bullish Scenario
🚀 If W holds the retest zone at 0.01250 – 0.01300, a follow-through expansion can trigger.
📈 A strong rebound from the retest level targets the following supply zones:
🎯 Target 1: 0.01600 (Recent breakout high)
🎯 Target 2: 0.01800 (Intermediate horizontal resistance)
🎯 Target 3: 0.02000 (Major psychological resistance level)
🚀 Target 4 (Chart Projection): 0.02300 (+75.98% measured target from breakout base)
🔴 Bearish Scenario
⚠️ If W fails to hold above 0.01250 and drops back inside the triangle, the breakout risks turning into a false breakout (fakeout).
📉 Re-entering the pattern would force a retest of lower support boundaries.
🎯 Key Support Levels:
🛡️ 0.01250: Retest support level
🛡️ 0.01000: Mid-triangle horizontal support
🛡️ 0.00800: Ascending support trendline
❌ Bullish Invalidation: A daily candle close below 0.01000.
🎯 Conclusion
📊 W/USDT has executed a clear breakout out of its multi-month Symmetrical Triangle on the 1D chart and is currently retesting broken resistance as support.
🟢 Bullish: Successful retest confirmation around 0.01250 – 0.01300 → Rebound toward 0.01600, 0.01800, and the measured target at 0.02300 (+75.98%).
🔴 Bearish: Breakdown back inside the triangle (< 0.01250) → Risk of retracement toward 0.01000 – 0.00800.
⚠️ Wait for daily candle confirmation and buyer response around the retest zone before taking position.
⚠️ Disclaimer: Not Financial Advice (NFA). Always Do Your Own Research (DYOR) before taking any trade.
💬 Are you taking an entry on this $W retest or waiting for a strong daily bullish close? Share your price targets below! 👇
#w #Wormhole #wusdt #CryptoSignals #TechnicalAnalysis #Altcoins #CryptoTrading #Bullish #Bitcoin #DYOR #NFA
$W (Wormhole/USDT) has broken out of its multi-month Symmetrical Triangle pattern on the 1D chart and is currently undergoing a key retest of the broken resistance trendline!
Price spiked to test local highs and is now holding right above the breakout line. A successful retest and bounce off this converted support level could spark a strong expansion wave toward major targets! 🎯
💵 Coin: W (Wormhole) / USDT
⌛ Time Frame: 1D (Daily)
🏦 Exchange: Binance
📍 Current Price: around 0.01437
📉 Pattern: Symmetrical Triangle (Breakout & Retest Phase)
🎯 Current Area: around 0.01437
📉 Immediate Retest Zone: 0.01250 – 0.01300
🎯 Key Resistance: 0.01600 → 0.01800 → 0.02000 → 0.02300 (Measured Target)
🛡️ Key Support: 0.01250 → 0.01000 → 0.00800
📐 Pattern & Technical Structure
🔻 Descending Trendline Resistance
Formed from lower highs since mid-May (~0.01700). This trendline served as dynamic overhead resistance limiting all upside attempts.
🔺 Ascending Support Trendline
Extends across higher lows formed since May (~0.00600) and August (~0.00800), showing persistent accumulation by buyers.
🔄 Breakout & Retest Phase
Price recently pushed out of the triangle apex with a spike up to ~0.01600 and is now pulling back to retest the broken trendline area around 0.01250 – 0.01300 as potential new support.
⚡ Bullish Setup
A successful hold on this retest confirms the symmetrical triangle breakout, signaling the end of multi-month consolidation.
📐 Pattern Explanation — Symmetrical Triangle
A Symmetrical Triangle forms when price action compresses between converging descending resistance and ascending support trendlines:
Lower Highs & Higher Lows: Represents tightening supply and demand balance.
Breakout & Retest: A breakout above the upper boundary followed by a successful retest indicates that buyers have absorbed overhead selling pressure and are ready to initiate a new mark-up phase.
🟢 Bullish Scenario
🚀 If W holds the retest zone at 0.01250 – 0.01300, a follow-through expansion can trigger.
📈 A strong rebound from the retest level targets the following supply zones:
🎯 Target 1: 0.01600 (Recent breakout high)
🎯 Target 2: 0.01800 (Intermediate horizontal resistance)
🎯 Target 3: 0.02000 (Major psychological resistance level)
🚀 Target 4 (Chart Projection): 0.02300 (+75.98% measured target from breakout base)
🔴 Bearish Scenario
⚠️ If W fails to hold above 0.01250 and drops back inside the triangle, the breakout risks turning into a false breakout (fakeout).
📉 Re-entering the pattern would force a retest of lower support boundaries.
🎯 Key Support Levels:
🛡️ 0.01250: Retest support level
🛡️ 0.01000: Mid-triangle horizontal support
🛡️ 0.00800: Ascending support trendline
❌ Bullish Invalidation: A daily candle close below 0.01000.
🎯 Conclusion
📊 W/USDT has executed a clear breakout out of its multi-month Symmetrical Triangle on the 1D chart and is currently retesting broken resistance as support.
🟢 Bullish: Successful retest confirmation around 0.01250 – 0.01300 → Rebound toward 0.01600, 0.01800, and the measured target at 0.02300 (+75.98%).
🔴 Bearish: Breakdown back inside the triangle (< 0.01250) → Risk of retracement toward 0.01000 – 0.00800.
⚠️ Wait for daily candle confirmation and buyer response around the retest zone before taking position.
⚠️ Disclaimer: Not Financial Advice (NFA). Always Do Your Own Research (DYOR) before taking any trade.
💬 Are you taking an entry on this $W retest or waiting for a strong daily bullish close? Share your price targets below! 👇
#w #Wormhole #wusdt #CryptoSignals #TechnicalAnalysis #Altcoins #CryptoTrading #Bullish #Bitcoin #DYOR #NFA
1
412
Article
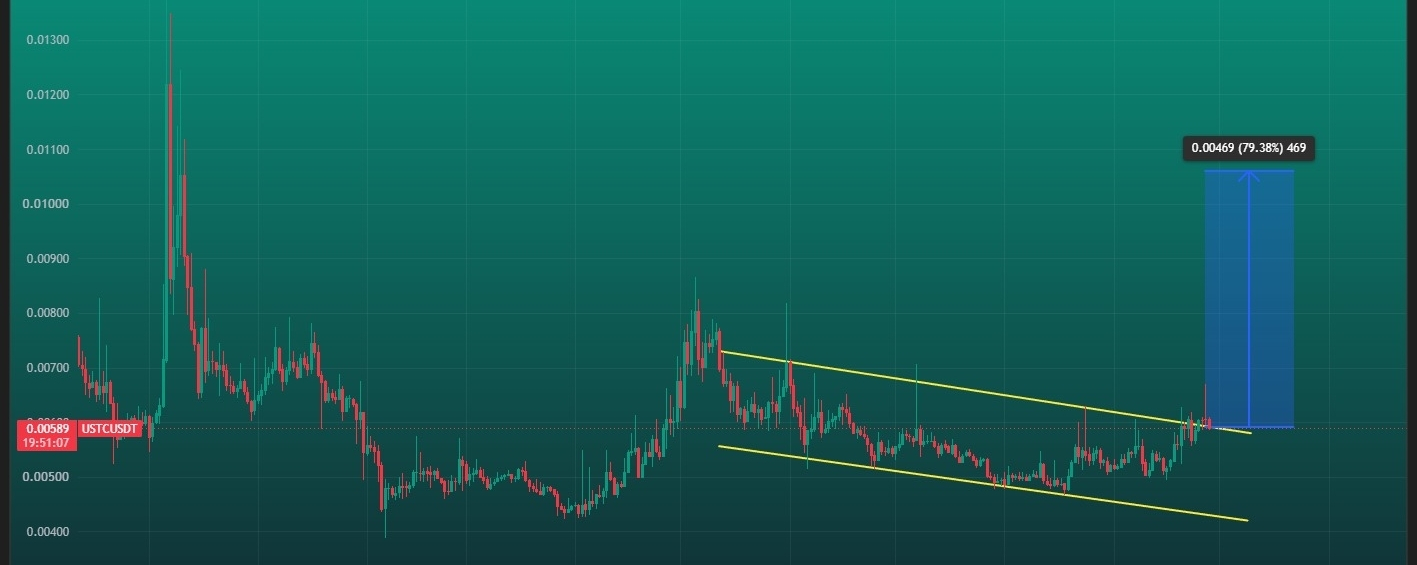
🔥 #USTC — Descending Channel Breakout & Retest in Progress! 80%+ Rally Loading? 🚀📈$USTC (TerraClassicUSD/USDT) has broken out of its multi-month Descending Channel on the 1D chart and is currently undergoing a key retest phase!
Price action spiked above the upper resistance trendline and is now pulling back to test the broken trendline as new support. A successful bounce from this retest zone could ignite a powerful bullish wave toward major targets! 🎯
💵 Coin: USTC (TerraClassicUSD) / USDT
⌛ Time Frame: 1D (Daily)
🏦 Exchange: Binance
📍 Current Price: around 0.00598
📉 Pattern: Descending Channel (Breakout & Retest Phase)
🎯 Current Area: around 0.00598
📉 Immediate Support / Retest Zone: 0.00580 – 0.00600
🎯 Key Resistance: 0.00650 → 0.00715 → 0.00800 → 0.00900 → 0.01080
🛡️ Key Support: 0.00580 → 0.00500 → 0.00450 → 0.00425
📐 Pattern & Technical Structure
🔻 Upper Descending Channel Trendline
Extends across consecutive lower highs since mid-May (~0.00730–0.00800). This dynamic line served as strong overhead resistance for over 4 months.
🔺 Lower Descending Channel Trendline
Connects the series of lower lows, establishing a well-defined downward channel boundary down to the 0.00450 support zone.
🔄 Breakout & Retest Phase
Price action recently pushed above the upper channel resistance trendline. It is now pulling back to retest the broken trendline (around 0.00580 – 0.00600) as potential new support.
⚡ Bullish Reversal Setup A successful hold during this retest phase validates the channel breakout, flipping market structure from bearish to bullish.
📐 Pattern Explanation — Descending ChannelA 🔻 Descending Channel is formed by two parallel downward-sloping trendlines containing lower highs and lower lows:
Dynamic Overhead Resistance: Limits upside spikes.
Dynamic Base Support: Serves as a recurring buyer defense line.
When price breaks above the upper boundary and completes a successful retest, it signals seller exhaustion and opens the door for a major bullish expansion.
🟢 Bullish Scenario
🚀 If USTC holds above the 0.00580 – 0.00600 retest zone, a massive follow-through rally could begin.
📈 A strong rebound from this retest area targets key overhead supply levels:
🎯 Target 1: 0.00650 (Immediate swing resistance / recent wick peak)
🎯 Target 2: 0.00715 (Prior major channel high / +20%)
🎯 Target 3: 0.00800 (Major high-timeframe supply peak / +34%)
🚀 Target 4 (Macro Target): 0.00900 – 0.01080 (Measured channel move / +80%+ potential rally)
🔴 Bearish Scenario
⚠️ If the retest fails and USTC drops back inside the channel with a daily candle close below 0.00580, the breakout becomes a false breakout (fake out).
📉 Under this condition, price could slide back toward lower support levels within the channel structure.
🎯 Key Support Levels:
🛡️ 0.00580: Breakout retest line
🛡️ 0.00500: Intermediate horizontal support
🛡️ 0.00450: Lower channel boundary
❌ Bullish Invalidation: A daily candle close below 0.00550.
🎯 Conclusion
📊 USTC/USDT has executed a high-timeframe breakout out of a Descending Channel on the 1D chart and is currently undergoing a crucial retest.
🟢 Bullish: Successful hold at 0.00580 – 0.00600 → Rebound toward 0.00715, 0.00800, and 0.01080 (+80%+).
🔴 Bearish: Acceptance back inside the channel (< 0.00550) → Fake out confirmed, retesting lower support near 0.00500 – 0.00450.
⚠️ Wait for a daily candle confirmation demonstrating buyer support on the retest before managing positions.
⚠️ Disclaimer: Not Financial Advice (NFA). Always Do Your Own Research (DYOR) before entering any trade.
💬 Are you taking an entry on this retest or waiting for a bullish reversal candle? Share your price targets below! 👇
#USTC #TerraClassicUSD #USTCUSDT #CryptoSignals #TechnicalAnalysis #altcoins #CryptoTrading #Bullish #Bitcoin #DYOR #NFA
🔥 #USTC — Descending Channel Breakout & Retest in Progress! 80%+ Rally Loading? 🚀📈
$USTC (TerraClassicUSD/USDT) has broken out of its multi-month Descending Channel on the 1D chart and is currently undergoing a key retest phase!
Price action spiked above the upper resistance trendline and is now pulling back to test the broken trendline as new support. A successful bounce from this retest zone could ignite a powerful bullish wave toward major targets! 🎯
💵 Coin: USTC (TerraClassicUSD) / USDT
⌛ Time Frame: 1D (Daily)
🏦 Exchange: Binance
📍 Current Price: around 0.00598
📉 Pattern: Descending Channel (Breakout & Retest Phase)
🎯 Current Area: around 0.00598
📉 Immediate Support / Retest Zone: 0.00580 – 0.00600
🎯 Key Resistance: 0.00650 → 0.00715 → 0.00800 → 0.00900 → 0.01080
🛡️ Key Support: 0.00580 → 0.00500 → 0.00450 → 0.00425
📐 Pattern & Technical Structure
🔻 Upper Descending Channel Trendline
Extends across consecutive lower highs since mid-May (~0.00730–0.00800). This dynamic line served as strong overhead resistance for over 4 months.
🔺 Lower Descending Channel Trendline
Connects the series of lower lows, establishing a well-defined downward channel boundary down to the 0.00450 support zone.
🔄 Breakout & Retest Phase
Price action recently pushed above the upper channel resistance trendline. It is now pulling back to retest the broken trendline (around 0.00580 – 0.00600) as potential new support.
⚡ Bullish Reversal Setup A successful hold during this retest phase validates the channel breakout, flipping market structure from bearish to bullish.
📐 Pattern Explanation — Descending ChannelA 🔻 Descending Channel is formed by two parallel downward-sloping trendlines containing lower highs and lower lows:
Dynamic Overhead Resistance: Limits upside spikes.
Dynamic Base Support: Serves as a recurring buyer defense line.
When price breaks above the upper boundary and completes a successful retest, it signals seller exhaustion and opens the door for a major bullish expansion.
🟢 Bullish Scenario
🚀 If USTC holds above the 0.00580 – 0.00600 retest zone, a massive follow-through rally could begin.
📈 A strong rebound from this retest area targets key overhead supply levels:
🎯 Target 1: 0.00650 (Immediate swing resistance / recent wick peak)
🎯 Target 2: 0.00715 (Prior major channel high / +20%)
🎯 Target 3: 0.00800 (Major high-timeframe supply peak / +34%)
🚀 Target 4 (Macro Target): 0.00900 – 0.01080 (Measured channel move / +80%+ potential rally)
🔴 Bearish Scenario
⚠️ If the retest fails and USTC drops back inside the channel with a daily candle close below 0.00580, the breakout becomes a false breakout (fake out).
📉 Under this condition, price could slide back toward lower support levels within the channel structure.
🎯 Key Support Levels:
🛡️ 0.00580: Breakout retest line
🛡️ 0.00500: Intermediate horizontal support
🛡️ 0.00450: Lower channel boundary
❌ Bullish Invalidation: A daily candle close below 0.00550.
🎯 Conclusion
📊 USTC/USDT has executed a high-timeframe breakout out of a Descending Channel on the 1D chart and is currently undergoing a crucial retest.
🟢 Bullish: Successful hold at 0.00580 – 0.00600 → Rebound toward 0.00715, 0.00800, and 0.01080 (+80%+).
🔴 Bearish: Acceptance back inside the channel (< 0.00550) → Fake out confirmed, retesting lower support near 0.00500 – 0.00450.
⚠️ Wait for a daily candle confirmation demonstrating buyer support on the retest before managing positions.
⚠️ Disclaimer: Not Financial Advice (NFA). Always Do Your Own Research (DYOR) before entering any trade.
💬 Are you taking an entry on this retest or waiting for a bullish reversal candle? Share your price targets below! 👇
#USTC #TerraClassicUSD #USTCUSDT #CryptoSignals #TechnicalAnalysis #altcoins #CryptoTrading #Bullish #Bitcoin #DYOR #NFA
Price action spiked above the upper resistance trendline and is now pulling back to test the broken trendline as new support. A successful bounce from this retest zone could ignite a powerful bullish wave toward major targets! 🎯
💵 Coin: USTC (TerraClassicUSD) / USDT
⌛ Time Frame: 1D (Daily)
🏦 Exchange: Binance
📍 Current Price: around 0.00598
📉 Pattern: Descending Channel (Breakout & Retest Phase)
🎯 Current Area: around 0.00598
📉 Immediate Support / Retest Zone: 0.00580 – 0.00600
🎯 Key Resistance: 0.00650 → 0.00715 → 0.00800 → 0.00900 → 0.01080
🛡️ Key Support: 0.00580 → 0.00500 → 0.00450 → 0.00425
📐 Pattern & Technical Structure
🔻 Upper Descending Channel Trendline
Extends across consecutive lower highs since mid-May (~0.00730–0.00800). This dynamic line served as strong overhead resistance for over 4 months.
🔺 Lower Descending Channel Trendline
Connects the series of lower lows, establishing a well-defined downward channel boundary down to the 0.00450 support zone.
🔄 Breakout & Retest Phase
Price action recently pushed above the upper channel resistance trendline. It is now pulling back to retest the broken trendline (around 0.00580 – 0.00600) as potential new support.
⚡ Bullish Reversal Setup A successful hold during this retest phase validates the channel breakout, flipping market structure from bearish to bullish.
📐 Pattern Explanation — Descending ChannelA 🔻 Descending Channel is formed by two parallel downward-sloping trendlines containing lower highs and lower lows:
Dynamic Overhead Resistance: Limits upside spikes.
Dynamic Base Support: Serves as a recurring buyer defense line.
When price breaks above the upper boundary and completes a successful retest, it signals seller exhaustion and opens the door for a major bullish expansion.
🟢 Bullish Scenario
🚀 If USTC holds above the 0.00580 – 0.00600 retest zone, a massive follow-through rally could begin.
📈 A strong rebound from this retest area targets key overhead supply levels:
🎯 Target 1: 0.00650 (Immediate swing resistance / recent wick peak)
🎯 Target 2: 0.00715 (Prior major channel high / +20%)
🎯 Target 3: 0.00800 (Major high-timeframe supply peak / +34%)
🚀 Target 4 (Macro Target): 0.00900 – 0.01080 (Measured channel move / +80%+ potential rally)
🔴 Bearish Scenario
⚠️ If the retest fails and USTC drops back inside the channel with a daily candle close below 0.00580, the breakout becomes a false breakout (fake out).
📉 Under this condition, price could slide back toward lower support levels within the channel structure.
🎯 Key Support Levels:
🛡️ 0.00580: Breakout retest line
🛡️ 0.00500: Intermediate horizontal support
🛡️ 0.00450: Lower channel boundary
❌ Bullish Invalidation: A daily candle close below 0.00550.
🎯 Conclusion
📊 USTC/USDT has executed a high-timeframe breakout out of a Descending Channel on the 1D chart and is currently undergoing a crucial retest.
🟢 Bullish: Successful hold at 0.00580 – 0.00600 → Rebound toward 0.00715, 0.00800, and 0.01080 (+80%+).
🔴 Bearish: Acceptance back inside the channel (< 0.00550) → Fake out confirmed, retesting lower support near 0.00500 – 0.00450.
⚠️ Wait for a daily candle confirmation demonstrating buyer support on the retest before managing positions.
⚠️ Disclaimer: Not Financial Advice (NFA). Always Do Your Own Research (DYOR) before entering any trade.
💬 Are you taking an entry on this retest or waiting for a bullish reversal candle? Share your price targets below! 👇
#USTC #TerraClassicUSD #USTCUSDT #CryptoSignals #TechnicalAnalysis #altcoins #CryptoTrading #Bullish #Bitcoin #DYOR #NFA
2
252
🔥TOM LEE: Inflation could FALL sharply over the next 6 months, giving the Fed room to walk back its hawkish stance.
“I think the probability is really high it’s gonna drop.”
For him, HOUSING is the pressure point to watch.
Lee argues that for inflation to accelerate from here, housing prices would need to rise significantly, while higher rates should help contain that pressure. - cnbc
#TomLee #Inflation #TomLeeCrypto #TomLeeForecast #hawkish $BTC
🔥TOM LEE: Inflation could FALL sharply over the next 6 months, giving the Fed room to walk back its hawkish stance.
“I think the probability is really high it’s gonna drop.”
For him, HOUSING is the pressure point to watch.
Lee argues that for inflation to accelerate from here, housing prices would need to rise significantly, while higher rates should help contain that pressure. - cnbc
#TomLee #Inflation #TomLeeCrypto #TomLeeForecast #hawkish $BTC
“I think the probability is really high it’s gonna drop.”
For him, HOUSING is the pressure point to watch.
Lee argues that for inflation to accelerate from here, housing prices would need to rise significantly, while higher rates should help contain that pressure. - cnbc
#TomLee #Inflation #TomLeeCrypto #TomLeeForecast #hawkish $BTC
88
🚨 ALTSEASON IS COMING!!!
Altcoin dominance has broken out of its 57 months downtrend.
100%-500% pumps are near & generational wealth will be made. 🚀 - TMA
#Altseason #bullish #ALT #crypto
🚨 ALTSEASON IS COMING!!!
Altcoin dominance has broken out of its 57 months downtrend.
100%-500% pumps are near & generational wealth will be made. 🚀 - TMA
#Altseason #bullish #ALT #crypto
Altcoin dominance has broken out of its 57 months downtrend.
100%-500% pumps are near & generational wealth will be made. 🚀 - TMA
#Altseason #bullish #ALT #crypto
2
2
762
🔥 BIG: Binance now owns $100M of Circle stock and signed a five-year deal to push USDC to its users.
The world's biggest exchange is now a shareholder in the company behind USDC.
🔥 BIG: Binance now owns $100M of Circle stock and signed a five-year deal to push USDC to its users.
The world's biggest exchange is now a shareholder in the company behind USDC.
The world's biggest exchange is now a shareholder in the company behind USDC.


20
BREAKING: Canada’s purchases of US cars hit a new low as Trump’s tariffs hurt American automakers
BREAKING: Canada’s purchases of US cars hit a new low as Trump’s tariffs hurt American automakers
64
JUST IN: Michael Saylor says "I have never been more bullish on Bitcoin"
JUST IN: Michael Saylor says "I have never been more bullish on Bitcoin"
83
·
--
Bearish
⚠️️ #iran fired ballistic missiles 2 hours ago.... this is why market dumpd ✅
⚠️️ #iran fired ballistic missiles 2 hours ago.... this is why market dumpd ✅
Crypto Daily Digest
·
--
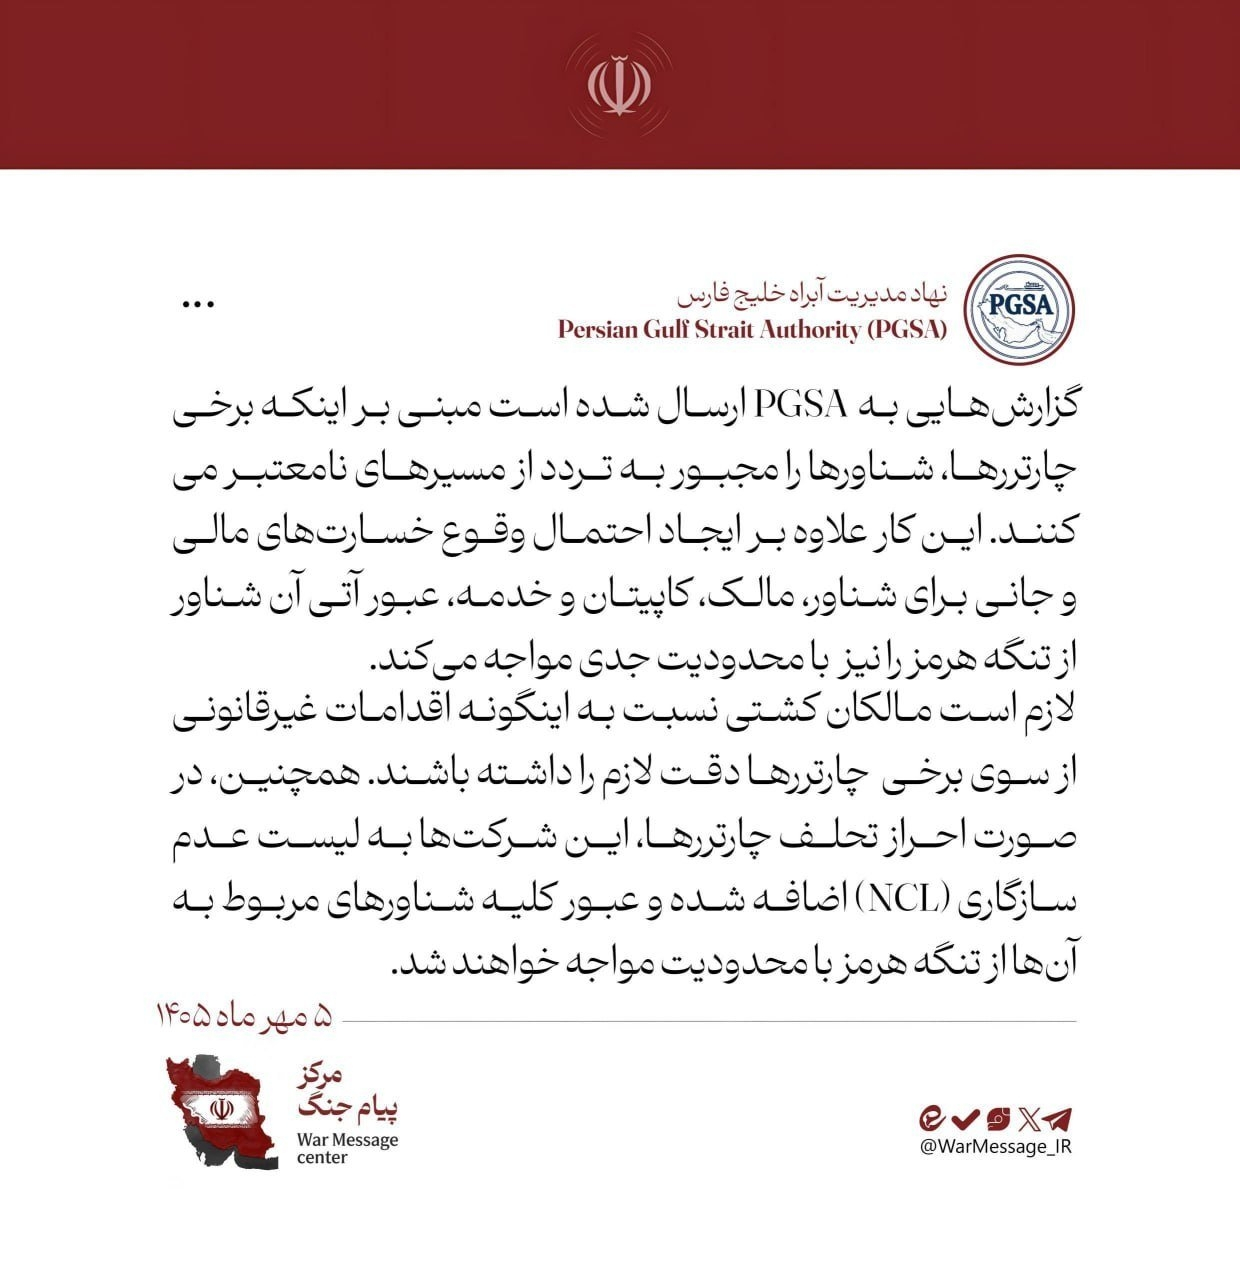
🚨🇮🇷 BREAKING: Iran reportedly fired missiles into the Strait of Hormuz as it threatened to blacklist companies routing ships around its rules
Four short-range ballistic missiles reportedly went into the water, with explosions also heard near Qeshm Island.
Nothing has been confirmed yet by Washington or any maritime agency.
At the same time, Iran's Persian Gulf State Authority warned that charterers forcing ships through unapproved routes will be added to a blacklist, with every vessel tied to them facing restrictions in the strait:
"Shipowners must ensure that their charterers do not engage in illegal activities."
Source: Geopolitics Watch on TG / Writers: Daniel, Jamie
Four short-range ballistic missiles reportedly went into the water, with explosions also heard near Qeshm Island.
Nothing has been confirmed yet by Washington or any maritime agency.
At the same time, Iran's Persian Gulf State Authority warned that charterers forcing ships through unapproved routes will be added to a blacklist, with every vessel tied to them facing restrictions in the strait:
"Shipowners must ensure that their charterers do not engage in illegal activities."
Source: Geopolitics Watch on TG / Writers: Daniel, Jamie

75
🚨🇮🇷 BREAKING: Iran reportedly fired missiles into the Strait of Hormuz as it threatened to blacklist companies routing ships around its rules
Four short-range ballistic missiles reportedly went into the water, with explosions also heard near Qeshm Island.
Nothing has been confirmed yet by Washington or any maritime agency.
At the same time, Iran's Persian Gulf State Authority warned that charterers forcing ships through unapproved routes will be added to a blacklist, with every vessel tied to them facing restrictions in the strait:
"Shipowners must ensure that their charterers do not engage in illegal activities."
Source: Geopolitics Watch on TG / Writers: Daniel, Jamie
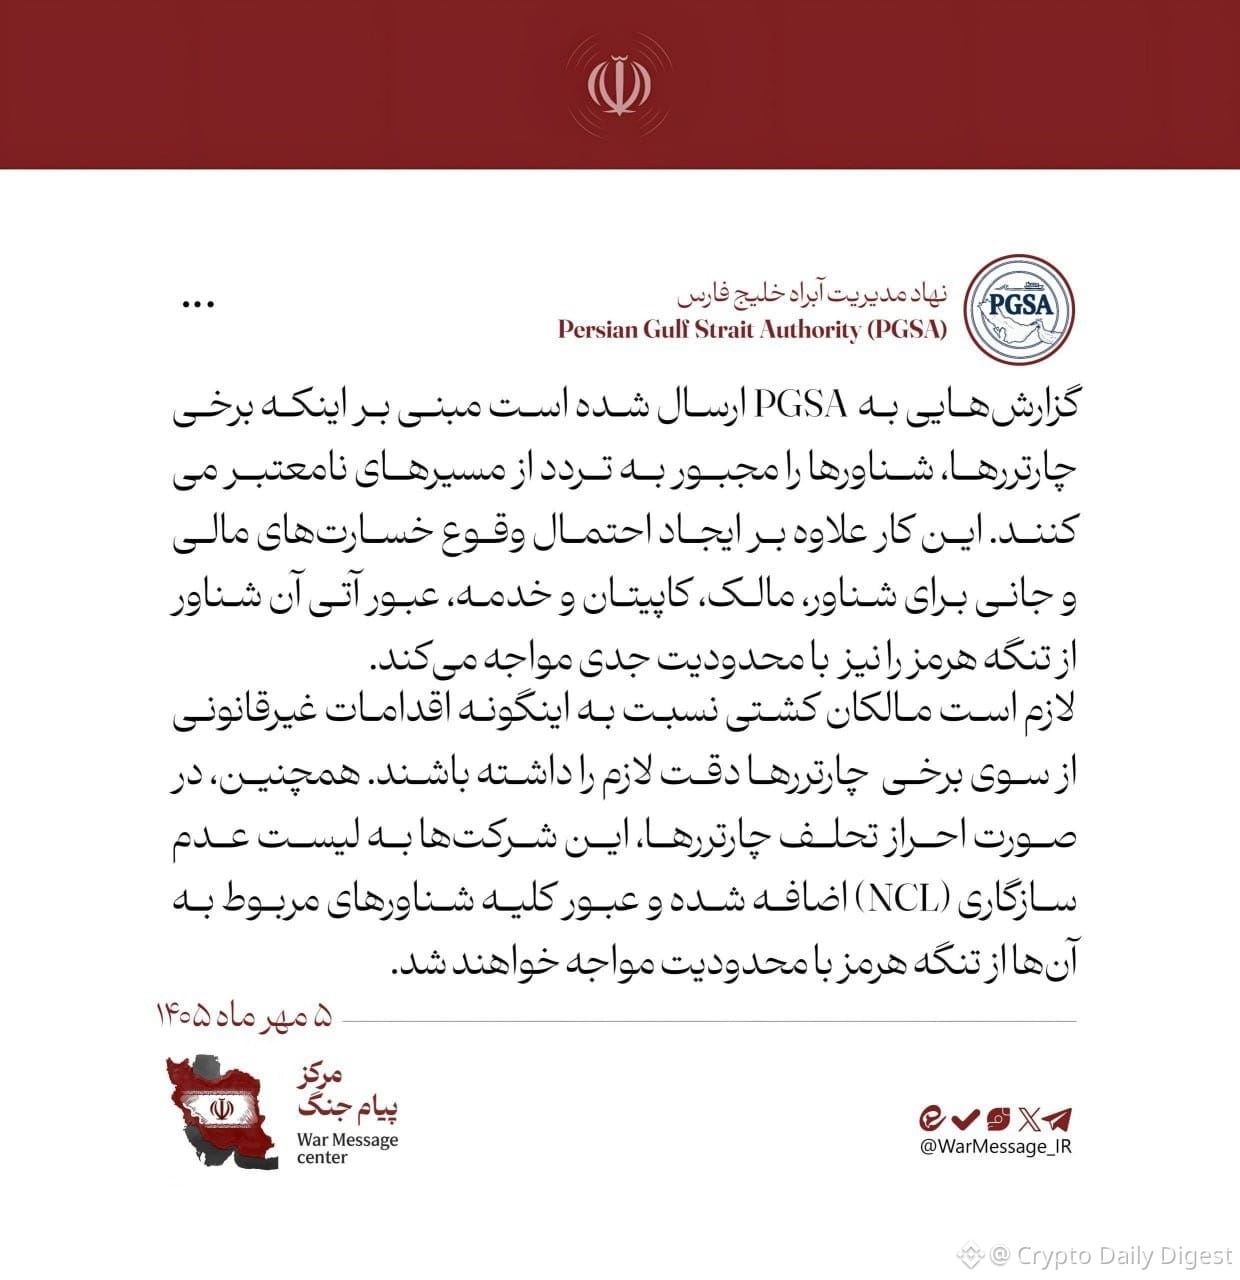
🚨🇮🇷 BREAKING: Iran reportedly fired missiles into the Strait of Hormuz as it threatened to blacklist companies routing ships around its rules
Four short-range ballistic missiles reportedly went into the water, with explosions also heard near Qeshm Island.
Nothing has been confirmed yet by Washington or any maritime agency.
At the same time, Iran's Persian Gulf State Authority warned that charterers forcing ships through unapproved routes will be added to a blacklist, with every vessel tied to them facing restrictions in the strait:
"Shipowners must ensure that their charterers do not engage in illegal activities."
Source: Geopolitics Watch on TG / Writers: Daniel, Jamie
Four short-range ballistic missiles reportedly went into the water, with explosions also heard near Qeshm Island.
Nothing has been confirmed yet by Washington or any maritime agency.
At the same time, Iran's Persian Gulf State Authority warned that charterers forcing ships through unapproved routes will be added to a blacklist, with every vessel tied to them facing restrictions in the strait:
"Shipowners must ensure that their charterers do not engage in illegal activities."
Source: Geopolitics Watch on TG / Writers: Daniel, Jamie

1
2
76


Crypto Daily Digest
·
--
JUST IN: 🇺🇸🇨🇳 United States and China reach deal to cut tariffs on $30,000,000,000 worth of goods following Xi's talks with President Trump.
#US #china #TRUMP #xi
#US #china #TRUMP #xi
1
40
·
--
Bullish
‼️BREAKING:
🇨🇳 CHINA is reportedly considering easing its restrictions on cryptocurrencies by the end of 2026.
Imagine what could happen if MILLIONS of Chinese investors return to the crypto market during what could be the biggest bull run ever! 🚀
THIS COULD BE MASSIVE! 🔥
#china #ChinaCrypto #ChinaCryptoNews #restriction #massive
‼️BREAKING:
🇨🇳 CHINA is reportedly considering easing its restrictions on cryptocurrencies by the end of 2026.
Imagine what could happen if MILLIONS of Chinese investors return to the crypto market during what could be the biggest bull run ever! 🚀
THIS COULD BE MASSIVE! 🔥
#china #ChinaCrypto #ChinaCryptoNews #restriction #massive
🇨🇳 CHINA is reportedly considering easing its restrictions on cryptocurrencies by the end of 2026.
Imagine what could happen if MILLIONS of Chinese investors return to the crypto market during what could be the biggest bull run ever! 🚀
THIS COULD BE MASSIVE! 🔥
#china #ChinaCrypto #ChinaCryptoNews #restriction #massive
2
22
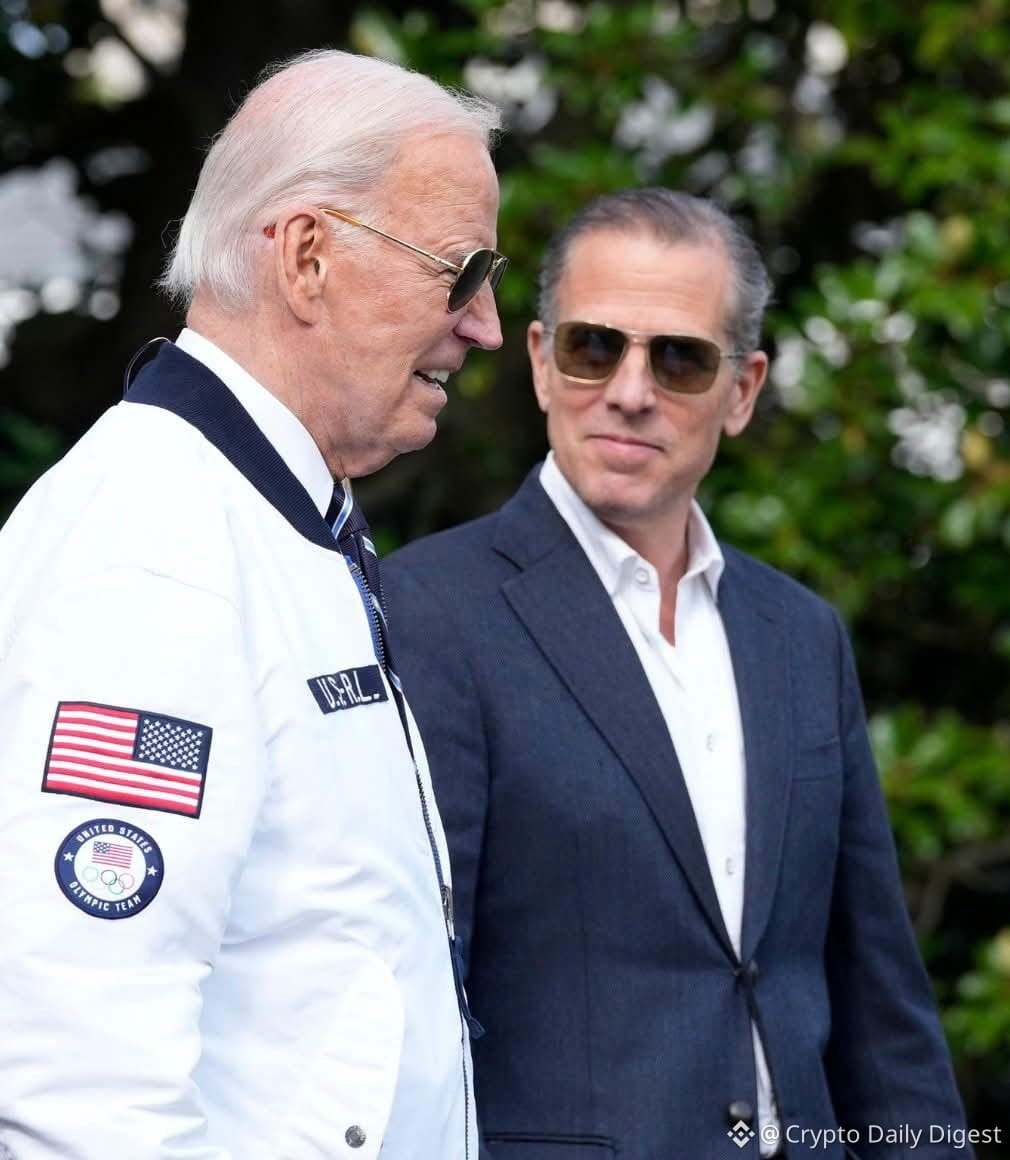
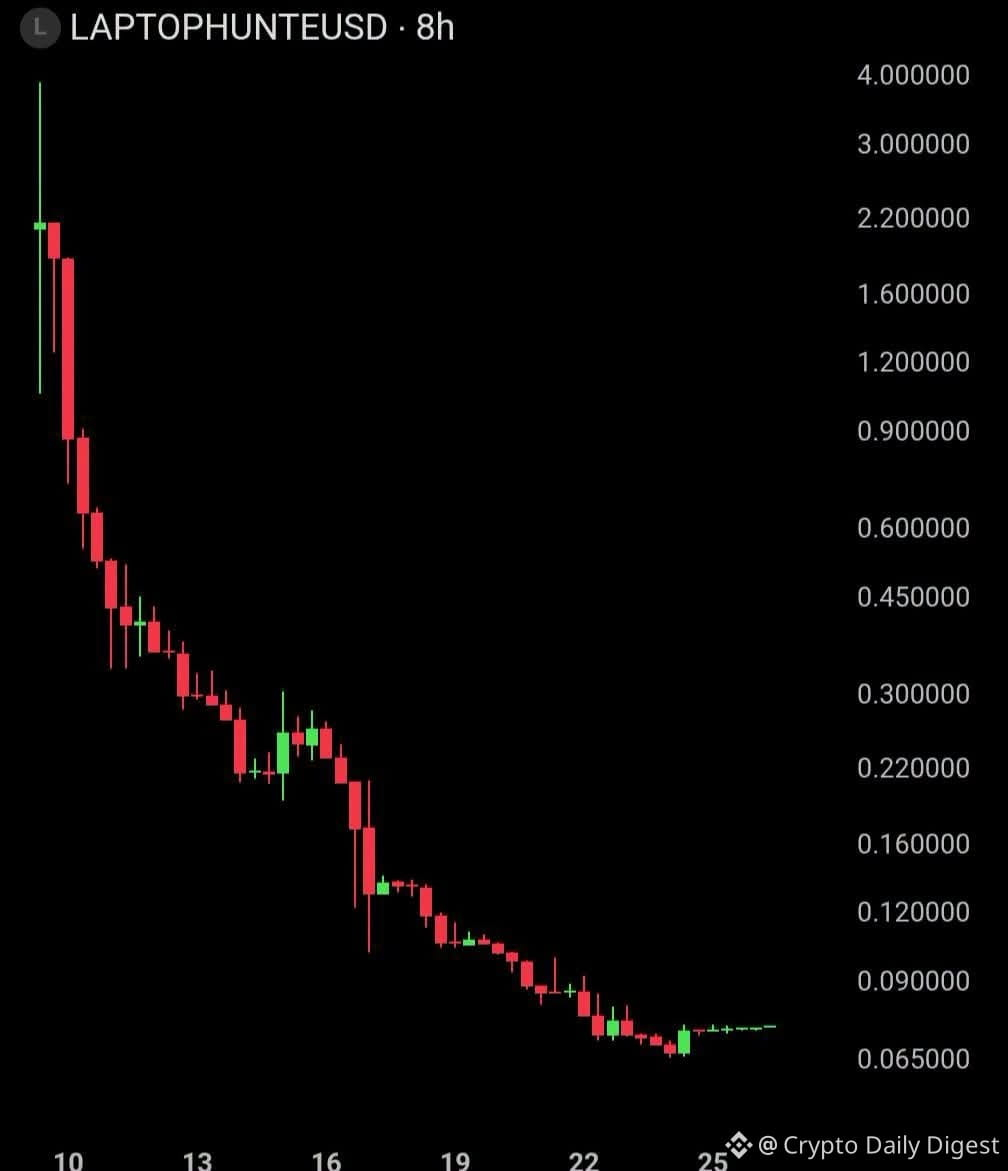
🚨 If you invested $10,000 in Hunter Biden's LAPTOP token 16 days ago, it would reportedly be worth $3 today.
That's a loss of over $9,997 in just over two weeks, wiping out nearly the entire investment.
The token, tied to Hunter Biden's laptop scandal, appears to have followed the familiar pattern seen with many meme coins riding a viral news cycle. An early spike in interest and price, followed by a rapid and brutal collapse as attention faded.
Anyone who bought in near the top has reportedly been left with next to nothing.
#LAPTOPcoin #biden #Scandal #Hunter
🚨 If you invested $10,000 in Hunter Biden's LAPTOP token 16 days ago, it would reportedly be worth $3 today.
That's a loss of over $9,997 in just over two weeks, wiping out nearly the entire investment.
The token, tied to Hunter Biden's laptop scandal, appears to have followed the familiar pattern seen with many meme coins riding a viral news cycle. An early spike in interest and price, followed by a rapid and brutal collapse as attention faded.
Anyone who bought in near the top has reportedly been left with next to nothing.
#LAPTOPcoin #biden #Scandal #Hunter
That's a loss of over $9,997 in just over two weeks, wiping out nearly the entire investment.
The token, tied to Hunter Biden's laptop scandal, appears to have followed the familiar pattern seen with many meme coins riding a viral news cycle. An early spike in interest and price, followed by a rapid and brutal collapse as attention faded.
Anyone who bought in near the top has reportedly been left with next to nothing.
#LAPTOPcoin #biden #Scandal #Hunter
101
Log in to explore more content
Join global crypto users on Binance Square
⚡️ Get latest and useful information about crypto.
💬 Trusted by the world’s largest crypto exchange.
👍 Discover real insights from verified creators.
Email / Phone number