$ETH $SOMI
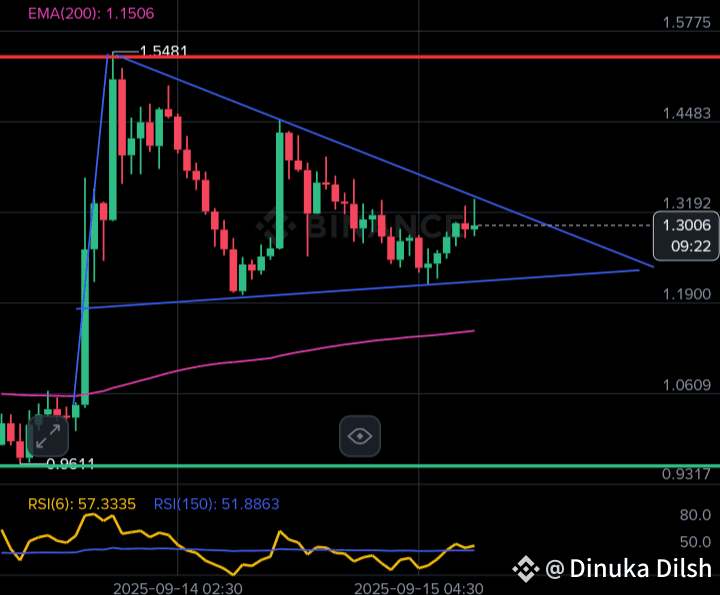
1. Symmetrical Triangle 🔺
Shape: Formed by a downward-sloping resistance line and an upward-sloping support line that meet.
Interpretation: This pattern shows indecision and balance ⚖️ between buyers and sellers in the market.
Breakout: The price can break out in either direction (up ⬆️ or down ⬇️). It's hard to predict the direction until the breakout happens. 🧐
2. Ascending Triangle 🔼
Shape: Has a horizontal resistance line and an upward-sloping support line.
Interpretation: This is a bullish pattern 💪 that signals a potential upward move. The higher lows show that buyers are gaining strength, even as the price repeatedly hits the same resistance level. 🚀✨
Breakout: The price has a high probability of breaking above the horizontal resistance line and moving higher. 🎯
3. Descending Triangle 🔽
Shape: Has a horizontal support line and a downward-sloping resistance line. 📉
Interpretation: This is a bearish pattern 🐻 that signals a potential downward move. The lower highs show that sellers are gaining strength, even as the price repeatedly hits the same support level. 🛑
Breakout: The price has a high probability of breaking below the horizontal support line and moving lower. 💥
Confirming a Breakout ✅
It's very important to correctly identify a "breakout" from a triangle pattern. Since false breakouts can occur, pay attention to these factors: 🕵️♂️
Volume: When a breakout happens, trading volume should increase significantly 📈💰. This confirms that the breakout is strong. 👍
Retest: Often, the price will return to the broken trendline, retesting it as a new support or resistance level before continuing its move. 🧐🔍 This is also a sign of a strong, confirmed breakout. 💪
This information should give you a better understanding of technical analysis. Remember that risk management is essential when trading. 🛡️😊