

Ethereum’s multi year triangle resembles BTC’s 2017–2020 setup, with a breakout likely if it clears $3,700 resistance.
Momentum indicators show a third bullish crossover, resembling Bitcoin’s pre-2021 rally pattern.
A move above $3,700 could target $6,000–$7,500, but drops below $2,700 or $1,400 would signal pattern invalidation.
Ethereum may be replicating Bitcoin’s 2020 movement, based on its long term price behavior and momentum indicators. Ethereum's current macro structure is strikingly similar to the pattern Bitcoin followed before its 2021 rally.
On a 3-week candle timeframe, Ethereum has formed a multi year consolidation triangle that resembles Bitcoin’s setup between 2017 and 2020. Bitcoin remained range bound during that period, repeatedly testing key levels before breaking out near $12,000. That breakout led to a 435% surge toward $64,000. Ethereum is now approaching a similar inflection point.
Ethereum’s Multi Year Triangle Nears Breakout Point
At press time, Ethereum was trading at $3,457 and is approaching the triangle’s upper resistance near $3,700. The structure is from roughly 2021 to 2025, bounded by resistance above and support near $1,400.
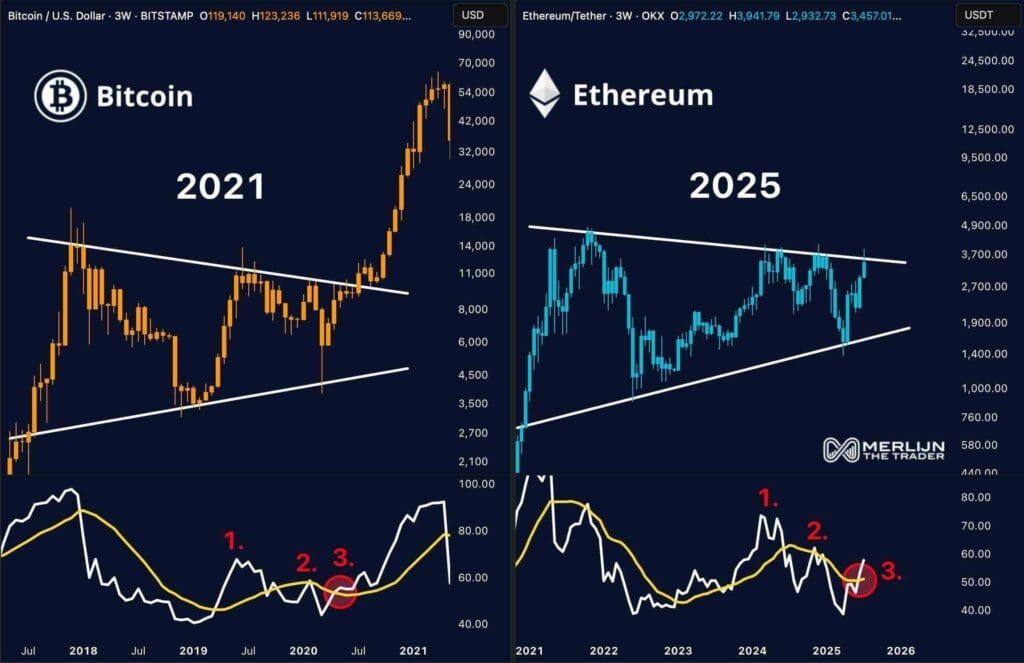 BTC and ETH 3-week price outlook, Source: Merlijn The Trader
Like Bitcoin’s earlier pattern, Ethereum tapped the lower support several times before gradually recovering toward resistance. This setup shows structural symmetry with Bitcoin’s pre-rally triangle, including the same multi year duration and positioning within a large consolidation zone.
Momentum Pattern Resembles Bitcoin’s Pre Rally Phase
Momentum indicators also strengthen the comparison. Both charts display three dips, starting with a drop below the signal line, followed by a failed bullish crossover, and finally a successful one.
For Bitcoin, the third crossover in 2020 occurred just before the price surged. Ethereum’s momentum lines are forming a similar third crossover. A red circle marks this crossover in both periods, supporting the similarity in technical behavior.
Resistance and Support Levels Set the Next Move
If Ethereum clears the $3,700 resistance with volume, the breakout could initiate a large upward move. The potential upside ranges between $6,000 and $7,500 based on prior fractal comparisons.
However, the analyst emphasizes that the lower support near $1,400 is key for invalidation. Additionally, any drop below $2,700 would warrant caution, as it is below key breakout levels. As Ethereum’s pattern aligns with past market cycles, technical confirmation will depend on how price and momentum change in coming sessions.
The post Ethereum Is Copying Bitcoin’s 2021 Playbook, Says Analyst—Breakout May Be Close appears on Crypto Front News. Visit our website to read more interesting articles about cryptocurrency, blockchain technology, and digital assets.

