
Taro_NFT
196 Beiträge

Taro_NFT
Melden
Nutzer blockieren
Regelmäßiger Trader
4.2 Jahre
78 Following
25 Follower
112 Like gegeben
Beiträge
Alle
Zitierungen
·
--
Übersetzung ansehen
Bitcoin Weekly Analysis: BTC Faces a Critical Resistance Zone — Is a Major Breakout Coming?Market Overview
Bitcoin (BTC) is currently trading around $69,049 in the chart snapshot, while the weekly timeframe shows an important battle between buyers and sellers.
The market is still facing a major descending resistance trendline from the 2025 high. This trendline could play a crucial role in determining Bitcoin's next major move.
The key question is: Will Bitcoin break above resistance and start a new bullish rally, or will sellers push the price toward lower support levels?
Let's examine the technical picture.
1. Major Resistance Zone: $77,500–$80,000
The $77,500–$80,000 region is an important resistance area.
Bitcoin has previously struggled around this zone, making it a critical level for bullish traders.
A strong weekly candle close above $80,000, supported by increasing trading volume, could indicate a potential breakout.
If this happens, the next upside targets to monitor could be:
- $90,000
- $100,000
- Above $100,000, depending on market momentum.
However, a simple move above resistance is not enough. Confirmation through a strong weekly close and a successful retest would make the breakout more convincing.
2. Important Support Zone: $60,000–$62,000
On the downside, $60,000–$62,000 is an important support area to watch.
If Bitcoin experiences selling pressure and moves toward this region, buyers may attempt to defend the support.
A strong reaction from this zone could create an opportunity for a potential recovery.
However, if Bitcoin breaks below $60,000 with strong selling volume, the bearish outlook could become stronger.
Possible downside levels to monitor would be:
- $55,000
- $50,000
These are potential technical reference levels, not guaranteed price targets.
3. MACD and Volume Analysis
The MACD indicator in the chart suggests improving bullish momentum.
The histogram and moving-average lines should be monitored for confirmation of a stronger trend reversal.
Trading volume is equally important.
A breakout supported by rising volume would generally be more reliable than a breakout occurring with weak participation.
If volume decreases during an upward move, traders should remain cautious about a possible false breakout.
4. Bullish Scenario
Bitcoin could gain stronger bullish momentum if:
- BTC breaks above the descending resistance trendline.
- The weekly candle closes above $80,000.
- Trading volume increases during the breakout.
- The MACD confirms improving bullish momentum.
If these conditions align, Bitcoin could potentially move toward $90,000 and $100,000 or higher.
5. Bearish Scenario
The bearish scenario becomes more relevant if:
- Bitcoin fails to break the descending resistance.
- Sellers push the price below the $60,000–$62,000 support zone.
- Selling volume increases.
- MACD momentum turns bearish.
Under these conditions, Bitcoin could potentially revisit $55,000 or $50,000.
Final Thoughts
Bitcoin is approaching an important technical decision zone.
The $77,500–$80,000 resistance area and the $60,000–$62,000 support area are two key regions worth monitoring.
Rather than predicting the market based on emotions, traders should wait for confirmation from weekly candle closes, volume, and momentum indicators.
My strategy: Stay patient, monitor the resistance and support levels, and avoid entering trades without proper confirmation and risk management.
The next major move could depend on how Bitcoin reacts around these important technical levels.
What do you think?
Will BTC break above $80,000 and start a new bullish rally, or will the market experience another correction?
Share your analysis in the comments!
$BTC #BTC #CryptoAnalysis #TechnicalAnalysis #BinanceSquar #BTCUSD
Bitcoin Weekly Analysis: BTC Faces a Critical Resistance Zone — Is a Major Breakout Coming?
Market Overview
Bitcoin (BTC) is currently trading around $69,049 in the chart snapshot, while the weekly timeframe shows an important battle between buyers and sellers.
The market is still facing a major descending resistance trendline from the 2025 high. This trendline could play a crucial role in determining Bitcoin's next major move.
The key question is: Will Bitcoin break above resistance and start a new bullish rally, or will sellers push the price toward lower support levels?
Let's examine the technical picture.
1. Major Resistance Zone: $77,500–$80,000
The $77,500–$80,000 region is an important resistance area.
Bitcoin has previously struggled around this zone, making it a critical level for bullish traders.
A strong weekly candle close above $80,000, supported by increasing trading volume, could indicate a potential breakout.
If this happens, the next upside targets to monitor could be:
- $90,000
- $100,000
- Above $100,000, depending on market momentum.
However, a simple move above resistance is not enough. Confirmation through a strong weekly close and a successful retest would make the breakout more convincing.
2. Important Support Zone: $60,000–$62,000
On the downside, $60,000–$62,000 is an important support area to watch.
If Bitcoin experiences selling pressure and moves toward this region, buyers may attempt to defend the support.
A strong reaction from this zone could create an opportunity for a potential recovery.
However, if Bitcoin breaks below $60,000 with strong selling volume, the bearish outlook could become stronger.
Possible downside levels to monitor would be:
- $55,000
- $50,000
These are potential technical reference levels, not guaranteed price targets.
3. MACD and Volume Analysis
The MACD indicator in the chart suggests improving bullish momentum.
The histogram and moving-average lines should be monitored for confirmation of a stronger trend reversal.
Trading volume is equally important.
A breakout supported by rising volume would generally be more reliable than a breakout occurring with weak participation.
If volume decreases during an upward move, traders should remain cautious about a possible false breakout.
4. Bullish Scenario
Bitcoin could gain stronger bullish momentum if:
- BTC breaks above the descending resistance trendline.
- The weekly candle closes above $80,000.
- Trading volume increases during the breakout.
- The MACD confirms improving bullish momentum.
If these conditions align, Bitcoin could potentially move toward $90,000 and $100,000 or higher.
5. Bearish Scenario
The bearish scenario becomes more relevant if:
- Bitcoin fails to break the descending resistance.
- Sellers push the price below the $60,000–$62,000 support zone.
- Selling volume increases.
- MACD momentum turns bearish.
Under these conditions, Bitcoin could potentially revisit $55,000 or $50,000.
Final Thoughts
Bitcoin is approaching an important technical decision zone.
The $77,500–$80,000 resistance area and the $60,000–$62,000 support area are two key regions worth monitoring.
Rather than predicting the market based on emotions, traders should wait for confirmation from weekly candle closes, volume, and momentum indicators.
My strategy: Stay patient, monitor the resistance and support levels, and avoid entering trades without proper confirmation and risk management.
The next major move could depend on how Bitcoin reacts around these important technical levels.
What do you think?
Will BTC break above $80,000 and start a new bullish rally, or will the market experience another correction?
Share your analysis in the comments!
$BTC #BTC #CryptoAnalysis #TechnicalAnalysis #BinanceSquar #BTCUSD
Bitcoin (BTC) is currently trading around $69,049 in the chart snapshot, while the weekly timeframe shows an important battle between buyers and sellers.
The market is still facing a major descending resistance trendline from the 2025 high. This trendline could play a crucial role in determining Bitcoin's next major move.
The key question is: Will Bitcoin break above resistance and start a new bullish rally, or will sellers push the price toward lower support levels?
Let's examine the technical picture.
1. Major Resistance Zone: $77,500–$80,000
The $77,500–$80,000 region is an important resistance area.
Bitcoin has previously struggled around this zone, making it a critical level for bullish traders.
A strong weekly candle close above $80,000, supported by increasing trading volume, could indicate a potential breakout.
If this happens, the next upside targets to monitor could be:
- $90,000
- $100,000
- Above $100,000, depending on market momentum.
However, a simple move above resistance is not enough. Confirmation through a strong weekly close and a successful retest would make the breakout more convincing.
2. Important Support Zone: $60,000–$62,000
On the downside, $60,000–$62,000 is an important support area to watch.
If Bitcoin experiences selling pressure and moves toward this region, buyers may attempt to defend the support.
A strong reaction from this zone could create an opportunity for a potential recovery.
However, if Bitcoin breaks below $60,000 with strong selling volume, the bearish outlook could become stronger.
Possible downside levels to monitor would be:
- $55,000
- $50,000
These are potential technical reference levels, not guaranteed price targets.
3. MACD and Volume Analysis
The MACD indicator in the chart suggests improving bullish momentum.
The histogram and moving-average lines should be monitored for confirmation of a stronger trend reversal.
Trading volume is equally important.
A breakout supported by rising volume would generally be more reliable than a breakout occurring with weak participation.
If volume decreases during an upward move, traders should remain cautious about a possible false breakout.
4. Bullish Scenario
Bitcoin could gain stronger bullish momentum if:
- BTC breaks above the descending resistance trendline.
- The weekly candle closes above $80,000.
- Trading volume increases during the breakout.
- The MACD confirms improving bullish momentum.
If these conditions align, Bitcoin could potentially move toward $90,000 and $100,000 or higher.
5. Bearish Scenario
The bearish scenario becomes more relevant if:
- Bitcoin fails to break the descending resistance.
- Sellers push the price below the $60,000–$62,000 support zone.
- Selling volume increases.
- MACD momentum turns bearish.
Under these conditions, Bitcoin could potentially revisit $55,000 or $50,000.
Final Thoughts
Bitcoin is approaching an important technical decision zone.
The $77,500–$80,000 resistance area and the $60,000–$62,000 support area are two key regions worth monitoring.
Rather than predicting the market based on emotions, traders should wait for confirmation from weekly candle closes, volume, and momentum indicators.
My strategy: Stay patient, monitor the resistance and support levels, and avoid entering trades without proper confirmation and risk management.
The next major move could depend on how Bitcoin reacts around these important technical levels.
What do you think?
Will BTC break above $80,000 and start a new bullish rally, or will the market experience another correction?
Share your analysis in the comments!
$BTC #BTC #CryptoAnalysis #TechnicalAnalysis #BinanceSquar #BTCUSD
1
105
·
--
DAS ROTMARKT-SYNDROM 🔴💀🔴 WENN DER KRYPTOMARKT ROT WIRD, SEHEN SELBST DEINE AUGEN ROT!
📉 Bitcoin und Ethereum stehen unter starkem Marktdruck und erinnern alle Trader daran, dass Volatilität zur Krypto-Reise dazugehört.
💡 In der Kryptowelt sind Geduld eine Strategie, Risikomanagement eine Notwendigkeit und Emotionen dein größter Feind.
Denk daran:
- Verkaufe nicht panisch.
- Handle nicht emotional.
- Schütze dein Kapital.
- Recherchiere immer selbst.
Der Markt kann ins Rote drehen, aber deine Strategie sollte klar bleiben. 🔥
DAS ROTMARKT-SYNDROM 🔴💀
🔴 WENN DER KRYPTOMARKT ROT WIRD, SEHEN SELBST DEINE AUGEN ROT!
📉 Bitcoin und Ethereum stehen unter starkem Marktdruck und erinnern alle Trader daran, dass Volatilität zur Krypto-Reise dazugehört.
💡 In der Kryptowelt sind Geduld eine Strategie, Risikomanagement eine Notwendigkeit und Emotionen dein größter Feind.
Denk daran:
- Verkaufe nicht panisch.
- Handle nicht emotional.
- Schütze dein Kapital.
- Recherchiere immer selbst.
Der Markt kann ins Rote drehen, aber deine Strategie sollte klar bleiben. 🔥
📉 Bitcoin und Ethereum stehen unter starkem Marktdruck und erinnern alle Trader daran, dass Volatilität zur Krypto-Reise dazugehört.
💡 In der Kryptowelt sind Geduld eine Strategie, Risikomanagement eine Notwendigkeit und Emotionen dein größter Feind.
Denk daran:
- Verkaufe nicht panisch.
- Handle nicht emotional.
- Schütze dein Kapital.
- Recherchiere immer selbst.
Der Markt kann ins Rote drehen, aber deine Strategie sollte klar bleiben. 🔥
137
·
--
Bullisch
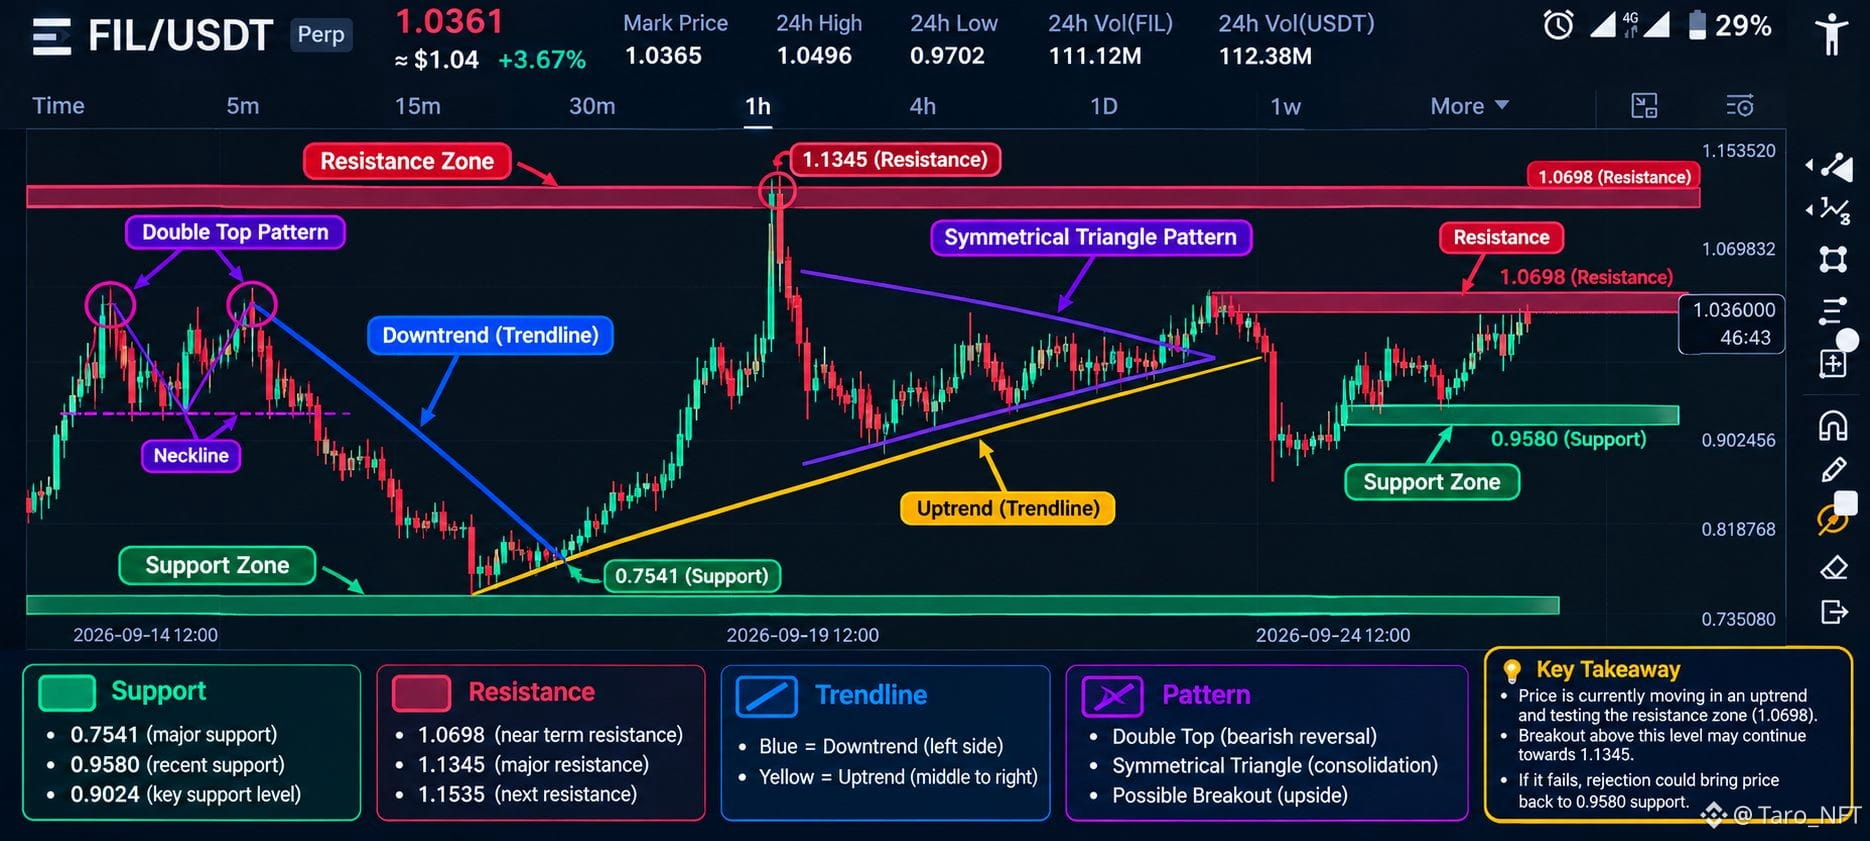
$FIL LONG Einrichtung
Eintrag 1: 1.020–1.030 — Pullback
Eintrag 2: 0.985–1.000 — tieferes Retracement
Breakout-Einstieg: 1.070–1.075 — 1H-Kerze 1.0698-Schlusskurs
SL: 0.958
TP1: 1.070
TP2: 1.100
TP3: 1.1345
{future}(FILUSDT)
$BTC
{future}(BTCUSDT)
$SOL
{future}(SOLUSDT)
$FIL LONG Einrichtung
Eintrag 1: 1.020–1.030 — Pullback
Eintrag 2: 0.985–1.000 — tieferes Retracement
Breakout-Einstieg: 1.070–1.075 — 1H-Kerze 1.0698-Schlusskurs
SL: 0.958
TP1: 1.070
TP2: 1.100
TP3: 1.1345
$BTC
$SOL
Eintrag 1: 1.020–1.030 — Pullback
Eintrag 2: 0.985–1.000 — tieferes Retracement
Breakout-Einstieg: 1.070–1.075 — 1H-Kerze 1.0698-Schlusskurs
SL: 0.958
TP1: 1.070
TP2: 1.100
TP3: 1.1345
$BTC
$SOL
1
515
·
--

Artikel
Filecoin (FIL): Könnte das Solstice-Upgrade den Weg zu einem neuen Kursimpuls ebnen?$FIL Filecoin (FIL): Könnte das Solstice-Upgrade den Weg zu einem neuen Kursimpuls ebnen?
Filecoin (FIL) ist mehr als nur eine Kryptowährung. Es handelt sich um ein dezentrales Speichernetzwerk, das eine verteilte und überprüfbare Infrastruktur für die Speicherung digitaler Daten bereitstellen soll. Mit dem bevorstehenden NV29-Upgrade „Solstice“ hat die Aufmerksamkeit rund um das Filecoin-Ökosystem zugenommen, insbesondere in Bezug auf sein zukünftiges Wirtschaftsmodell und potenzielle Netzwerk-Nutzung.
Da FIL bei etwa 1,03 US-Dollar gehandelt wird, lautet die zentrale Frage für Trader, ob das Solstice-Upgrade zum Auslöser einer neuen bullischen Bewegung werden könnte.
Filecoin (FIL): Könnte das Solstice-Upgrade den Weg zu einem neuen Kursimpuls ebnen?
$FIL Filecoin (FIL): Könnte das Solstice-Upgrade den Weg zu einem neuen Kursimpuls ebnen?
Filecoin (FIL) ist mehr als nur eine Kryptowährung. Es handelt sich um ein dezentrales Speichernetzwerk, das eine verteilte und überprüfbare Infrastruktur für die Speicherung digitaler Daten bereitstellen soll. Mit dem bevorstehenden NV29-Upgrade „Solstice“ hat die Aufmerksamkeit rund um das Filecoin-Ökosystem zugenommen, insbesondere in Bezug auf sein zukünftiges Wirtschaftsmodell und potenzielle Netzwerk-Nutzung.
Da FIL bei etwa 1,03 US-Dollar gehandelt wird, lautet die zentrale Frage für Trader, ob das Solstice-Upgrade zum Auslöser einer neuen bullischen Bewegung werden könnte.
Filecoin (FIL) ist mehr als nur eine Kryptowährung. Es handelt sich um ein dezentrales Speichernetzwerk, das eine verteilte und überprüfbare Infrastruktur für die Speicherung digitaler Daten bereitstellen soll. Mit dem bevorstehenden NV29-Upgrade „Solstice“ hat die Aufmerksamkeit rund um das Filecoin-Ökosystem zugenommen, insbesondere in Bezug auf sein zukünftiges Wirtschaftsmodell und potenzielle Netzwerk-Nutzung.
Da FIL bei etwa 1,03 US-Dollar gehandelt wird, lautet die zentrale Frage für Trader, ob das Solstice-Upgrade zum Auslöser einer neuen bullischen Bewegung werden könnte.
450
·
--
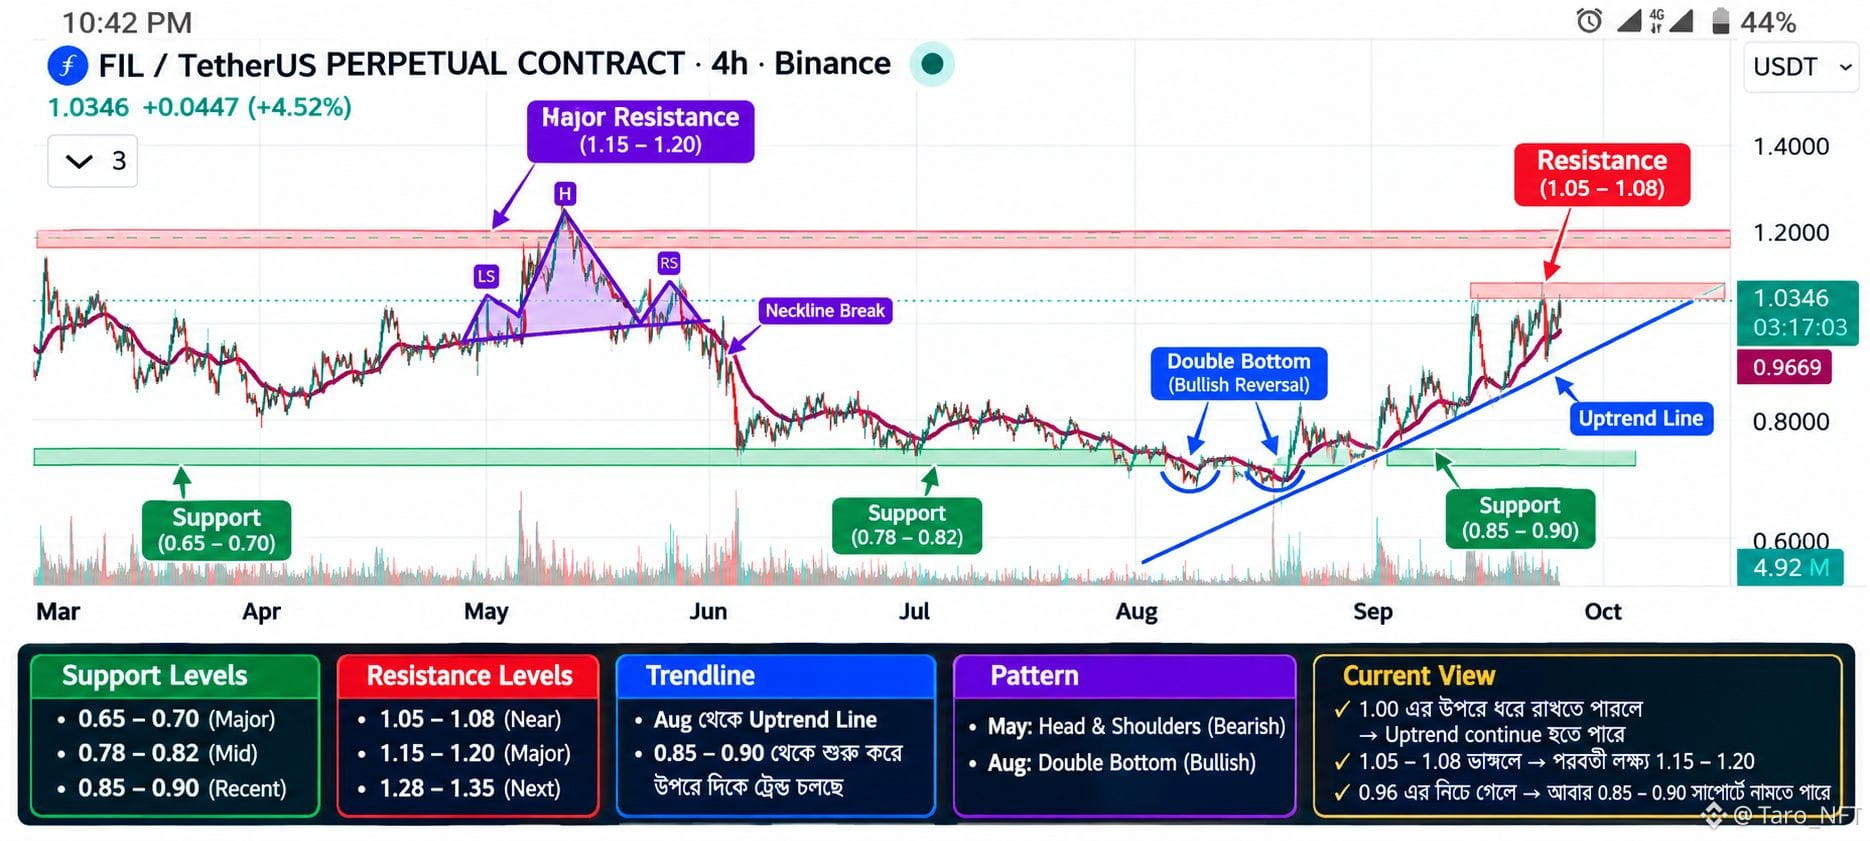
$FIL LANGES SETUP JETZT 10x ~ 20x
Einstieg 1.3
SL: 0.99–1.01
TP1: 1.15
TP2: 1.20
TP3: 1.28–1.30
{future}(FILUSDT)
$
$FIL LANGES SETUP JETZT 10x ~ 20x
Einstieg 1.3
SL: 0.99–1.01
TP1: 1.15
TP2: 1.20
TP3: 1.28–1.30
$
Einstieg 1.3
SL: 0.99–1.01
TP1: 1.15
TP2: 1.20
TP3: 1.28–1.30
$
4
4
455
·
--
Bullisch
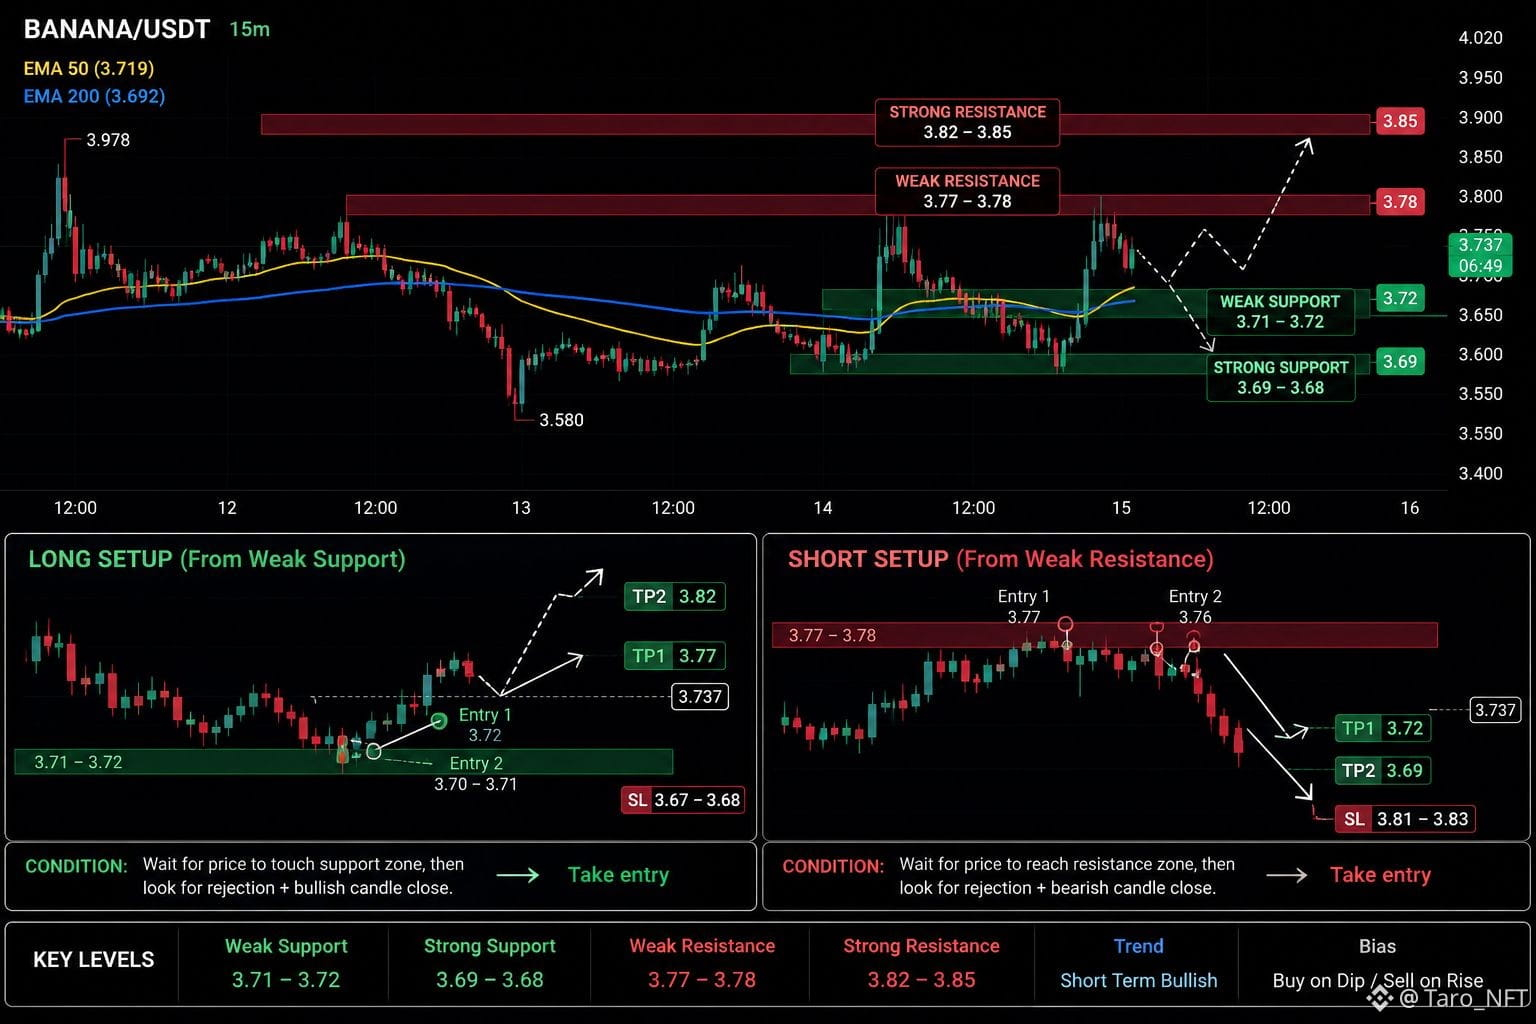
$BANANA
⭐ praktische Einrichtung
Long: 3.71–3.72 Ablehnung → 3.77 → 3.82
Short: 3.77–3.78 Ablehnung → 3.72 → 3.69
$BANANA
⭐ praktische Einrichtung
Long: 3.71–3.72 Ablehnung → 3.77 → 3.82
Short: 3.77–3.78 Ablehnung → 3.72 → 3.69
⭐ praktische Einrichtung
Long: 3.71–3.72 Ablehnung → 3.77 → 3.82
Short: 3.77–3.78 Ablehnung → 3.72 → 3.69
1
2
139
·
--
Bullisch
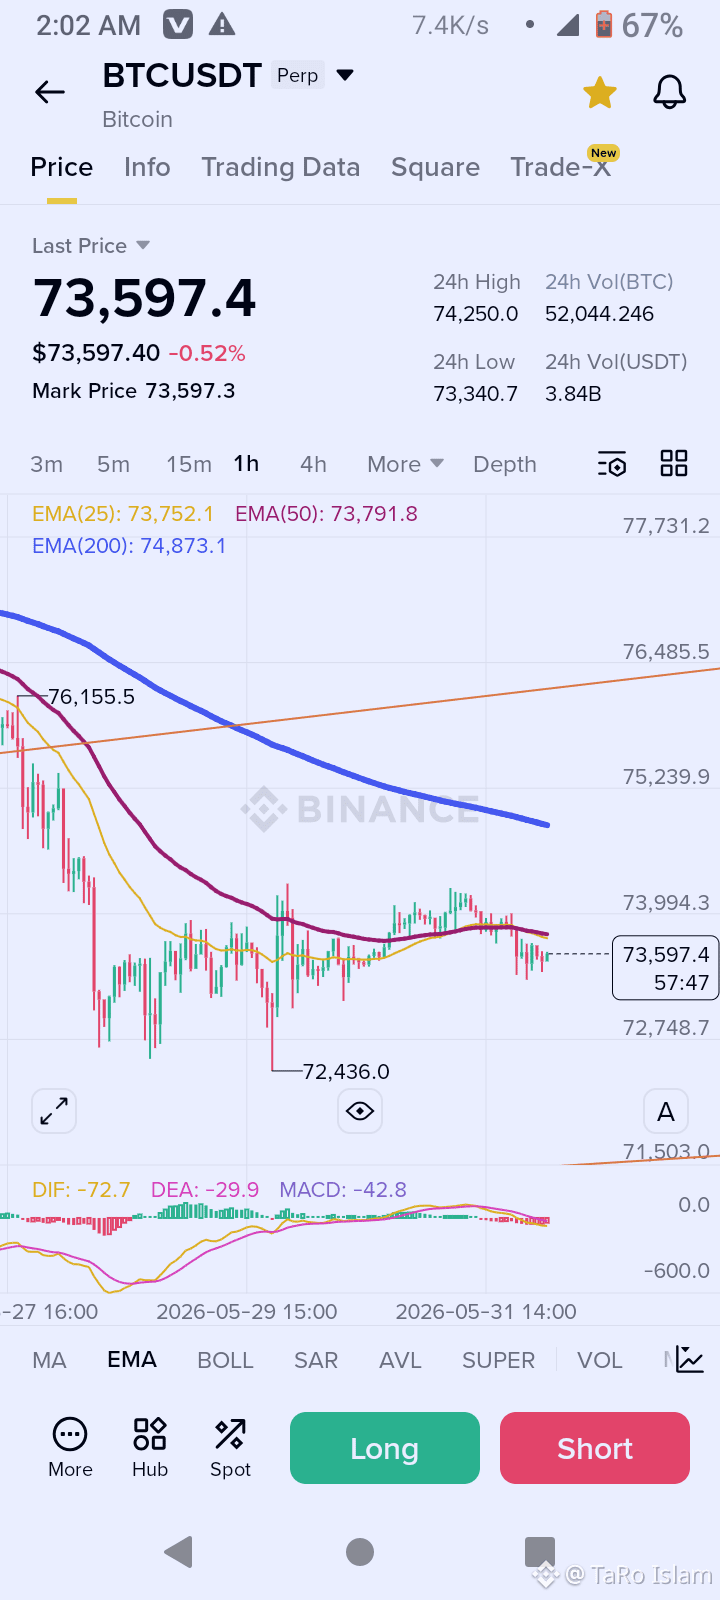
$BTC Long Setup 20x 50x 100x 150x
"Nutze nur 1-5% Margin pro Trade. Halte 95-99% Kapital als Backup. Schütze zuerst das Kapital, der Gewinn kommt später." 🚀
Einstieg: 73.950 1H Kerzenschluss
SL: 73.500
TP1: 74.300
TP2: 74.800
{future}(BTCUSDT)
$ETH
{future}(ETHUSDT)
$SOL
{future}(SOLUSDT)
#Cardano2026SummitCanceled #BNBBreaks740USDTUp12Percent #NomuraLaserOCCTrustApproval #StablecoinsMayExtendUSMonetaryInfluence #USSeizesIranianCrypto
$BTC Long Setup 20x 50x 100x 150x
"Nutze nur 1-5% Margin pro Trade. Halte 95-99% Kapital als Backup. Schütze zuerst das Kapital, der Gewinn kommt später." 🚀
Einstieg: 73.950 1H Kerzenschluss
SL: 73.500
TP1: 74.300
TP2: 74.800
$ETH
$SOL
#Cardano2026SummitCanceled #BNBBreaks740USDTUp12Percent #NomuraLaserOCCTrustApproval #StablecoinsMayExtendUSMonetaryInfluence #USSeizesIranianCrypto
"Nutze nur 1-5% Margin pro Trade. Halte 95-99% Kapital als Backup. Schütze zuerst das Kapital, der Gewinn kommt später." 🚀
Einstieg: 73.950 1H Kerzenschluss
SL: 73.500
TP1: 74.300
TP2: 74.800
$ETH
$SOL
#Cardano2026SummitCanceled #BNBBreaks740USDTUp12Percent #NomuraLaserOCCTrustApproval #StablecoinsMayExtendUSMonetaryInfluence #USSeizesIranianCrypto
66
·
--

Artikel
"Wenn alle in Panik geraten, beobachtet das smarte Geld die Unterstützungsniveaus.""Wenn alle in Panik geraten, beobachtet das smarte Geld die Unterstützungsniveaus."
$BTC
$ETH
$SOL
#BNBBreaks740USDTUp12Percent #StablecoinsMayExtendUSMonetaryInfluence #USSeizesIranianCrypto #SECChargesPrivvyFounderCryptoFraud #NomuraLaserDigitalOCCApproval
"Wenn alle in Panik geraten, beobachtet das smarte Geld die Unterstützungsniveaus."
"Wenn alle in Panik geraten, beobachtet das smarte Geld die Unterstützungsniveaus."
$BTC
$ETH
$SOL
#BNBBreaks740USDTUp12Percent #StablecoinsMayExtendUSMonetaryInfluence #USSeizesIranianCrypto #SECChargesPrivvyFounderCryptoFraud #NomuraLaserDigitalOCCApproval
$BTC
$ETH
$SOL
#BNBBreaks740USDTUp12Percent #StablecoinsMayExtendUSMonetaryInfluence #USSeizesIranianCrypto #SECChargesPrivvyFounderCryptoFraud #NomuraLaserDigitalOCCApproval
199
·
--
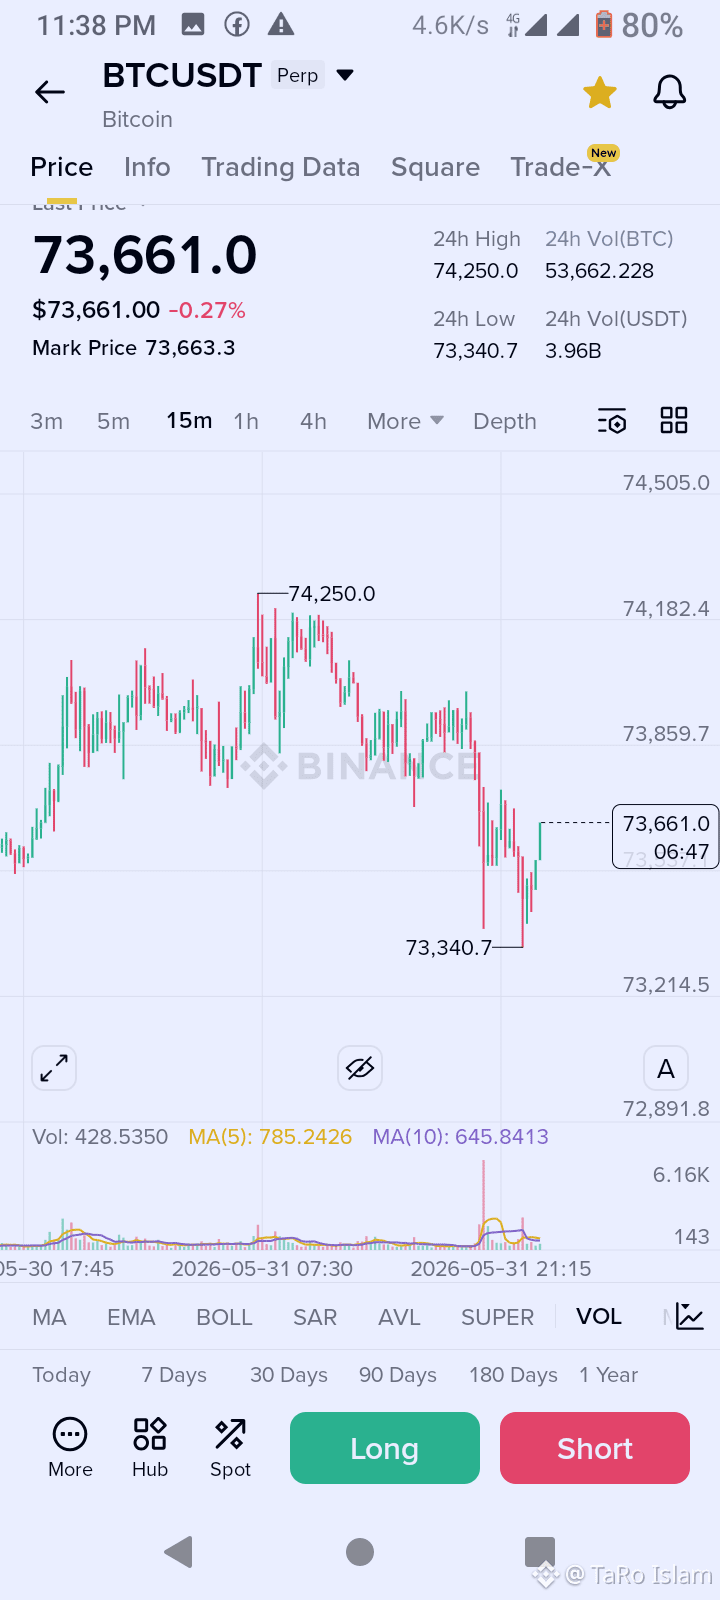
$BTC Long Setup
Entry: 73.700 - 15m velas Schluss ↑
SL: 73.450
TP1: 73.900
TP2: 74.100
TP3: 74.250
{future}(BTCUSDT)
$ETH
{future}(ETHUSDT)
$XRP
{future}(XRPUSDT)
$BTC Long Setup
Entry: 73.700 - 15m velas Schluss ↑
SL: 73.450
TP1: 73.900
TP2: 74.100
TP3: 74.250
$ETH
$XRP
Entry: 73.700 - 15m velas Schluss ↑
SL: 73.450
TP1: 73.900
TP2: 74.100
TP3: 74.250
$ETH
$XRP
1
153
·
--
Bullisch
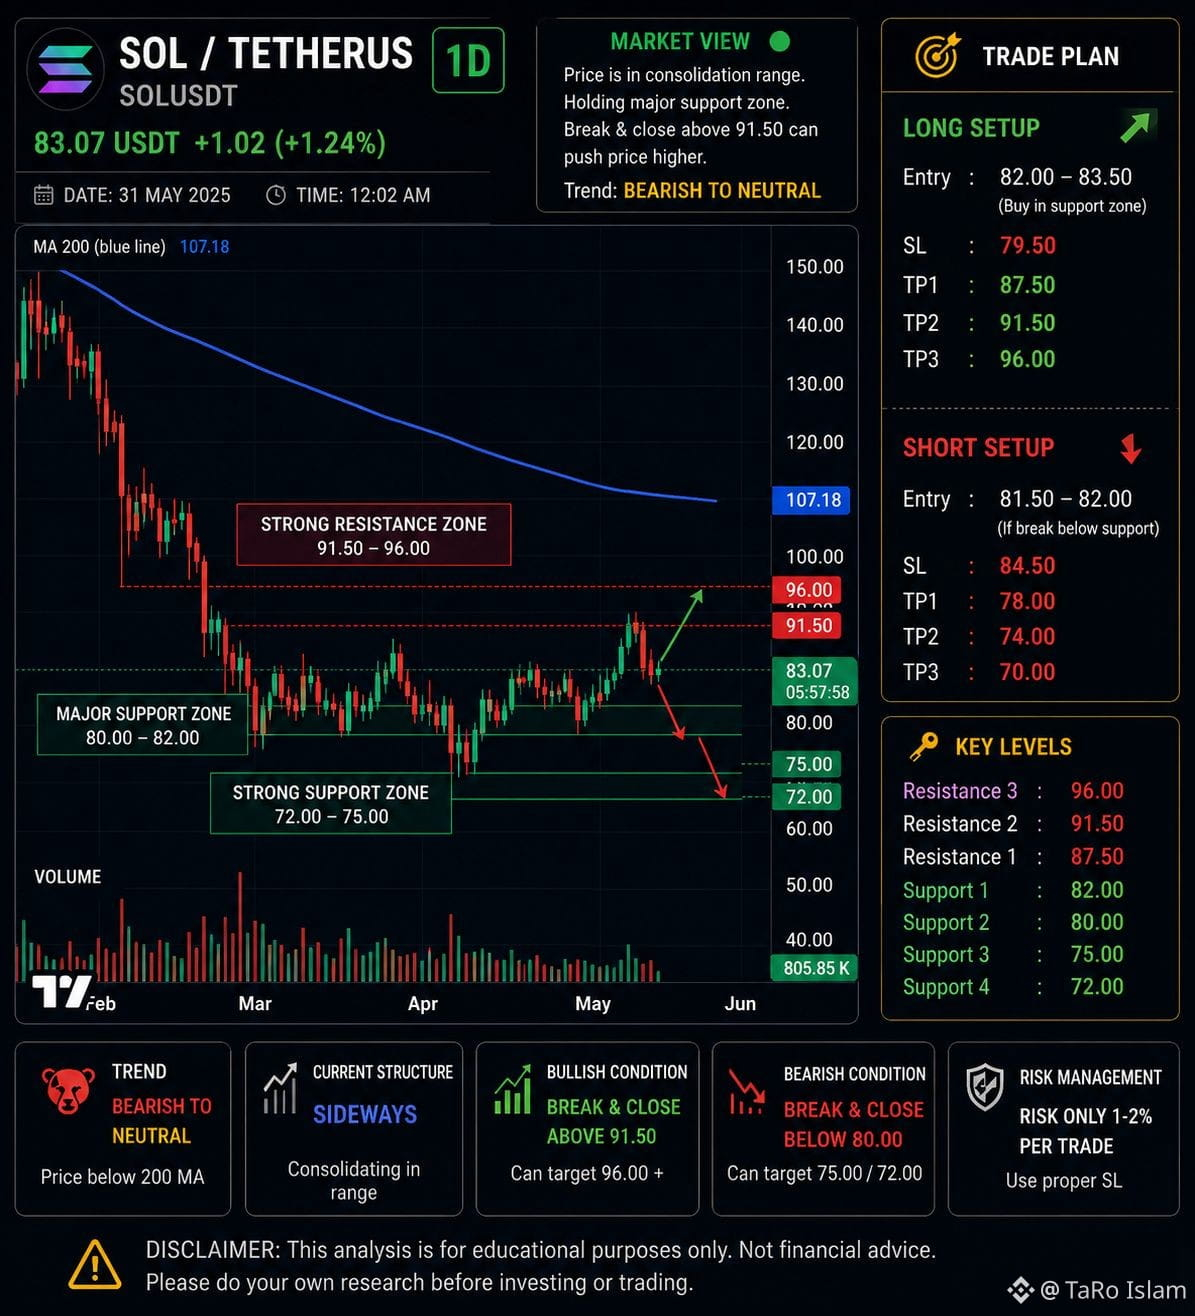
#SOLUSDT 🔥 20X 50x 100x
"Verwende nur 1-5% Margin pro Trade. Halte 95-99% Kapital als Backup. Schütze zuerst das Kapital, der Profit kommt später." 🚀
Zeit ist das Wichtigste⏳
Beste Long Zone: 82–83.5
SL: 79.5
TP1: 87.5
TP2: 91.5
TP3: 96.0
TP4: (hoch)🚀
Sniper Setup:
80–82 Unterstützungszone Sweep Long
91.5
#highlight #everyone #solana
$SOL
{future}(SOLUSDT)
$BTC
{future}(BTCUSDT)
$ETH
{future}(ETHUSDT)
#SOLUSDT 🔥 20X 50x 100x
"Verwende nur 1-5% Margin pro Trade. Halte 95-99% Kapital als Backup. Schütze zuerst das Kapital, der Profit kommt später." 🚀
Zeit ist das Wichtigste⏳
Beste Long Zone: 82–83.5
SL: 79.5
TP1: 87.5
TP2: 91.5
TP3: 96.0
TP4: (hoch)🚀
Sniper Setup:
80–82 Unterstützungszone Sweep Long
91.5
#highlight #everyone #solana
$SOL
$BTC
$ETH
"Verwende nur 1-5% Margin pro Trade. Halte 95-99% Kapital als Backup. Schütze zuerst das Kapital, der Profit kommt später." 🚀
Zeit ist das Wichtigste⏳
Beste Long Zone: 82–83.5
SL: 79.5
TP1: 87.5
TP2: 91.5
TP3: 96.0
TP4: (hoch)🚀
Sniper Setup:
80–82 Unterstützungszone Sweep Long
91.5
#highlight #everyone #solana
$SOL
$BTC
$ETH
1
87
·
--
Bullisch
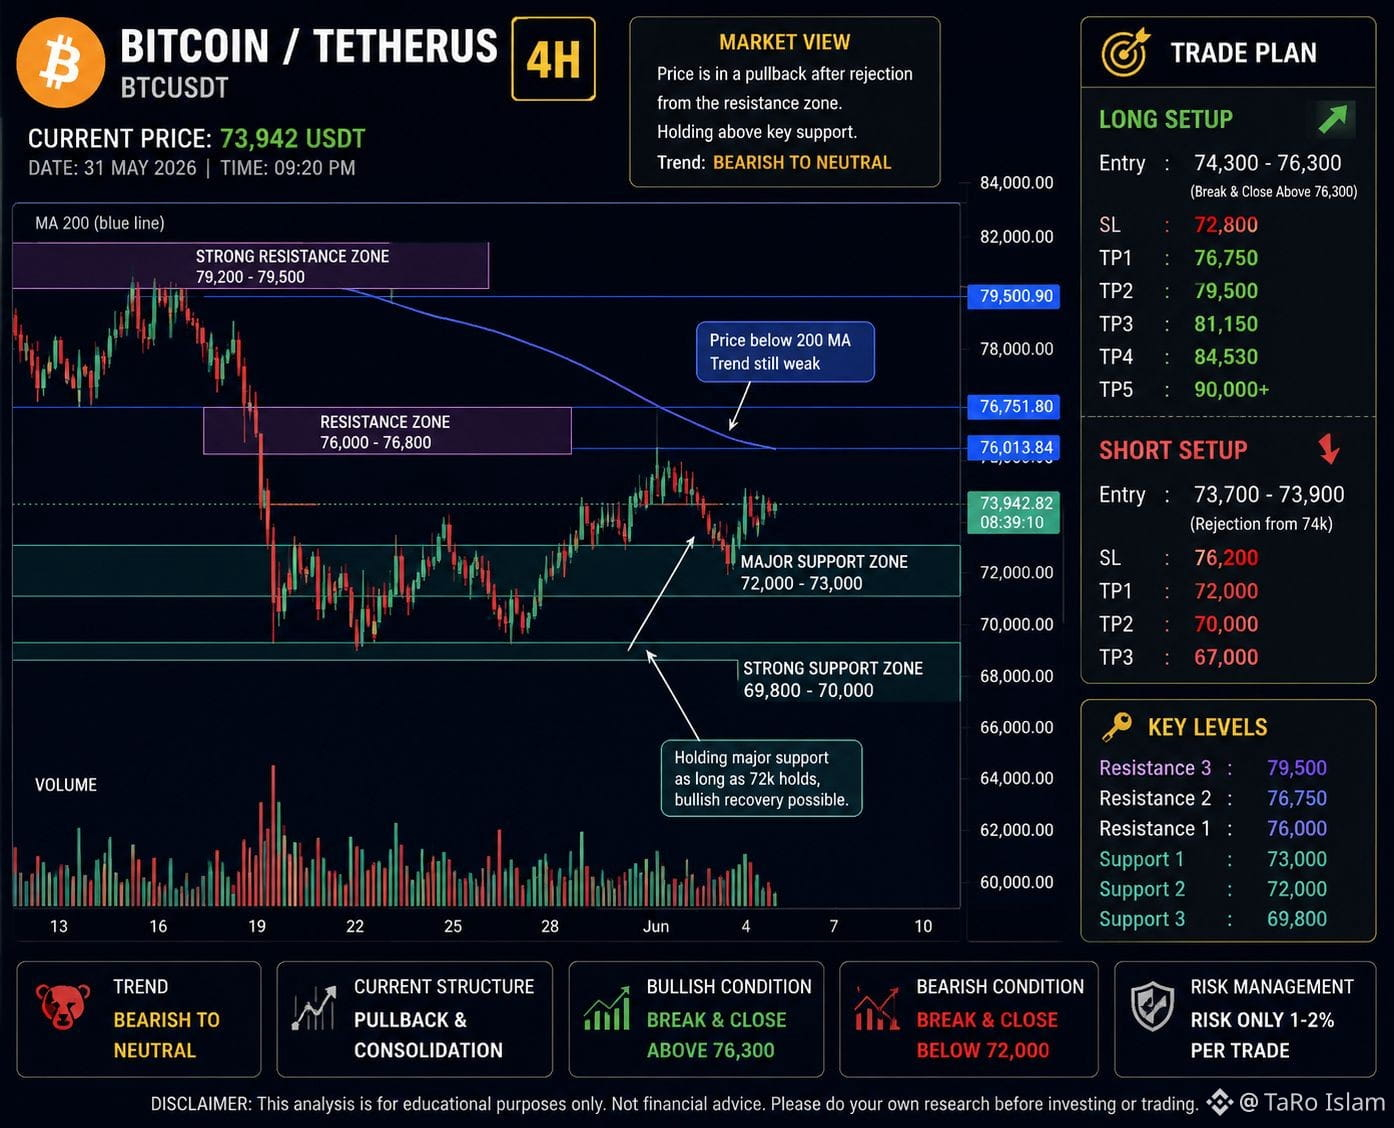
$BTC Long Setup 20x 50x 100x 📈
Einstieg: 73,820 – 73,900/
"Verwende nur 1-5% Margin pro Trade. Halte 95-99% Kapital als Backup. Schütze zuerst das Kapital, der Gewinn kommt später." 🚀
Zeit ist das Wichtigste⏳
Stop-Loss: 73,680
TP1: 74,050
TP2: 74,180
TP3: 74,290 (hoch)🚀
{future}(BTCUSDT)
$ETH
{future}(ETHUSDT)
$SOL
{future}(SOLUSDT)
#nextmove
$BTC Long Setup 20x 50x 100x 📈
Einstieg: 73,820 – 73,900/
"Verwende nur 1-5% Margin pro Trade. Halte 95-99% Kapital als Backup. Schütze zuerst das Kapital, der Gewinn kommt später." 🚀
Zeit ist das Wichtigste⏳
Stop-Loss: 73,680
TP1: 74,050
TP2: 74,180
TP3: 74,290 (hoch)🚀
$ETH
$SOL
#nextmove
Einstieg: 73,820 – 73,900/
"Verwende nur 1-5% Margin pro Trade. Halte 95-99% Kapital als Backup. Schütze zuerst das Kapital, der Gewinn kommt später." 🚀
Zeit ist das Wichtigste⏳
Stop-Loss: 73,680
TP1: 74,050
TP2: 74,180
TP3: 74,290 (hoch)🚀
$ETH
$SOL
#nextmove
1
108
·
--
Bullisch
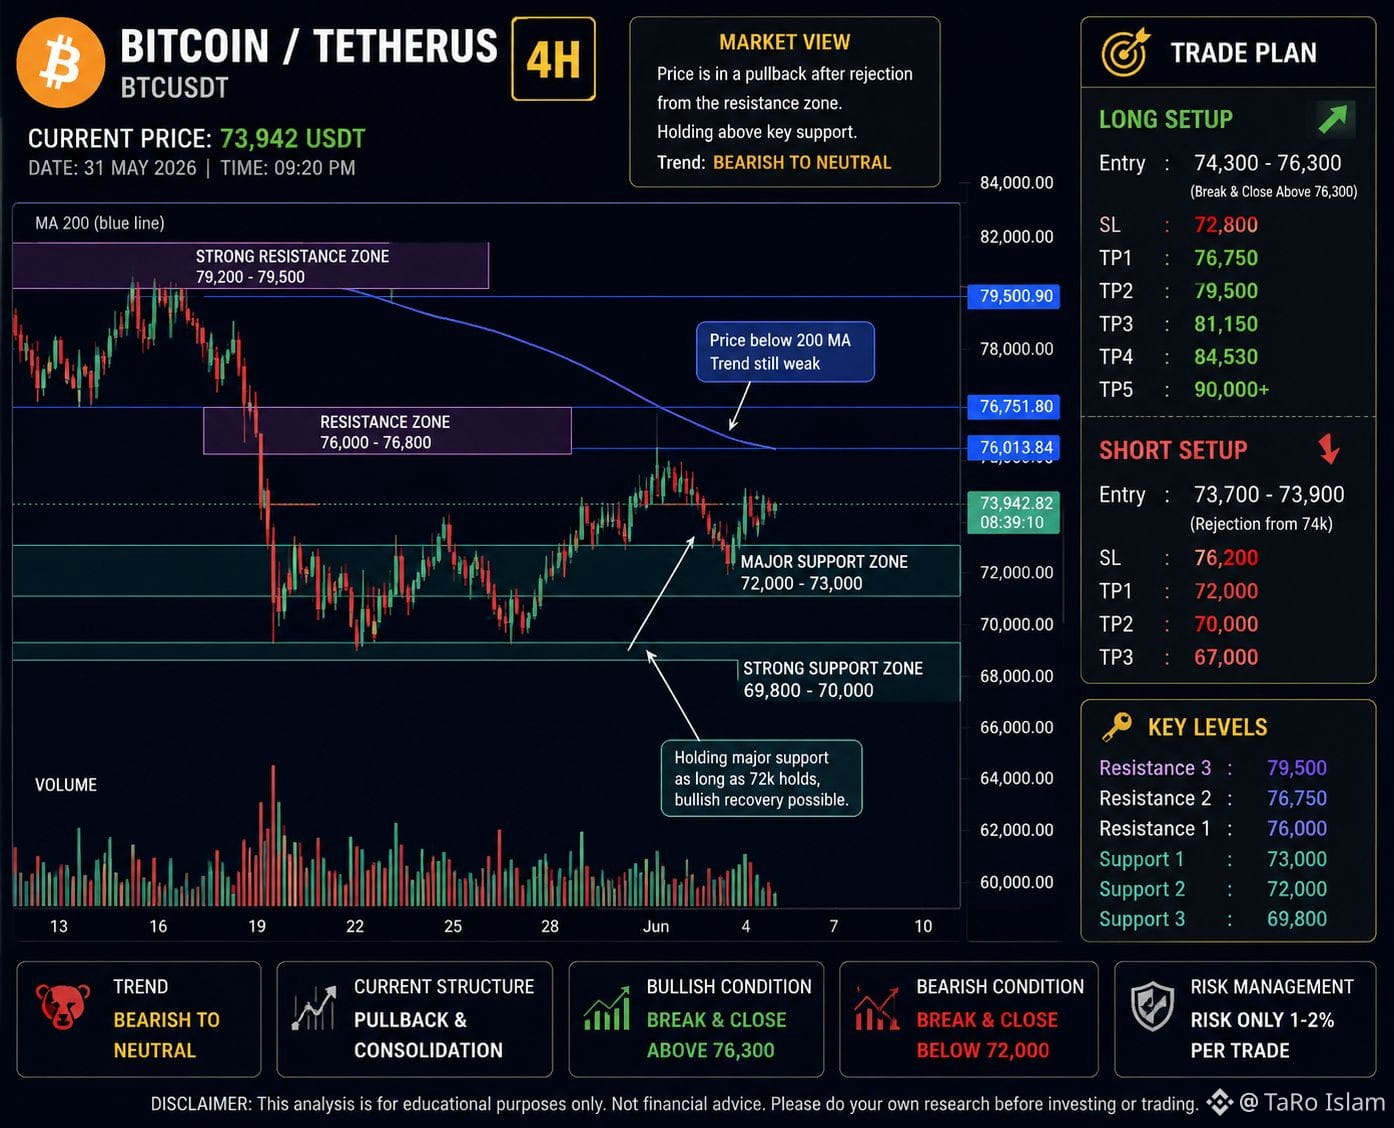
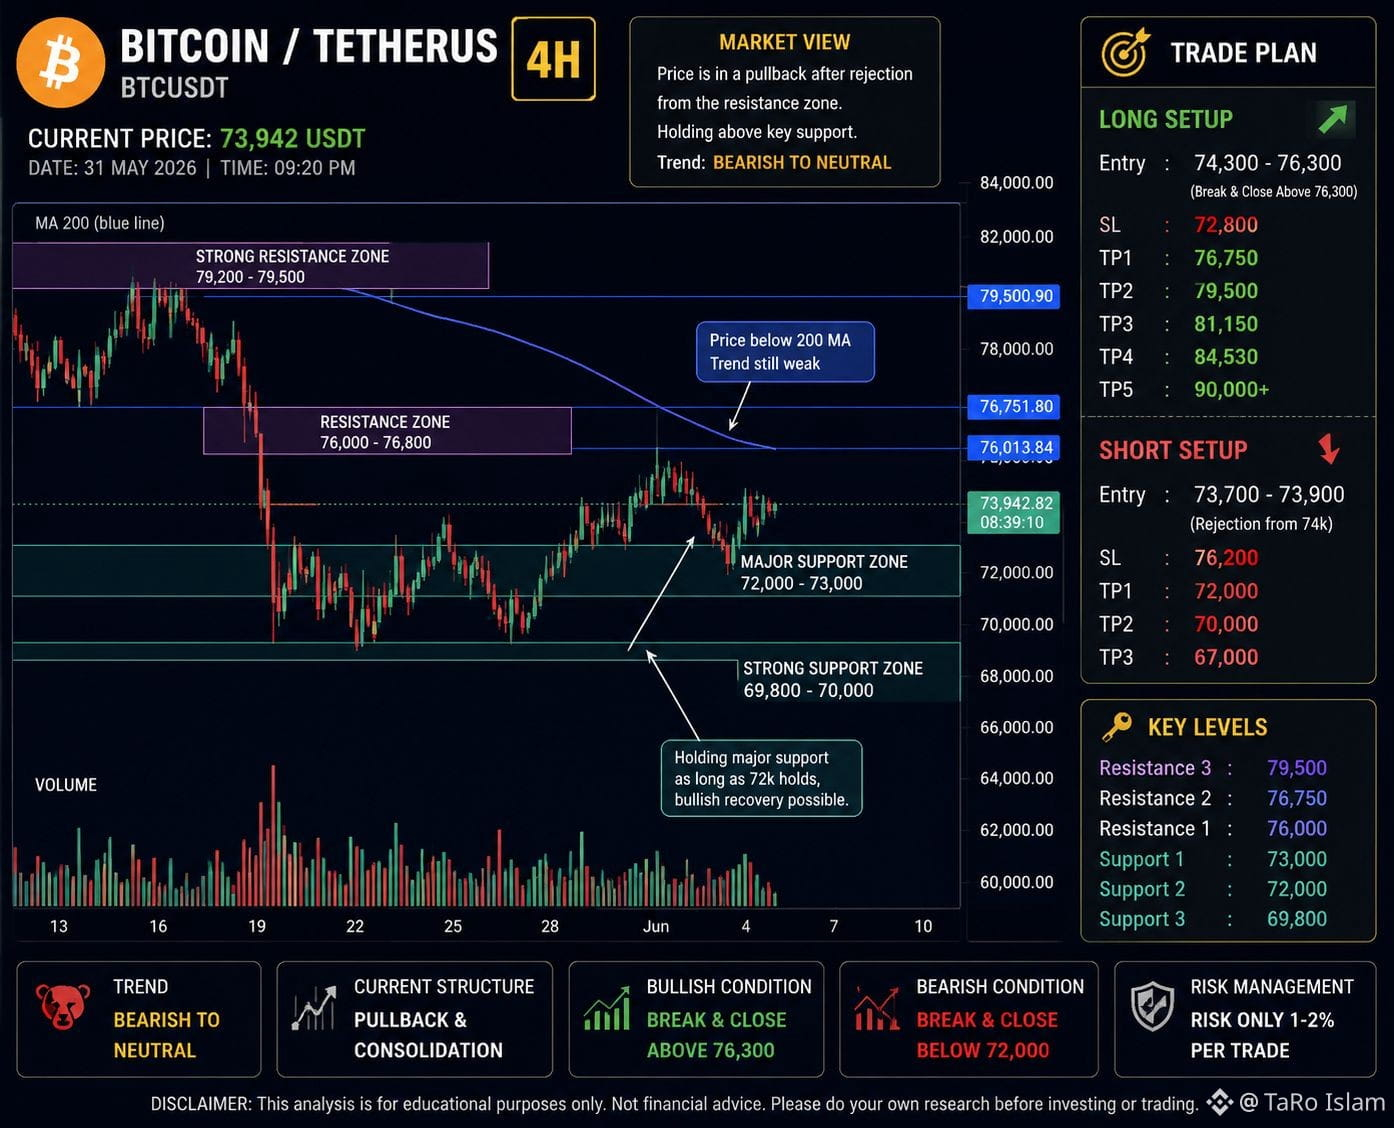
BTC Long Setup (Bevorzugt) 📈
Einstieg: 73.820 – 73.900
Stop Loss: 73.680
TP1: 74.050
TP2: 74.180
TP3: 74.290
#Time #is #Most #IMPORTANT:
$ETH $BTC
{future}(BTCUSDT)
{future}(ETHUSDT)
BTC Long Setup (Bevorzugt) 📈
Einstieg: 73.820 – 73.900
Stop Loss: 73.680
TP1: 74.050
TP2: 74.180
TP3: 74.290
#Time #is #Most #IMPORTANT:
$ETH $BTC
Einstieg: 73.820 – 73.900
Stop Loss: 73.680
TP1: 74.050
TP2: 74.180
TP3: 74.290
#Time #is #Most #IMPORTANT:
$ETH $BTC
1
99
·
--
Bullisch
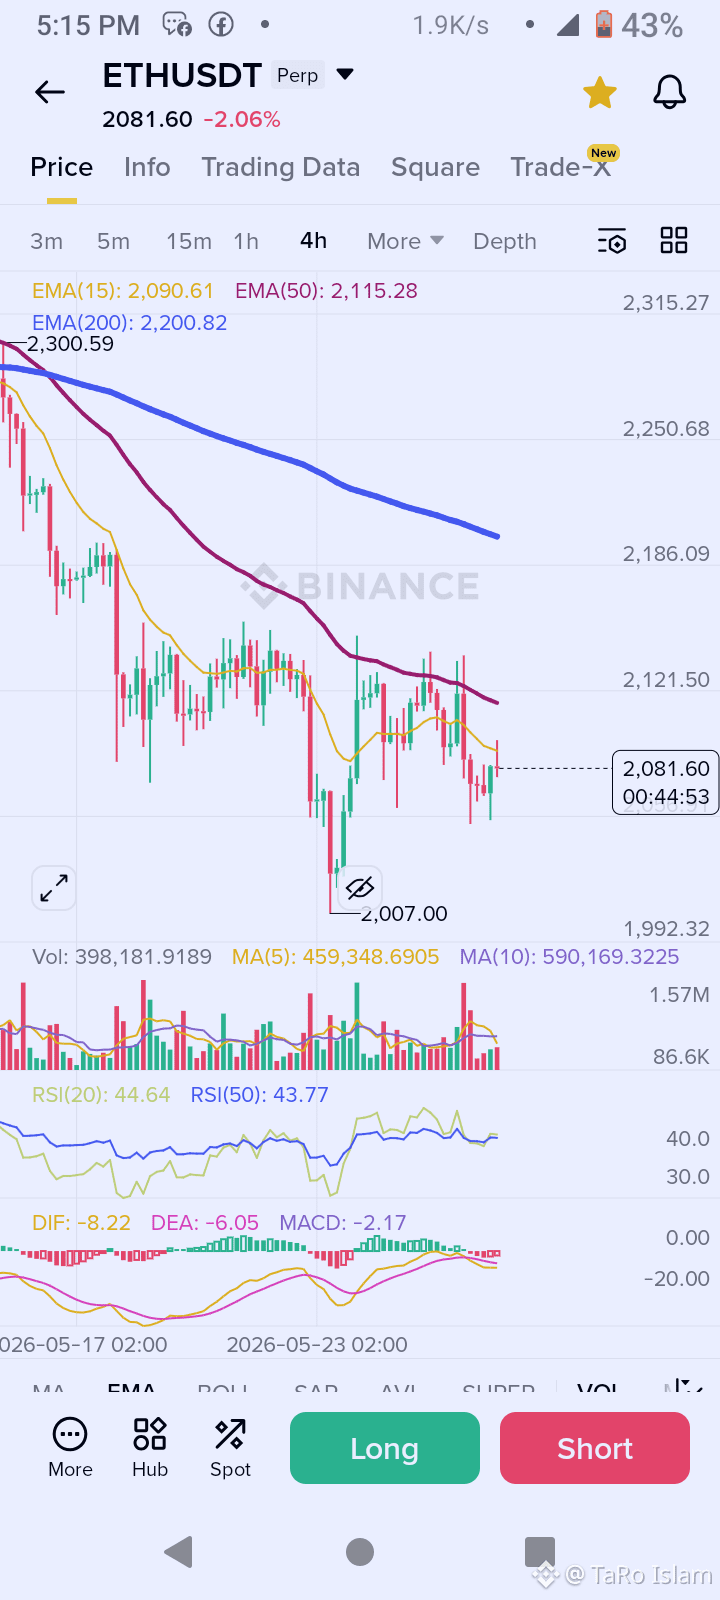
$ETH ⚡ Aggressives Long (aktueller Preis)
Wenn du jetzt einsteigst (~2080):
Einstieg: 2075 – 2085
SL: 2035
TP: 2120 / 2150
{future}(ETHUSDT)
$SOL
{future}(SOLUSDT)
$USDC
{future}(USDCUSDT)
$ETH ⚡ Aggressives Long (aktueller Preis)
Wenn du jetzt einsteigst (~2080):
Einstieg: 2075 – 2085
SL: 2035
TP: 2120 / 2150
$SOL
$USDC
Wenn du jetzt einsteigst (~2080):
Einstieg: 2075 – 2085
SL: 2035
TP: 2120 / 2150
$SOL
$USDC
1
1
162
·
--
Bärisch
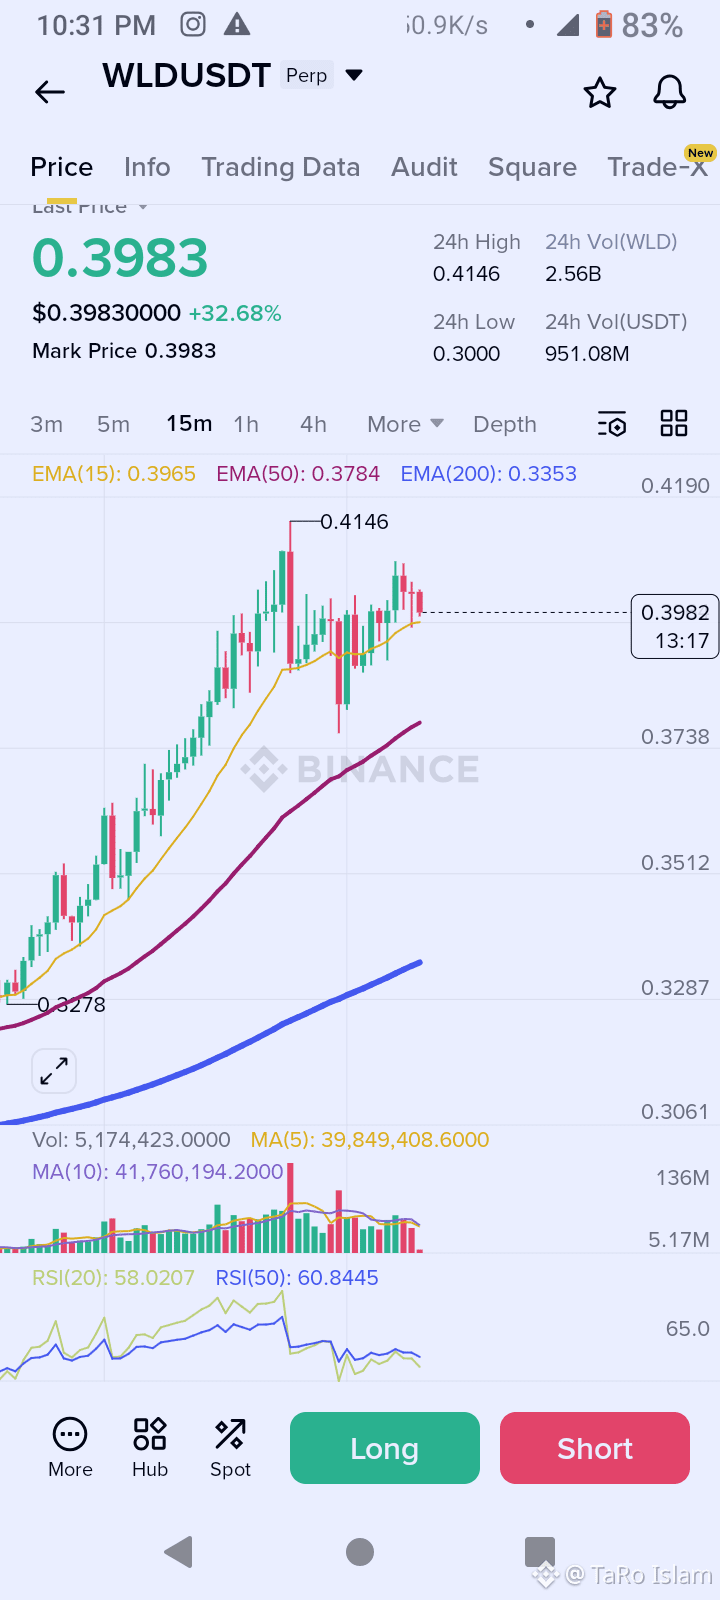
$WLD USDT Abwärtstrend Short Einstieg Setup (15m)
🔻 Short Einstieg Zone: 0.397 – 0.400
🛑 Stop Loss: 0.404
🎯 Take Profit Ziele:
TP1: 0.390
TP2: 0.384
TP3: 0.378
{future}(WLDUSDT)
$SOL
{future}(SOLUSDT)
$BNB
{future}(BNBUSDT)
$WLD USDT Abwärtstrend Short Einstieg Setup (15m)
🔻 Short Einstieg Zone: 0.397 – 0.400
🛑 Stop Loss: 0.404
🎯 Take Profit Ziele:
TP1: 0.390
TP2: 0.384
TP3: 0.378
$SOL
$BNB
🔻 Short Einstieg Zone: 0.397 – 0.400
🛑 Stop Loss: 0.404
🎯 Take Profit Ziele:
TP1: 0.390
TP2: 0.384
TP3: 0.378
$SOL
$BNB
1
1
79
·
--
Bullisch
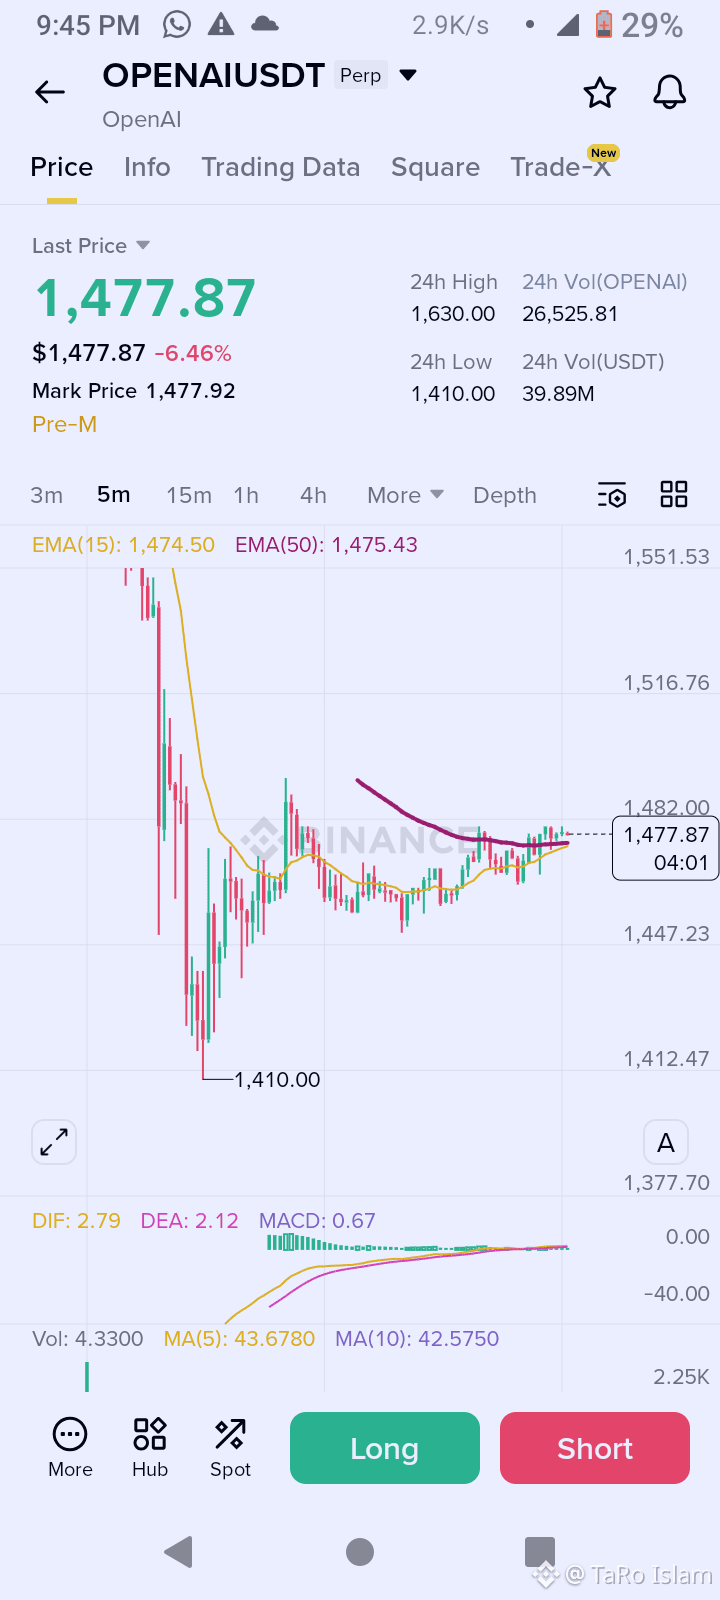
$OPENAI OPENAIUSDT (5M) — Kurzfristiges Setup 📊Long Entry ✅
Einstiegszone: 1472 – 1476
Stop-Loss: 1462
Take Profit 1: 1488
Take Profit 2: 1502
Take Profit 3: 1515
{future}(OPENAIUSDT)
$SOL
{future}(SOLUSDT)
$TIA
{future}(TIAUSDT)
$OPENAI OPENAIUSDT (5M) — Kurzfristiges Setup 📊Long Entry ✅
Einstiegszone: 1472 – 1476
Stop-Loss: 1462
Take Profit 1: 1488
Take Profit 2: 1502
Take Profit 3: 1515
$SOL
$TIA
Einstiegszone: 1472 – 1476
Stop-Loss: 1462
Take Profit 1: 1488
Take Profit 2: 1502
Take Profit 3: 1515
$SOL
$TIA
1
338
·
--
Bullisch
$OPENAI
{future}(OPENAIUSDT)
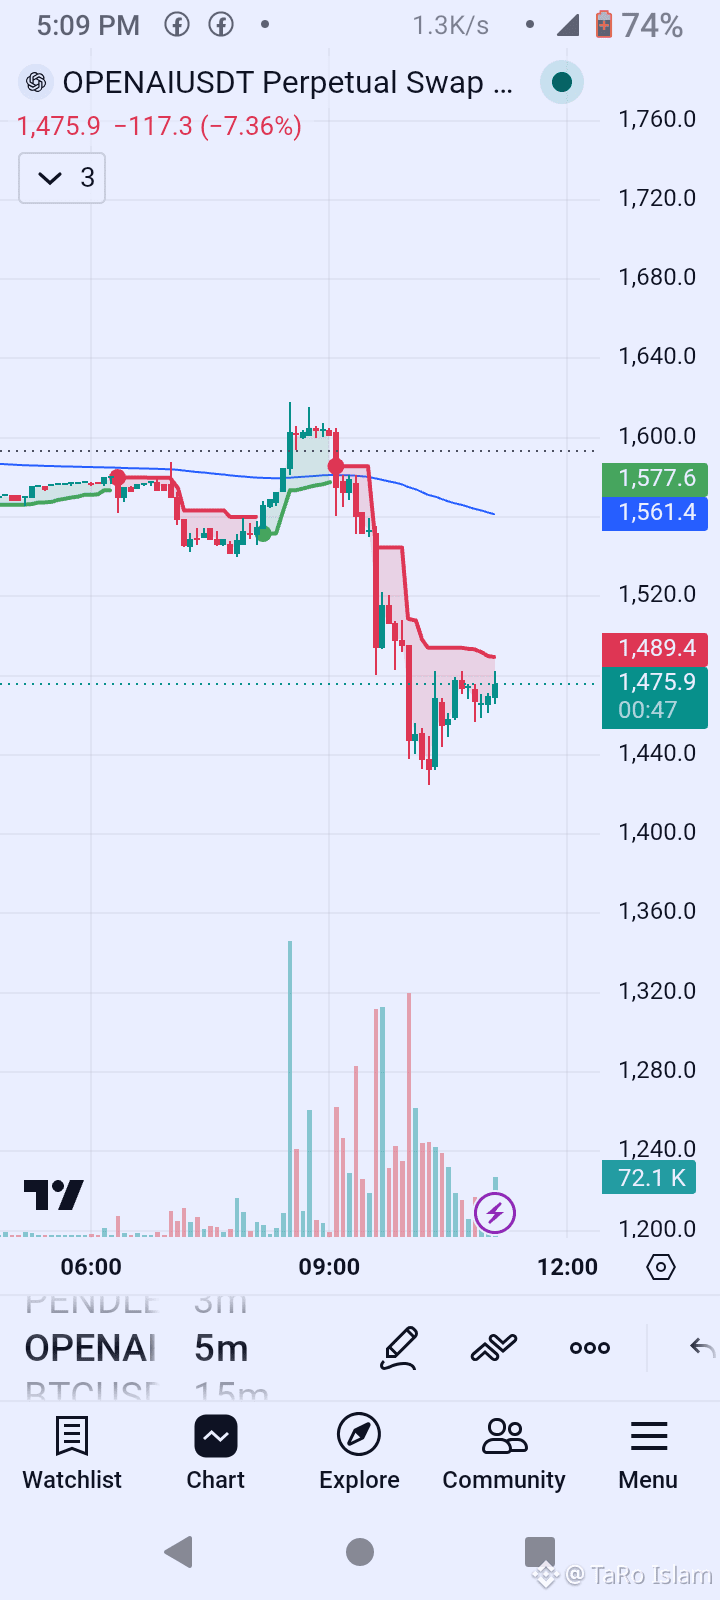
Schnelles Scalping Long (Gegentrend)
Einstieg: 1492 über Schluss
SL: 1470
TP: 1515 → 1530
$BTC $SOL DigitalAssetOutflow$1.47B
{future}(BTCUSDT)
$OPENAI
Schnelles Scalping Long (Gegentrend)
Einstieg: 1492 über Schluss
SL: 1470
TP: 1515 → 1530
$BTC $SOL DigitalAssetOutflow$1.47B
Schnelles Scalping Long (Gegentrend)
Einstieg: 1492 über Schluss
SL: 1470
TP: 1515 → 1530
$BTC $SOL DigitalAssetOutflow$1.47B
369
·
--
Bullisch
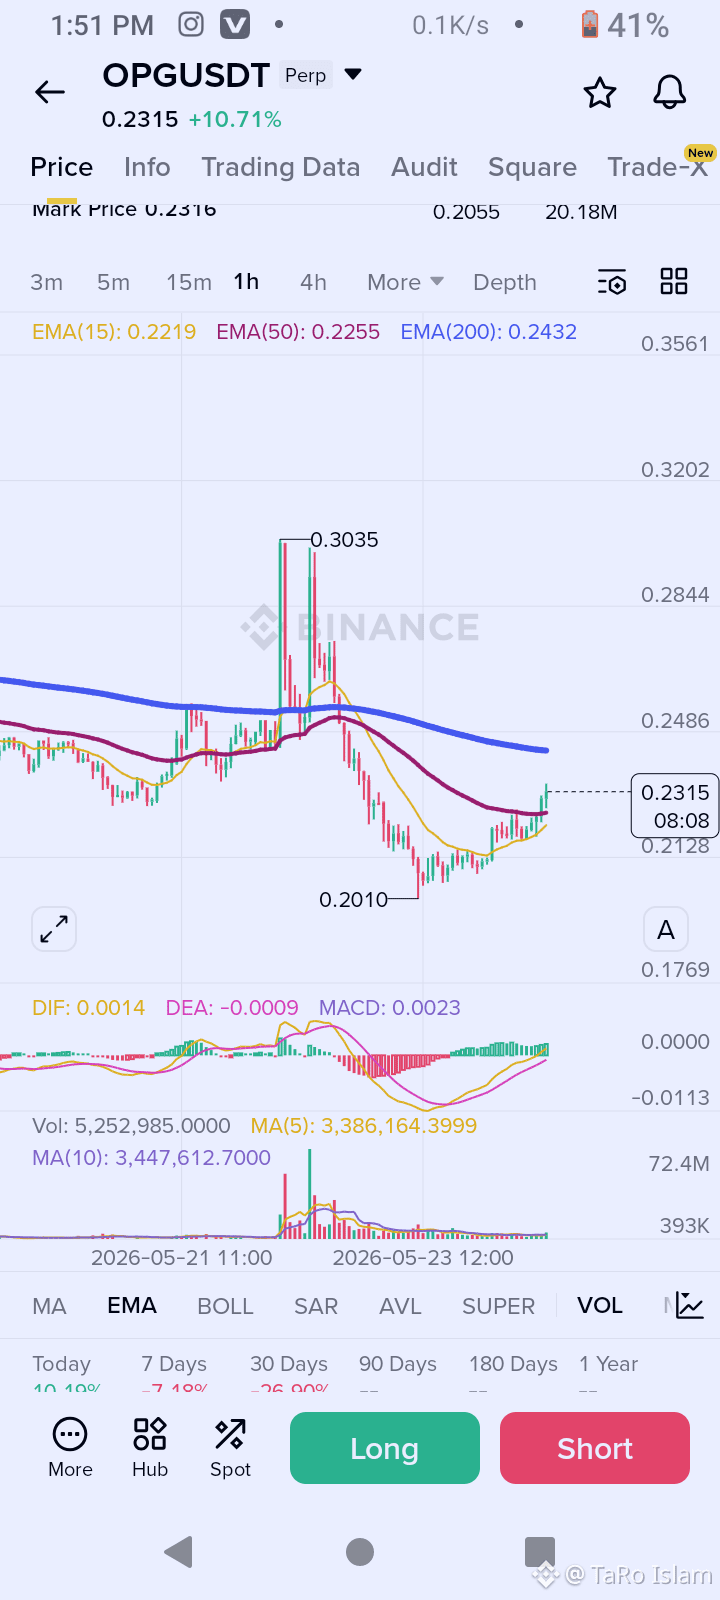
OPGUSDT 1H
Sniper Long Setup:
Einstiegszone: 0.228 – 0.231
SL: 0.219
TP1: 0.238
TP2: 0.243
TP3: 0.252
$OPG
{future}(OPGUSDT)
$SOL
{future}(SOLUSDT)
$BNB
{future}(BNBUSDT)
#TrumpSaysIranDealLargelyNegotiated #StablRDepegsAfterAttack #StablRDepegsAfterAttack BitcoinETFsHaben$1.26BMitSechsTagenAbgebaut#SECHaltsInnovationExemption #ECBOpposesEuroStablecoinExpansion
OPGUSDT 1H
Sniper Long Setup:
Einstiegszone: 0.228 – 0.231
SL: 0.219
TP1: 0.238
TP2: 0.243
TP3: 0.252
$OPG
$SOL
$BNB
#TrumpSaysIranDealLargelyNegotiated #StablRDepegsAfterAttack #StablRDepegsAfterAttack BitcoinETFsHaben$1.26BMitSechsTagenAbgebaut#SECHaltsInnovationExemption #ECBOpposesEuroStablecoinExpansion
Sniper Long Setup:
Einstiegszone: 0.228 – 0.231
SL: 0.219
TP1: 0.238
TP2: 0.243
TP3: 0.252
$OPG
$SOL
$BNB
#TrumpSaysIranDealLargelyNegotiated #StablRDepegsAfterAttack #StablRDepegsAfterAttack BitcoinETFsHaben$1.26BMitSechsTagenAbgebaut#SECHaltsInnovationExemption #ECBOpposesEuroStablecoinExpansion
298
Anmelden und weiter Inhalte entdecken
Krypto-Nutzer weltweit auf Binance Square kennenlernen
⚡️ Bleib in Sachen Krypto stets am Puls.
💬 Die weltgrößte Kryptobörse vertraut darauf.
👍 Erhalte verlässliche Einblicke von verifizierten Creators.
E-Mail-Adresse/Telefonnummer
Trendthemen
USPPIMissMayEaseBTCPressure
105,348 Aufrufe
1,317 Kommentare
US-Erzeugerpreise steigen im Oktober im Jahresvergleich um 6,5 % und liegen damit leicht unter der Prognose von 6,6 %
Binance News
·18 Likes
·20.9k Aufrufe
MANTRAPausesUnstakingFor7DaysAfterKeplrSecurityIncident
1,068 Aufrufe
21 Kommentare
BitcoinCoreDisclosesTorTrafficVulnerability
50,399 Aufrufe
781 Kommentare