
Mastering Market Moves with jacob
703 Beiträge

Mastering Market Moves with jacob
Melden
Nutzer blockieren
Sharing deep insights market knowledge news proven trading strategies and indicators
Gelegenheitstrader
2.7 Jahre
8.2K+ Following
3.2K+ Follower
1.9K+ Like gegeben
Beiträge
Alle
Zitierungen
Videos
PINNED
🇩🇪 US-INFLATION IST UM 3% NIEDRIGER ALS ERWARTET, DU WEISST, WAS NUN KOMMT #CPIWatch #Inflation #APRBinanceTGE #MarketRebound
🇩🇪 US-INFLATION IST UM 3% NIEDRIGER ALS ERWARTET, DU WEISST, WAS NUN KOMMT #CPIWatch #Inflation #APRBinanceTGE #MarketRebound
3
1
47
20.8k
PINNED
SEPTEMBER CPI BERICHT INFLATION NIEDRIGER ALS ERWARTET
#Inflation #CPIWatch #MarketRebound #BitcoinETFNetInflows
SEPTEMBER CPI BERICHT INFLATION NIEDRIGER ALS ERWARTET
#Inflation #CPIWatch #MarketRebound #BitcoinETFNetInflows
#Inflation #CPIWatch #MarketRebound #BitcoinETFNetInflows
8
3.5k
Krypto-Nachrichten-Digest: Treasury-Verschiebungen, zurückgewonnene Millionen und Makro-SignaleHier sind die wichtigsten Krypto-Nachrichten von heute:
1. Remixpoint stellt auf Bitcoin-Only-Treasury um
- Was passiert ist: Das japanische Unternehmen Remixpoint verkaufte seine $ETH und XRP-Bestände, um zu einer exklusiven $BTC Unternehmens-Treasury-Strategie überzugehen.
- Warum es wichtig ist: Signalisiert die wachsende institutionelle Nachfrage nach Bitcoin als alleinigen Unternehmens-Reservewert gegenüber Altcoins.
- Quelle: Decrypt
2. Investor holt 4,5 Mio. $ in verlorener Krypto zurück
- Was passiert ist: Ein britischer Investor erhielt wieder Zugang zu einem Bitcoin-Bestand aus dem Jahr 2012 im Wert von 4,5 Millionen $, der ursprünglich für nur 2.000 $ gekauft wurde.
Krypto-Nachrichten-Digest: Treasury-Verschiebungen, zurückgewonnene Millionen und Makro-Signale
Hier sind die wichtigsten Krypto-Nachrichten von heute:
1. Remixpoint stellt auf Bitcoin-Only-Treasury um
- Was passiert ist: Das japanische Unternehmen Remixpoint verkaufte seine $ETH und XRP-Bestände, um zu einer exklusiven $BTC Unternehmens-Treasury-Strategie überzugehen.
- Warum es wichtig ist: Signalisiert die wachsende institutionelle Nachfrage nach Bitcoin als alleinigen Unternehmens-Reservewert gegenüber Altcoins.
- Quelle: Decrypt
2. Investor holt 4,5 Mio. $ in verlorener Krypto zurück
- Was passiert ist: Ein britischer Investor erhielt wieder Zugang zu einem Bitcoin-Bestand aus dem Jahr 2012 im Wert von 4,5 Millionen $, der ursprünglich für nur 2.000 $ gekauft wurde.
1. Remixpoint stellt auf Bitcoin-Only-Treasury um
- Was passiert ist: Das japanische Unternehmen Remixpoint verkaufte seine $ETH und XRP-Bestände, um zu einer exklusiven $BTC Unternehmens-Treasury-Strategie überzugehen.
- Warum es wichtig ist: Signalisiert die wachsende institutionelle Nachfrage nach Bitcoin als alleinigen Unternehmens-Reservewert gegenüber Altcoins.
- Quelle: Decrypt
2. Investor holt 4,5 Mio. $ in verlorener Krypto zurück
- Was passiert ist: Ein britischer Investor erhielt wieder Zugang zu einem Bitcoin-Bestand aus dem Jahr 2012 im Wert von 4,5 Millionen $, der ursprünglich für nur 2.000 $ gekauft wurde.
143
Übersetzung ansehen
Unlocking Market Depth: A Complete Guide to Order Books, Slippage, and Liquidity VisualsWhen observing digital asset markets, most market participants focus primarily on the spot ticker price—the glowing number indicating the last trade executed on an exchange. While the ticker price reflects historical transactions, it tells you very little about where the market might head next or how easily you can enter and exit a position.
To gain a clearer understanding of market structure, intermediate traders look beneath the headline price into market depth. Market depth reveals the real-time supply and demand dynamics waiting to be filled across various price levels. By learning to analyze market depth, order books, and depth charts, market participants can better anticipate price volatility, measure execution risk, and make more informed trading decisions.
---
### 1. Understanding the Mechanics of an Order Book
At the core of every centralized digital asset exchange lies an automated order-matching engine powered by an order book. An order book is a real-time, continuously updated list of open buy and sell limit orders submitted by market participants.
The order book is structured into two main sides:
* **The Bid Side (Buyers):** Located on the left or bottom (typically highlighted in green), bids represent orders from market participants willing to buy an asset at a specified maximum price. Bids are sorted in descending order, with the highest buy offer placed at the very top.
* **The Ask Side (Sellers):** Located on the right or top (typically highlighted in red), asks (or offers) represent orders from market participants willing to sell an asset at a specified minimum price. Asks are sorted in ascending order, with the lowest sell offer placed at the top.
The gap between the highest bid price and the lowest ask price is known as the **bid-ask spread**.
In highly liquid markets featuring high trading volumes, the spread is extremely narrow—often fractions of a cent. In illiquid markets, the spread can be significantly wider. The middle point between the highest bid and lowest ask is defined as the mid-market price, though actual market orders are always executed against the prevailing bid or ask.
---
### 2. Market Orders vs. Limit Orders: The Engine of Liquidity
To understand market depth, one must distinguish between liquidity providers (makers) and liquidity takers (buyers/sellers using market orders).
* **Limit Orders (Liquidity Makers):** When a trader submits a limit order—for example, placing an order to buy 5 Bitcoin at $60,000 when the market price is $60,500—that order does not execute immediately. Instead, it sits in the order book, adding to the market’s total depth.
* **Market Orders (Liquidity Takers):** When a trader submits a market order—for example, placing an instant order to buy 5 Bitcoin at current market prices—the engine matches that order immediately against the best available limit asks residing in the order book.
Market depth is essentially the sum of all resting limit orders available to absorb incoming market orders. If the volume of resting limit orders is substantial across tightly clustered price levels, the market is considered "deep." If resting orders are sparse and spread far apart, the market is considered "thin."
---
### 3. Deconstructing the Visual Depth Chart
Most exchange trading interfaces offer a graphical representation of the order book known as the **Depth Chart**.
The depth chart plots price along the horizontal axis (X-axis) and cumulative order quantity along the vertical axis (Y-axis).
* **The Green Slope (Cumulative Bids):** Visualizes the total aggregate demand available at or below the current market price. As price moves lower along the X-axis, the line rises because it accumulates all buy orders from the market price down to lower support levels.
* **The Red Slope (Cumulative Asks):** Visualizes the total aggregate supply available at or above the current market price. As price moves higher along the X-axis, the line rises as it accumulates all sell orders from the market price up to higher resistance levels.
#### Interpreting "Order Book Walls"
A steep, near-vertical section on a depth chart indicates a massive concentration of limit orders at a specific price point, commonly referred to as a **buy wall** or a **sell wall**.
* **A Buy Wall:** A massive quantity of buy limit orders clustered at a specific support price. To push the market price below this level, sellers must dump enough market supply to consume the entire wall.
* **A Sell Wall:** A massive quantity of sell limit orders clustered at a specific overhead price. To push the price above this level, buyers must purchase enough volume to swallow all the supply waiting at that level.
---
### 4. Practical Implications: Slippage and Order Execution
Understanding market depth is essential for executing trades efficiently and avoiding unexpected costs, particularly **slippage**.
Slippage occurs when a market order is executed at a price different from the price expected when the order was placed. Slippage happens because the top of the order book does not contain enough liquidity to fill the total requested order size.
#### Example Scenario: "Walking the Order Book"
Imagine an illiquid market for an altcoin where the current best ask price is $10.00, and the order book displays the following sell limit orders:
* **Level 1:** 100 units available at $10.00
* **Level 2:** 200 units available at $10.50
* **Level 3:** 500 units available at $11.00
If a trader submits a market buy order for **400 units**, the matching engine will fill the order dynamically across multiple levels:
1. Fills 100 units at $10.00 (Cost: $1,000)
2. Fills remaining 300 units at $10.50 (Cost: $3,150)
The total purchase cost becomes $4,150, resulting in an average execution price of **$10.375 per unit**. The trader experienced **3.75% slippage** above the initial expected price of $10.00 because the market depth was insufficient to absorb a 400-unit market order at a single level.
By analyzing market depth beforehand, the trader could have opted to split the order into smaller increments over time or used limit orders to avoid paying premium slippage rates.
---
### 5. Advanced Nuances, Risks, and Order Book Manipulations
While market depth provides invaluable real-time information, relying solely on static order book visuals carries distinct risks. Order books are dynamic, rapidly changing environments subject to strategic maneuvers by high-frequency trading algorithms and institutional actors.
#### A. Spoofing and Phantom Liquidity
Spoofing occurs when entities place large buy or sell limit orders with no intention of executing them. A trader might place a massive buy wall to create a false narrative of strong demand, encouraging retail buyers to jump in. Once the price ticks higher, the trader cancels the buy wall before it can be executed and sells their actual inventory into the retail momentum.
#### B. Iceberg Orders
Institutional participants trading large volumes rarely display their full order size openly in the depth chart. Instead, they utilize **iceberg orders**—automated execution algorithms that split a large order into small, visible slices. As soon as one visible slice is consumed, the system automatically posts the next segment. Therefore, a price level that appears to have low depth may actually hide significant underlying liquidity.
#### C. Cross-Exchange Liquidity Fragmentation
In modern crypto markets, trading volume is fragmented across dozens of centralized venues, decentralized exchanges (DEXs), and over-the-counter (OTC) desks. An order book on a single exchange only captures a fraction of global liquidity. A deep book on Exchange A does not guarantee that market makers won't instantly pull liquidity if external prices move on Exchange B.
---
### 6. Integrating Market Depth into a Risk Management Strategy
Market depth analysis should serve as one component of a broader risk management methodology rather than a standalone directional indicator.
* **Pre-Trade Size Assessment:** Before submitting large trades, check the depth chart to calculate maximum allowable trade sizes without incurring structural slippage.
* **Volatility Anticipation:** When market depth thins out drastically on both sides of the book (often occurring prior to major macroeconomic announcements), market volatility tends to spike dramatically, as even small trades can trigger sizable price swings.
* **Combining with On-Chain and Technical Analysis:** Use market depth to validate technical chart patterns. If a chart indicates a major technical resistance line, cross-reference it with the order book to confirm whether a real sell wall exists at that level.
---
### Final Thoughts
Market depth offers a clear window into market structure, revealing the true supply and demand mechanics behind digital asset prices. By reading order books effectively, assessing cumulative depth charts, and factoring in execution slippage, intermediate traders can navigate volatile environments with greater precision. However, always remain aware of dynamic order cancellations, hidden liquidity, and market manipulation techniques that can alter market depth in milliseconds.
#CryptoEducation #MarketDepth #TradingStrategy
Unlocking Market Depth: A Complete Guide to Order Books, Slippage, and Liquidity Visuals
When observing digital asset markets, most market participants focus primarily on the spot ticker price—the glowing number indicating the last trade executed on an exchange. While the ticker price reflects historical transactions, it tells you very little about where the market might head next or how easily you can enter and exit a position.
To gain a clearer understanding of market structure, intermediate traders look beneath the headline price into market depth. Market depth reveals the real-time supply and demand dynamics waiting to be filled across various price levels. By learning to analyze market depth, order books, and depth charts, market participants can better anticipate price volatility, measure execution risk, and make more informed trading decisions.
---
### 1. Understanding the Mechanics of an Order Book
At the core of every centralized digital asset exchange lies an automated order-matching engine powered by an order book. An order book is a real-time, continuously updated list of open buy and sell limit orders submitted by market participants.
The order book is structured into two main sides:
* **The Bid Side (Buyers):** Located on the left or bottom (typically highlighted in green), bids represent orders from market participants willing to buy an asset at a specified maximum price. Bids are sorted in descending order, with the highest buy offer placed at the very top.
* **The Ask Side (Sellers):** Located on the right or top (typically highlighted in red), asks (or offers) represent orders from market participants willing to sell an asset at a specified minimum price. Asks are sorted in ascending order, with the lowest sell offer placed at the top.
The gap between the highest bid price and the lowest ask price is known as the **bid-ask spread**.
In highly liquid markets featuring high trading volumes, the spread is extremely narrow—often fractions of a cent. In illiquid markets, the spread can be significantly wider. The middle point between the highest bid and lowest ask is defined as the mid-market price, though actual market orders are always executed against the prevailing bid or ask.
---
### 2. Market Orders vs. Limit Orders: The Engine of Liquidity
To understand market depth, one must distinguish between liquidity providers (makers) and liquidity takers (buyers/sellers using market orders).
* **Limit Orders (Liquidity Makers):** When a trader submits a limit order—for example, placing an order to buy 5 Bitcoin at $60,000 when the market price is $60,500—that order does not execute immediately. Instead, it sits in the order book, adding to the market’s total depth.
* **Market Orders (Liquidity Takers):** When a trader submits a market order—for example, placing an instant order to buy 5 Bitcoin at current market prices—the engine matches that order immediately against the best available limit asks residing in the order book.
Market depth is essentially the sum of all resting limit orders available to absorb incoming market orders. If the volume of resting limit orders is substantial across tightly clustered price levels, the market is considered "deep." If resting orders are sparse and spread far apart, the market is considered "thin."
---
### 3. Deconstructing the Visual Depth Chart
Most exchange trading interfaces offer a graphical representation of the order book known as the **Depth Chart**.
The depth chart plots price along the horizontal axis (X-axis) and cumulative order quantity along the vertical axis (Y-axis).
* **The Green Slope (Cumulative Bids):** Visualizes the total aggregate demand available at or below the current market price. As price moves lower along the X-axis, the line rises because it accumulates all buy orders from the market price down to lower support levels.
* **The Red Slope (Cumulative Asks):** Visualizes the total aggregate supply available at or above the current market price. As price moves higher along the X-axis, the line rises as it accumulates all sell orders from the market price up to higher resistance levels.
#### Interpreting "Order Book Walls"
A steep, near-vertical section on a depth chart indicates a massive concentration of limit orders at a specific price point, commonly referred to as a **buy wall** or a **sell wall**.
* **A Buy Wall:** A massive quantity of buy limit orders clustered at a specific support price. To push the market price below this level, sellers must dump enough market supply to consume the entire wall.
* **A Sell Wall:** A massive quantity of sell limit orders clustered at a specific overhead price. To push the price above this level, buyers must purchase enough volume to swallow all the supply waiting at that level.
---
### 4. Practical Implications: Slippage and Order Execution
Understanding market depth is essential for executing trades efficiently and avoiding unexpected costs, particularly **slippage**.
Slippage occurs when a market order is executed at a price different from the price expected when the order was placed. Slippage happens because the top of the order book does not contain enough liquidity to fill the total requested order size.
#### Example Scenario: "Walking the Order Book"
Imagine an illiquid market for an altcoin where the current best ask price is $10.00, and the order book displays the following sell limit orders:
* **Level 1:** 100 units available at $10.00
* **Level 2:** 200 units available at $10.50
* **Level 3:** 500 units available at $11.00
If a trader submits a market buy order for **400 units**, the matching engine will fill the order dynamically across multiple levels:
1. Fills 100 units at $10.00 (Cost: $1,000)
2. Fills remaining 300 units at $10.50 (Cost: $3,150)
The total purchase cost becomes $4,150, resulting in an average execution price of **$10.375 per unit**. The trader experienced **3.75% slippage** above the initial expected price of $10.00 because the market depth was insufficient to absorb a 400-unit market order at a single level.
By analyzing market depth beforehand, the trader could have opted to split the order into smaller increments over time or used limit orders to avoid paying premium slippage rates.
---
### 5. Advanced Nuances, Risks, and Order Book Manipulations
While market depth provides invaluable real-time information, relying solely on static order book visuals carries distinct risks. Order books are dynamic, rapidly changing environments subject to strategic maneuvers by high-frequency trading algorithms and institutional actors.
#### A. Spoofing and Phantom Liquidity
Spoofing occurs when entities place large buy or sell limit orders with no intention of executing them. A trader might place a massive buy wall to create a false narrative of strong demand, encouraging retail buyers to jump in. Once the price ticks higher, the trader cancels the buy wall before it can be executed and sells their actual inventory into the retail momentum.
#### B. Iceberg Orders
Institutional participants trading large volumes rarely display their full order size openly in the depth chart. Instead, they utilize **iceberg orders**—automated execution algorithms that split a large order into small, visible slices. As soon as one visible slice is consumed, the system automatically posts the next segment. Therefore, a price level that appears to have low depth may actually hide significant underlying liquidity.
#### C. Cross-Exchange Liquidity Fragmentation
In modern crypto markets, trading volume is fragmented across dozens of centralized venues, decentralized exchanges (DEXs), and over-the-counter (OTC) desks. An order book on a single exchange only captures a fraction of global liquidity. A deep book on Exchange A does not guarantee that market makers won't instantly pull liquidity if external prices move on Exchange B.
---
### 6. Integrating Market Depth into a Risk Management Strategy
Market depth analysis should serve as one component of a broader risk management methodology rather than a standalone directional indicator.
* **Pre-Trade Size Assessment:** Before submitting large trades, check the depth chart to calculate maximum allowable trade sizes without incurring structural slippage.
* **Volatility Anticipation:** When market depth thins out drastically on both sides of the book (often occurring prior to major macroeconomic announcements), market volatility tends to spike dramatically, as even small trades can trigger sizable price swings.
* **Combining with On-Chain and Technical Analysis:** Use market depth to validate technical chart patterns. If a chart indicates a major technical resistance line, cross-reference it with the order book to confirm whether a real sell wall exists at that level.
---
### Final Thoughts
Market depth offers a clear window into market structure, revealing the true supply and demand mechanics behind digital asset prices. By reading order books effectively, assessing cumulative depth charts, and factoring in execution slippage, intermediate traders can navigate volatile environments with greater precision. However, always remain aware of dynamic order cancellations, hidden liquidity, and market manipulation techniques that can alter market depth in milliseconds.
#CryptoEducation #MarketDepth #TradingStrategy
To gain a clearer understanding of market structure, intermediate traders look beneath the headline price into market depth. Market depth reveals the real-time supply and demand dynamics waiting to be filled across various price levels. By learning to analyze market depth, order books, and depth charts, market participants can better anticipate price volatility, measure execution risk, and make more informed trading decisions.
---
### 1. Understanding the Mechanics of an Order Book
At the core of every centralized digital asset exchange lies an automated order-matching engine powered by an order book. An order book is a real-time, continuously updated list of open buy and sell limit orders submitted by market participants.
The order book is structured into two main sides:
* **The Bid Side (Buyers):** Located on the left or bottom (typically highlighted in green), bids represent orders from market participants willing to buy an asset at a specified maximum price. Bids are sorted in descending order, with the highest buy offer placed at the very top.
* **The Ask Side (Sellers):** Located on the right or top (typically highlighted in red), asks (or offers) represent orders from market participants willing to sell an asset at a specified minimum price. Asks are sorted in ascending order, with the lowest sell offer placed at the top.
The gap between the highest bid price and the lowest ask price is known as the **bid-ask spread**.
In highly liquid markets featuring high trading volumes, the spread is extremely narrow—often fractions of a cent. In illiquid markets, the spread can be significantly wider. The middle point between the highest bid and lowest ask is defined as the mid-market price, though actual market orders are always executed against the prevailing bid or ask.
---
### 2. Market Orders vs. Limit Orders: The Engine of Liquidity
To understand market depth, one must distinguish between liquidity providers (makers) and liquidity takers (buyers/sellers using market orders).
* **Limit Orders (Liquidity Makers):** When a trader submits a limit order—for example, placing an order to buy 5 Bitcoin at $60,000 when the market price is $60,500—that order does not execute immediately. Instead, it sits in the order book, adding to the market’s total depth.
* **Market Orders (Liquidity Takers):** When a trader submits a market order—for example, placing an instant order to buy 5 Bitcoin at current market prices—the engine matches that order immediately against the best available limit asks residing in the order book.
Market depth is essentially the sum of all resting limit orders available to absorb incoming market orders. If the volume of resting limit orders is substantial across tightly clustered price levels, the market is considered "deep." If resting orders are sparse and spread far apart, the market is considered "thin."
---
### 3. Deconstructing the Visual Depth Chart
Most exchange trading interfaces offer a graphical representation of the order book known as the **Depth Chart**.
The depth chart plots price along the horizontal axis (X-axis) and cumulative order quantity along the vertical axis (Y-axis).
* **The Green Slope (Cumulative Bids):** Visualizes the total aggregate demand available at or below the current market price. As price moves lower along the X-axis, the line rises because it accumulates all buy orders from the market price down to lower support levels.
* **The Red Slope (Cumulative Asks):** Visualizes the total aggregate supply available at or above the current market price. As price moves higher along the X-axis, the line rises as it accumulates all sell orders from the market price up to higher resistance levels.
#### Interpreting "Order Book Walls"
A steep, near-vertical section on a depth chart indicates a massive concentration of limit orders at a specific price point, commonly referred to as a **buy wall** or a **sell wall**.
* **A Buy Wall:** A massive quantity of buy limit orders clustered at a specific support price. To push the market price below this level, sellers must dump enough market supply to consume the entire wall.
* **A Sell Wall:** A massive quantity of sell limit orders clustered at a specific overhead price. To push the price above this level, buyers must purchase enough volume to swallow all the supply waiting at that level.
---
### 4. Practical Implications: Slippage and Order Execution
Understanding market depth is essential for executing trades efficiently and avoiding unexpected costs, particularly **slippage**.
Slippage occurs when a market order is executed at a price different from the price expected when the order was placed. Slippage happens because the top of the order book does not contain enough liquidity to fill the total requested order size.
#### Example Scenario: "Walking the Order Book"
Imagine an illiquid market for an altcoin where the current best ask price is $10.00, and the order book displays the following sell limit orders:
* **Level 1:** 100 units available at $10.00
* **Level 2:** 200 units available at $10.50
* **Level 3:** 500 units available at $11.00
If a trader submits a market buy order for **400 units**, the matching engine will fill the order dynamically across multiple levels:
1. Fills 100 units at $10.00 (Cost: $1,000)
2. Fills remaining 300 units at $10.50 (Cost: $3,150)
The total purchase cost becomes $4,150, resulting in an average execution price of **$10.375 per unit**. The trader experienced **3.75% slippage** above the initial expected price of $10.00 because the market depth was insufficient to absorb a 400-unit market order at a single level.
By analyzing market depth beforehand, the trader could have opted to split the order into smaller increments over time or used limit orders to avoid paying premium slippage rates.
---
### 5. Advanced Nuances, Risks, and Order Book Manipulations
While market depth provides invaluable real-time information, relying solely on static order book visuals carries distinct risks. Order books are dynamic, rapidly changing environments subject to strategic maneuvers by high-frequency trading algorithms and institutional actors.
#### A. Spoofing and Phantom Liquidity
Spoofing occurs when entities place large buy or sell limit orders with no intention of executing them. A trader might place a massive buy wall to create a false narrative of strong demand, encouraging retail buyers to jump in. Once the price ticks higher, the trader cancels the buy wall before it can be executed and sells their actual inventory into the retail momentum.
#### B. Iceberg Orders
Institutional participants trading large volumes rarely display their full order size openly in the depth chart. Instead, they utilize **iceberg orders**—automated execution algorithms that split a large order into small, visible slices. As soon as one visible slice is consumed, the system automatically posts the next segment. Therefore, a price level that appears to have low depth may actually hide significant underlying liquidity.
#### C. Cross-Exchange Liquidity Fragmentation
In modern crypto markets, trading volume is fragmented across dozens of centralized venues, decentralized exchanges (DEXs), and over-the-counter (OTC) desks. An order book on a single exchange only captures a fraction of global liquidity. A deep book on Exchange A does not guarantee that market makers won't instantly pull liquidity if external prices move on Exchange B.
---
### 6. Integrating Market Depth into a Risk Management Strategy
Market depth analysis should serve as one component of a broader risk management methodology rather than a standalone directional indicator.
* **Pre-Trade Size Assessment:** Before submitting large trades, check the depth chart to calculate maximum allowable trade sizes without incurring structural slippage.
* **Volatility Anticipation:** When market depth thins out drastically on both sides of the book (often occurring prior to major macroeconomic announcements), market volatility tends to spike dramatically, as even small trades can trigger sizable price swings.
* **Combining with On-Chain and Technical Analysis:** Use market depth to validate technical chart patterns. If a chart indicates a major technical resistance line, cross-reference it with the order book to confirm whether a real sell wall exists at that level.
---
### Final Thoughts
Market depth offers a clear window into market structure, revealing the true supply and demand mechanics behind digital asset prices. By reading order books effectively, assessing cumulative depth charts, and factoring in execution slippage, intermediate traders can navigate volatile environments with greater precision. However, always remain aware of dynamic order cancellations, hidden liquidity, and market manipulation techniques that can alter market depth in milliseconds.
#CryptoEducation #MarketDepth #TradingStrategy
106
Artikel
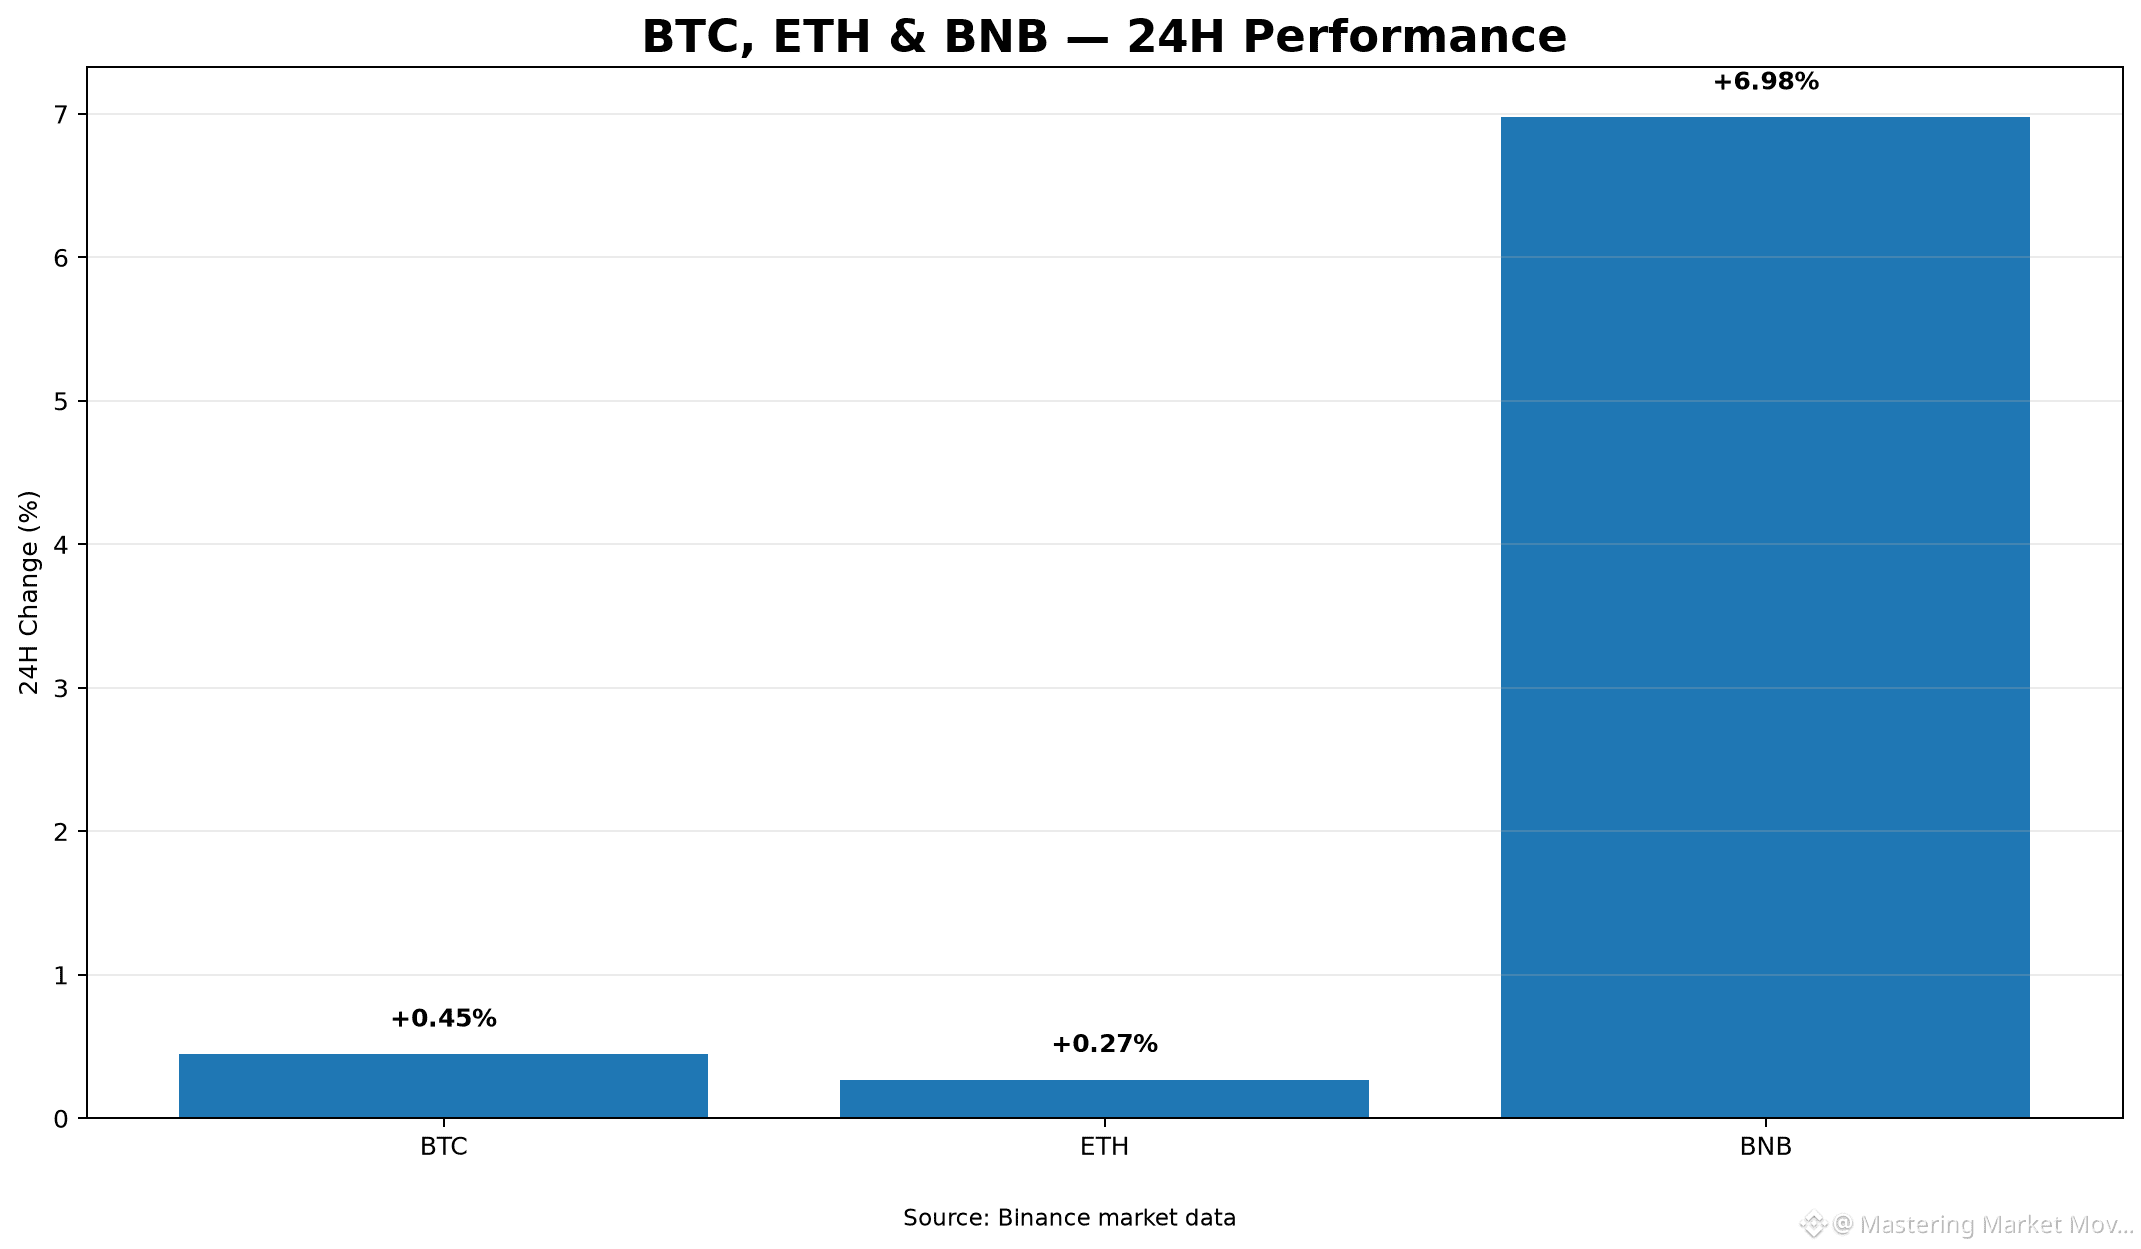
Marktanalyse: BNB übertrifft, während BTC und ETH nahe den 24h-Höchstständen konsolidierenDer Kryptomarkt zeigt eine stabile Performance mit starker relativer Stärke bei $BNB, das um 6,98 % auf 765,88 $ zulegte und sich innerhalb einer 24-Stunden-Spanne von 708,88 $ bis 767,76 $ bewegte. In der Zwischenzeit zeigt $BTC eine leichte Aufwärtsbewegung und wird bei 79.699,92 $ (+0,45 %) zwischen einem Tief von 78.660,00 $ und einem Hoch von 79.877,07 $ gehandelt. $ETH wird mit 2.458,01 $ (+0,27 %) knapp dahinter gehandelt, begrenzt auf eine engere Spanne zwischen 2.431,61 $ und 2.464,49 $.
Volumen- und Volatilitätsanalyse:
Bitcoin dominiert die gesamte Marktliquidität mit einem 24-Stunden-Umsatz von 931,73 Mio. $, was auf eine geringe Volatilität hindeutet, da der Preis nahe seiner oberen Spanne bleibt. Ethereum erzielte ein Volumen von 457,25 Mio. $ innerhalb einer engen Preisspanne von 1,35 %, was auf eine kurze Konsolidierung hindeutet. BNB verzeichnete eine erhöhte Intraday-Volatilität und ein erhebliches Kaufmomentum, gestützt durch ein Volumen von 177,65 Mio. $.
Marktanalyse: BNB übertrifft, während BTC und ETH nahe den 24h-Höchstständen konsolidieren
Der Kryptomarkt zeigt eine stabile Performance mit starker relativer Stärke bei $BNB , das um 6,98 % auf 765,88 $ zulegte und sich innerhalb einer 24-Stunden-Spanne von 708,88 $ bis 767,76 $ bewegte. In der Zwischenzeit zeigt $BTC eine leichte Aufwärtsbewegung und wird bei 79.699,92 $ (+0,45 %) zwischen einem Tief von 78.660,00 $ und einem Hoch von 79.877,07 $ gehandelt. $ETH wird mit 2.458,01 $ (+0,27 %) knapp dahinter gehandelt, begrenzt auf eine engere Spanne zwischen 2.431,61 $ und 2.464,49 $.
Volumen- und Volatilitätsanalyse:
Bitcoin dominiert die gesamte Marktliquidität mit einem 24-Stunden-Umsatz von 931,73 Mio. $, was auf eine geringe Volatilität hindeutet, da der Preis nahe seiner oberen Spanne bleibt. Ethereum erzielte ein Volumen von 457,25 Mio. $ innerhalb einer engen Preisspanne von 1,35 %, was auf eine kurze Konsolidierung hindeutet. BNB verzeichnete eine erhöhte Intraday-Volatilität und ein erhebliches Kaufmomentum, gestützt durch ein Volumen von 177,65 Mio. $.
Volumen- und Volatilitätsanalyse:
Bitcoin dominiert die gesamte Marktliquidität mit einem 24-Stunden-Umsatz von 931,73 Mio. $, was auf eine geringe Volatilität hindeutet, da der Preis nahe seiner oberen Spanne bleibt. Ethereum erzielte ein Volumen von 457,25 Mio. $ innerhalb einer engen Preisspanne von 1,35 %, was auf eine kurze Konsolidierung hindeutet. BNB verzeichnete eine erhöhte Intraday-Volatilität und ein erhebliches Kaufmomentum, gestützt durch ein Volumen von 177,65 Mio. $.
109
Übersetzung ansehen
Demystifying Market Depth: How to Read Order Books and Execute Smarter TradesWhen most participants enter the cryptocurrency market, their primary focus centers on line or candlestick charts. These visual tools show historical price movements, highlighting where an asset traded minutes, hours, or days ago. However, a price chart only reflects trades that have already occurred. To understand where an asset’s price might move next and how efficiently a trade can be executed, traders must look at real-time supply and demand. This is where market depth and the order book become essential tools.
Understanding market depth allows intermediate market participants to look beneath the surface of price action. It reveals the volume of buy and sell orders resting at different price levels, offering vital clues about market liquidity, potential support and resistance zones, and the risk of execution slippage.
---
### What Is Market Depth?
Market depth refers to a market's ability to absorb large trade orders without causing significant fluctuations in price. It measures the total volume of open, unfilled buy and sell orders at varying price points surrounding the current market price.
A market is considered "deep" when there is a high concentration of pending buy and sell orders on both sides of the ledger. In a deep market, executing a large market order will have a minimal impact on the prevailing price because plenty of liquidity is available to absorb the order. Conversely, a "shallow" or "thin" market lacks sufficient order density. In thin markets, even modest buy or sell orders can cause dramatic price shifts, leading to extreme volatility and unexpected trade costs.
---
### The Anatomy of an Order Book
To comprehend market depth, one must first master the structure of an order book. An order book is an electronic, real-time list of outstanding limit orders placed by buyers and sellers on a central limit order book exchange.
The order book is divided into two primary sections:
1. **Bids (Buy Orders):** Listed on one side (typically green), bids represent buyers who specify the maximum price they are willing to pay for a asset, along with the quantity they wish to purchase. Bids are arranged in descending order, with the highest bid price at the top.
2. **Asks or Offers (Sell Orders):** Listed on the opposing side (typically red), asks represent sellers who specify the minimum price they are willing to accept, along with the quantity they wish to sell. Asks are arranged in ascending order, with the lowest ask price at the top.
The gap between the highest bid price and the lowest ask price is known as the **Bid-Ask Spread**.
#### The Depth Chart
Exchanges often visually represent order book data through a graphic known as a depth chart. This chart plots cumulative order volume on the vertical axis against price on the horizontal axis.
* The **green side** shows the total cumulative buying power moving downward from the current price.
* The **red side** shows the total cumulative selling volume moving upward from the current price.
When you observe a steep, wall-like structure on a depth chart—often referred to as a "buy wall" or "sell wall"—it signifies a large concentration of limit orders at a specific price point. These walls can act as psychological barriers or temporarily absorb incoming orders.
---
### Practical Example: Slippage and Order Execution
Understanding market depth is practical, not just theoretical. It directly impacts execution quality, particularly through a phenomenon known as **slippage**. Slippage occurs when a market order executes at a price different from the expected price at the time the order was submitted.
Consider a hypothetical scenario using a mid-cap digital asset, Token X, trading at $10.00.
Suppose the sell side (asks) of the order book looks like this:
* **Ask Level 1:** 100 units at $10.00
* **Ask Level 2:** 200 units at $10.10
* **Ask Level 3:** 500 units at $10.25
* **Ask Level 4:** 1,000 units at $10.50
Imagine Trader A wants to buy 50 units of Token X using a **Market Order**. Because Level 1 offers 100 units at $10.00, Trader A's order is filled immediately and completely at $10.00. The average execution price is $10.00.
Now, imagine Trader B wants to buy 500 units of Token X using a **Market Order** in the same market state:
1. The first 100 units fill at **$10.00** (cost: $1,000).
2. The next 200 units fill at **$10.10** (cost: $2,020).
3. The remaining 200 units fill at **$10.25** (cost: $2,050).
Trader B spent a total of $5,070 for 500 units, resulting in an average purchase price of **$10.14 per unit**.
Although the asset was quoted at $10.00 on the main ticker, Trader B experienced 1.4% slippage due to insufficient depth at the top of the order book. This example illustrates why checking market depth is critical before executing large market orders, particularly in assets like Ethereum, BNB, or smaller altcoins during periods of low volume.
---
### Advanced Concepts: Spoofing, Icebergs, and Phantom Liquidity
While order books offer valuable transparency, relying on visible market depth comes with caveats. Intermediate traders must recognize that the order book is a dynamic environment where visible data can sometimes be misleading.
#### 1. Iceberg Orders
Institutional participants trading large volumes of assets like Bitcoin often seek to minimize market impact. To do this, they use "iceberg orders." An iceberg order is an automated order split into smaller visible limit orders. Only a tiny fraction (the tip of the iceberg) appears in the public order book. As soon as that fraction is filled, another portion automatically populates. As a result, true market depth may be significantly larger than what is visibly displayed.
#### 2. Order Spoofing
Spoofing is a manipulative practice where a trader places large limit orders (e.g., a massive buy wall) with no intention of letting them fill. The goal is to create a false perception of strong demand, encouraging other market participants to buy. Once price rises slightly, the spoofer cancels the large buy order and sells their inventory into the inflated market. Although prohibited on regulated exchanges, fake liquidity can still occur in fast-moving crypto environments.
#### 3. Algorithmic Cancellation
In modern markets, automated High-Frequency Trading (HFT) bots manage a substantial portion of resting liquidity. These bots can place and cancel thousands of orders per second based on cross-exchange price movements. Liquidity that appears present one second can vanish instantly if market sentiment shifts rapidly, leaving market orders exposed to deeper execution levels than expected.
---
### Risks and Limitations of Order Book Analysis
While order book reading provides valuable operational insights, it is important to recognize its inherent limitations:
* **Incompleteness Across Venues:** Crypto trading is fragmented across dozens of centralized and decentralized exchanges. Examining the order book on a single exchange provides only a partial view of global supply and demand.
* **Over-the-Counter (OTC) Trading:** Massive institutional trades frequently settle off the exchange order books via OTC desks. These transactions do not show up in market depth charts until after execution, if at all.
* **Deceptive Walls:** Large buy or sell walls can be canceled at a millisecond's notice. Assuming a price wall will act as guaranteed support or resistance is a high-risk assumption.
* **Rapid Shifts During Volatility:** During major macroeconomic announcements or sharp market moves, traders frequently pull their limit orders to avoid being caught on the wrong side of a trend. This causes order book depth to evaporate precisely when traders need liquidity the most.
---
### Practical Execution Strategies for Traders
To navigate these challenges, intermediate traders can implement structured operational habits:
1. **Match Order Type to Liquidity:** When trading illiquid assets or placing larger position sizes, default to **Limit Orders** or **Post-Only Orders**. Limit orders guarantee execution price (though not fill probability), eliminating slippage risk.
2. **Utilize Algorithmic Execution Tools:** For substantial positions, consider utilizing execution algorithms such as Time-Weighted Average Price (TWAP) or Volume-Weighted Average Price (VWAP). These tools slice large orders into smaller trades over time, reducing price impact.
3. **Assess Cumulative Depth Before Market Orders:** Always verify the cumulative depth within a reasonable percentage spread (e.g., 1% or 2% depth) rather than looking solely at the top bid and ask prices.
4. **Combine Depth with Volume Indicators:** Pair order book observation with real-time volume indicators and trade flow logs (Time & Sales data) to confirm whether large resting orders are actually being matched and filled.
---
### Final Thoughts
Market depth offers a clear view into the mechanics of price formation. By learning to interpret order books correctly, recognizing the risks of hidden liquidity, and selecting appropriate order types, traders can dramatically reduce execution costs and better assess market conditions. Market depth analysis is not a standalone crystal ball for predicting price movements, but when integrated into a comprehensive trading methodology, it serves as a critical bridge between theoretical analysis and practical execution.
#CryptoEducation #MarketDepth #TradingStrategy
Demystifying Market Depth: How to Read Order Books and Execute Smarter Trades
When most participants enter the cryptocurrency market, their primary focus centers on line or candlestick charts. These visual tools show historical price movements, highlighting where an asset traded minutes, hours, or days ago. However, a price chart only reflects trades that have already occurred. To understand where an asset’s price might move next and how efficiently a trade can be executed, traders must look at real-time supply and demand. This is where market depth and the order book become essential tools.
Understanding market depth allows intermediate market participants to look beneath the surface of price action. It reveals the volume of buy and sell orders resting at different price levels, offering vital clues about market liquidity, potential support and resistance zones, and the risk of execution slippage.
---
### What Is Market Depth?
Market depth refers to a market's ability to absorb large trade orders without causing significant fluctuations in price. It measures the total volume of open, unfilled buy and sell orders at varying price points surrounding the current market price.
A market is considered "deep" when there is a high concentration of pending buy and sell orders on both sides of the ledger. In a deep market, executing a large market order will have a minimal impact on the prevailing price because plenty of liquidity is available to absorb the order. Conversely, a "shallow" or "thin" market lacks sufficient order density. In thin markets, even modest buy or sell orders can cause dramatic price shifts, leading to extreme volatility and unexpected trade costs.
---
### The Anatomy of an Order Book
To comprehend market depth, one must first master the structure of an order book. An order book is an electronic, real-time list of outstanding limit orders placed by buyers and sellers on a central limit order book exchange.
The order book is divided into two primary sections:
1. **Bids (Buy Orders):** Listed on one side (typically green), bids represent buyers who specify the maximum price they are willing to pay for a asset, along with the quantity they wish to purchase. Bids are arranged in descending order, with the highest bid price at the top.
2. **Asks or Offers (Sell Orders):** Listed on the opposing side (typically red), asks represent sellers who specify the minimum price they are willing to accept, along with the quantity they wish to sell. Asks are arranged in ascending order, with the lowest ask price at the top.
The gap between the highest bid price and the lowest ask price is known as the **Bid-Ask Spread**.
#### The Depth Chart
Exchanges often visually represent order book data through a graphic known as a depth chart. This chart plots cumulative order volume on the vertical axis against price on the horizontal axis.
* The **green side** shows the total cumulative buying power moving downward from the current price.
* The **red side** shows the total cumulative selling volume moving upward from the current price.
When you observe a steep, wall-like structure on a depth chart—often referred to as a "buy wall" or "sell wall"—it signifies a large concentration of limit orders at a specific price point. These walls can act as psychological barriers or temporarily absorb incoming orders.
---
### Practical Example: Slippage and Order Execution
Understanding market depth is practical, not just theoretical. It directly impacts execution quality, particularly through a phenomenon known as **slippage**. Slippage occurs when a market order executes at a price different from the expected price at the time the order was submitted.
Consider a hypothetical scenario using a mid-cap digital asset, Token X, trading at $10.00.
Suppose the sell side (asks) of the order book looks like this:
* **Ask Level 1:** 100 units at $10.00
* **Ask Level 2:** 200 units at $10.10
* **Ask Level 3:** 500 units at $10.25
* **Ask Level 4:** 1,000 units at $10.50
Imagine Trader A wants to buy 50 units of Token X using a **Market Order**. Because Level 1 offers 100 units at $10.00, Trader A's order is filled immediately and completely at $10.00. The average execution price is $10.00.
Now, imagine Trader B wants to buy 500 units of Token X using a **Market Order** in the same market state:
1. The first 100 units fill at **$10.00** (cost: $1,000).
2. The next 200 units fill at **$10.10** (cost: $2,020).
3. The remaining 200 units fill at **$10.25** (cost: $2,050).
Trader B spent a total of $5,070 for 500 units, resulting in an average purchase price of **$10.14 per unit**.
Although the asset was quoted at $10.00 on the main ticker, Trader B experienced 1.4% slippage due to insufficient depth at the top of the order book. This example illustrates why checking market depth is critical before executing large market orders, particularly in assets like Ethereum, BNB, or smaller altcoins during periods of low volume.
---
### Advanced Concepts: Spoofing, Icebergs, and Phantom Liquidity
While order books offer valuable transparency, relying on visible market depth comes with caveats. Intermediate traders must recognize that the order book is a dynamic environment where visible data can sometimes be misleading.
#### 1. Iceberg Orders
Institutional participants trading large volumes of assets like Bitcoin often seek to minimize market impact. To do this, they use "iceberg orders." An iceberg order is an automated order split into smaller visible limit orders. Only a tiny fraction (the tip of the iceberg) appears in the public order book. As soon as that fraction is filled, another portion automatically populates. As a result, true market depth may be significantly larger than what is visibly displayed.
#### 2. Order Spoofing
Spoofing is a manipulative practice where a trader places large limit orders (e.g., a massive buy wall) with no intention of letting them fill. The goal is to create a false perception of strong demand, encouraging other market participants to buy. Once price rises slightly, the spoofer cancels the large buy order and sells their inventory into the inflated market. Although prohibited on regulated exchanges, fake liquidity can still occur in fast-moving crypto environments.
#### 3. Algorithmic Cancellation
In modern markets, automated High-Frequency Trading (HFT) bots manage a substantial portion of resting liquidity. These bots can place and cancel thousands of orders per second based on cross-exchange price movements. Liquidity that appears present one second can vanish instantly if market sentiment shifts rapidly, leaving market orders exposed to deeper execution levels than expected.
---
### Risks and Limitations of Order Book Analysis
While order book reading provides valuable operational insights, it is important to recognize its inherent limitations:
* **Incompleteness Across Venues:** Crypto trading is fragmented across dozens of centralized and decentralized exchanges. Examining the order book on a single exchange provides only a partial view of global supply and demand.
* **Over-the-Counter (OTC) Trading:** Massive institutional trades frequently settle off the exchange order books via OTC desks. These transactions do not show up in market depth charts until after execution, if at all.
* **Deceptive Walls:** Large buy or sell walls can be canceled at a millisecond's notice. Assuming a price wall will act as guaranteed support or resistance is a high-risk assumption.
* **Rapid Shifts During Volatility:** During major macroeconomic announcements or sharp market moves, traders frequently pull their limit orders to avoid being caught on the wrong side of a trend. This causes order book depth to evaporate precisely when traders need liquidity the most.
---
### Practical Execution Strategies for Traders
To navigate these challenges, intermediate traders can implement structured operational habits:
1. **Match Order Type to Liquidity:** When trading illiquid assets or placing larger position sizes, default to **Limit Orders** or **Post-Only Orders**. Limit orders guarantee execution price (though not fill probability), eliminating slippage risk.
2. **Utilize Algorithmic Execution Tools:** For substantial positions, consider utilizing execution algorithms such as Time-Weighted Average Price (TWAP) or Volume-Weighted Average Price (VWAP). These tools slice large orders into smaller trades over time, reducing price impact.
3. **Assess Cumulative Depth Before Market Orders:** Always verify the cumulative depth within a reasonable percentage spread (e.g., 1% or 2% depth) rather than looking solely at the top bid and ask prices.
4. **Combine Depth with Volume Indicators:** Pair order book observation with real-time volume indicators and trade flow logs (Time & Sales data) to confirm whether large resting orders are actually being matched and filled.
---
### Final Thoughts
Market depth offers a clear view into the mechanics of price formation. By learning to interpret order books correctly, recognizing the risks of hidden liquidity, and selecting appropriate order types, traders can dramatically reduce execution costs and better assess market conditions. Market depth analysis is not a standalone crystal ball for predicting price movements, but when integrated into a comprehensive trading methodology, it serves as a critical bridge between theoretical analysis and practical execution.
#CryptoEducation #MarketDepth #TradingStrategy
Understanding market depth allows intermediate market participants to look beneath the surface of price action. It reveals the volume of buy and sell orders resting at different price levels, offering vital clues about market liquidity, potential support and resistance zones, and the risk of execution slippage.
---
### What Is Market Depth?
Market depth refers to a market's ability to absorb large trade orders without causing significant fluctuations in price. It measures the total volume of open, unfilled buy and sell orders at varying price points surrounding the current market price.
A market is considered "deep" when there is a high concentration of pending buy and sell orders on both sides of the ledger. In a deep market, executing a large market order will have a minimal impact on the prevailing price because plenty of liquidity is available to absorb the order. Conversely, a "shallow" or "thin" market lacks sufficient order density. In thin markets, even modest buy or sell orders can cause dramatic price shifts, leading to extreme volatility and unexpected trade costs.
---
### The Anatomy of an Order Book
To comprehend market depth, one must first master the structure of an order book. An order book is an electronic, real-time list of outstanding limit orders placed by buyers and sellers on a central limit order book exchange.
The order book is divided into two primary sections:
1. **Bids (Buy Orders):** Listed on one side (typically green), bids represent buyers who specify the maximum price they are willing to pay for a asset, along with the quantity they wish to purchase. Bids are arranged in descending order, with the highest bid price at the top.
2. **Asks or Offers (Sell Orders):** Listed on the opposing side (typically red), asks represent sellers who specify the minimum price they are willing to accept, along with the quantity they wish to sell. Asks are arranged in ascending order, with the lowest ask price at the top.
The gap between the highest bid price and the lowest ask price is known as the **Bid-Ask Spread**.
#### The Depth Chart
Exchanges often visually represent order book data through a graphic known as a depth chart. This chart plots cumulative order volume on the vertical axis against price on the horizontal axis.
* The **green side** shows the total cumulative buying power moving downward from the current price.
* The **red side** shows the total cumulative selling volume moving upward from the current price.
When you observe a steep, wall-like structure on a depth chart—often referred to as a "buy wall" or "sell wall"—it signifies a large concentration of limit orders at a specific price point. These walls can act as psychological barriers or temporarily absorb incoming orders.
---
### Practical Example: Slippage and Order Execution
Understanding market depth is practical, not just theoretical. It directly impacts execution quality, particularly through a phenomenon known as **slippage**. Slippage occurs when a market order executes at a price different from the expected price at the time the order was submitted.
Consider a hypothetical scenario using a mid-cap digital asset, Token X, trading at $10.00.
Suppose the sell side (asks) of the order book looks like this:
* **Ask Level 1:** 100 units at $10.00
* **Ask Level 2:** 200 units at $10.10
* **Ask Level 3:** 500 units at $10.25
* **Ask Level 4:** 1,000 units at $10.50
Imagine Trader A wants to buy 50 units of Token X using a **Market Order**. Because Level 1 offers 100 units at $10.00, Trader A's order is filled immediately and completely at $10.00. The average execution price is $10.00.
Now, imagine Trader B wants to buy 500 units of Token X using a **Market Order** in the same market state:
1. The first 100 units fill at **$10.00** (cost: $1,000).
2. The next 200 units fill at **$10.10** (cost: $2,020).
3. The remaining 200 units fill at **$10.25** (cost: $2,050).
Trader B spent a total of $5,070 for 500 units, resulting in an average purchase price of **$10.14 per unit**.
Although the asset was quoted at $10.00 on the main ticker, Trader B experienced 1.4% slippage due to insufficient depth at the top of the order book. This example illustrates why checking market depth is critical before executing large market orders, particularly in assets like Ethereum, BNB, or smaller altcoins during periods of low volume.
---
### Advanced Concepts: Spoofing, Icebergs, and Phantom Liquidity
While order books offer valuable transparency, relying on visible market depth comes with caveats. Intermediate traders must recognize that the order book is a dynamic environment where visible data can sometimes be misleading.
#### 1. Iceberg Orders
Institutional participants trading large volumes of assets like Bitcoin often seek to minimize market impact. To do this, they use "iceberg orders." An iceberg order is an automated order split into smaller visible limit orders. Only a tiny fraction (the tip of the iceberg) appears in the public order book. As soon as that fraction is filled, another portion automatically populates. As a result, true market depth may be significantly larger than what is visibly displayed.
#### 2. Order Spoofing
Spoofing is a manipulative practice where a trader places large limit orders (e.g., a massive buy wall) with no intention of letting them fill. The goal is to create a false perception of strong demand, encouraging other market participants to buy. Once price rises slightly, the spoofer cancels the large buy order and sells their inventory into the inflated market. Although prohibited on regulated exchanges, fake liquidity can still occur in fast-moving crypto environments.
#### 3. Algorithmic Cancellation
In modern markets, automated High-Frequency Trading (HFT) bots manage a substantial portion of resting liquidity. These bots can place and cancel thousands of orders per second based on cross-exchange price movements. Liquidity that appears present one second can vanish instantly if market sentiment shifts rapidly, leaving market orders exposed to deeper execution levels than expected.
---
### Risks and Limitations of Order Book Analysis
While order book reading provides valuable operational insights, it is important to recognize its inherent limitations:
* **Incompleteness Across Venues:** Crypto trading is fragmented across dozens of centralized and decentralized exchanges. Examining the order book on a single exchange provides only a partial view of global supply and demand.
* **Over-the-Counter (OTC) Trading:** Massive institutional trades frequently settle off the exchange order books via OTC desks. These transactions do not show up in market depth charts until after execution, if at all.
* **Deceptive Walls:** Large buy or sell walls can be canceled at a millisecond's notice. Assuming a price wall will act as guaranteed support or resistance is a high-risk assumption.
* **Rapid Shifts During Volatility:** During major macroeconomic announcements or sharp market moves, traders frequently pull their limit orders to avoid being caught on the wrong side of a trend. This causes order book depth to evaporate precisely when traders need liquidity the most.
---
### Practical Execution Strategies for Traders
To navigate these challenges, intermediate traders can implement structured operational habits:
1. **Match Order Type to Liquidity:** When trading illiquid assets or placing larger position sizes, default to **Limit Orders** or **Post-Only Orders**. Limit orders guarantee execution price (though not fill probability), eliminating slippage risk.
2. **Utilize Algorithmic Execution Tools:** For substantial positions, consider utilizing execution algorithms such as Time-Weighted Average Price (TWAP) or Volume-Weighted Average Price (VWAP). These tools slice large orders into smaller trades over time, reducing price impact.
3. **Assess Cumulative Depth Before Market Orders:** Always verify the cumulative depth within a reasonable percentage spread (e.g., 1% or 2% depth) rather than looking solely at the top bid and ask prices.
4. **Combine Depth with Volume Indicators:** Pair order book observation with real-time volume indicators and trade flow logs (Time & Sales data) to confirm whether large resting orders are actually being matched and filled.
---
### Final Thoughts
Market depth offers a clear view into the mechanics of price formation. By learning to interpret order books correctly, recognizing the risks of hidden liquidity, and selecting appropriate order types, traders can dramatically reduce execution costs and better assess market conditions. Market depth analysis is not a standalone crystal ball for predicting price movements, but when integrated into a comprehensive trading methodology, it serves as a critical bridge between theoretical analysis and practical execution.
#CryptoEducation #MarketDepth #TradingStrategy
94
Artikel
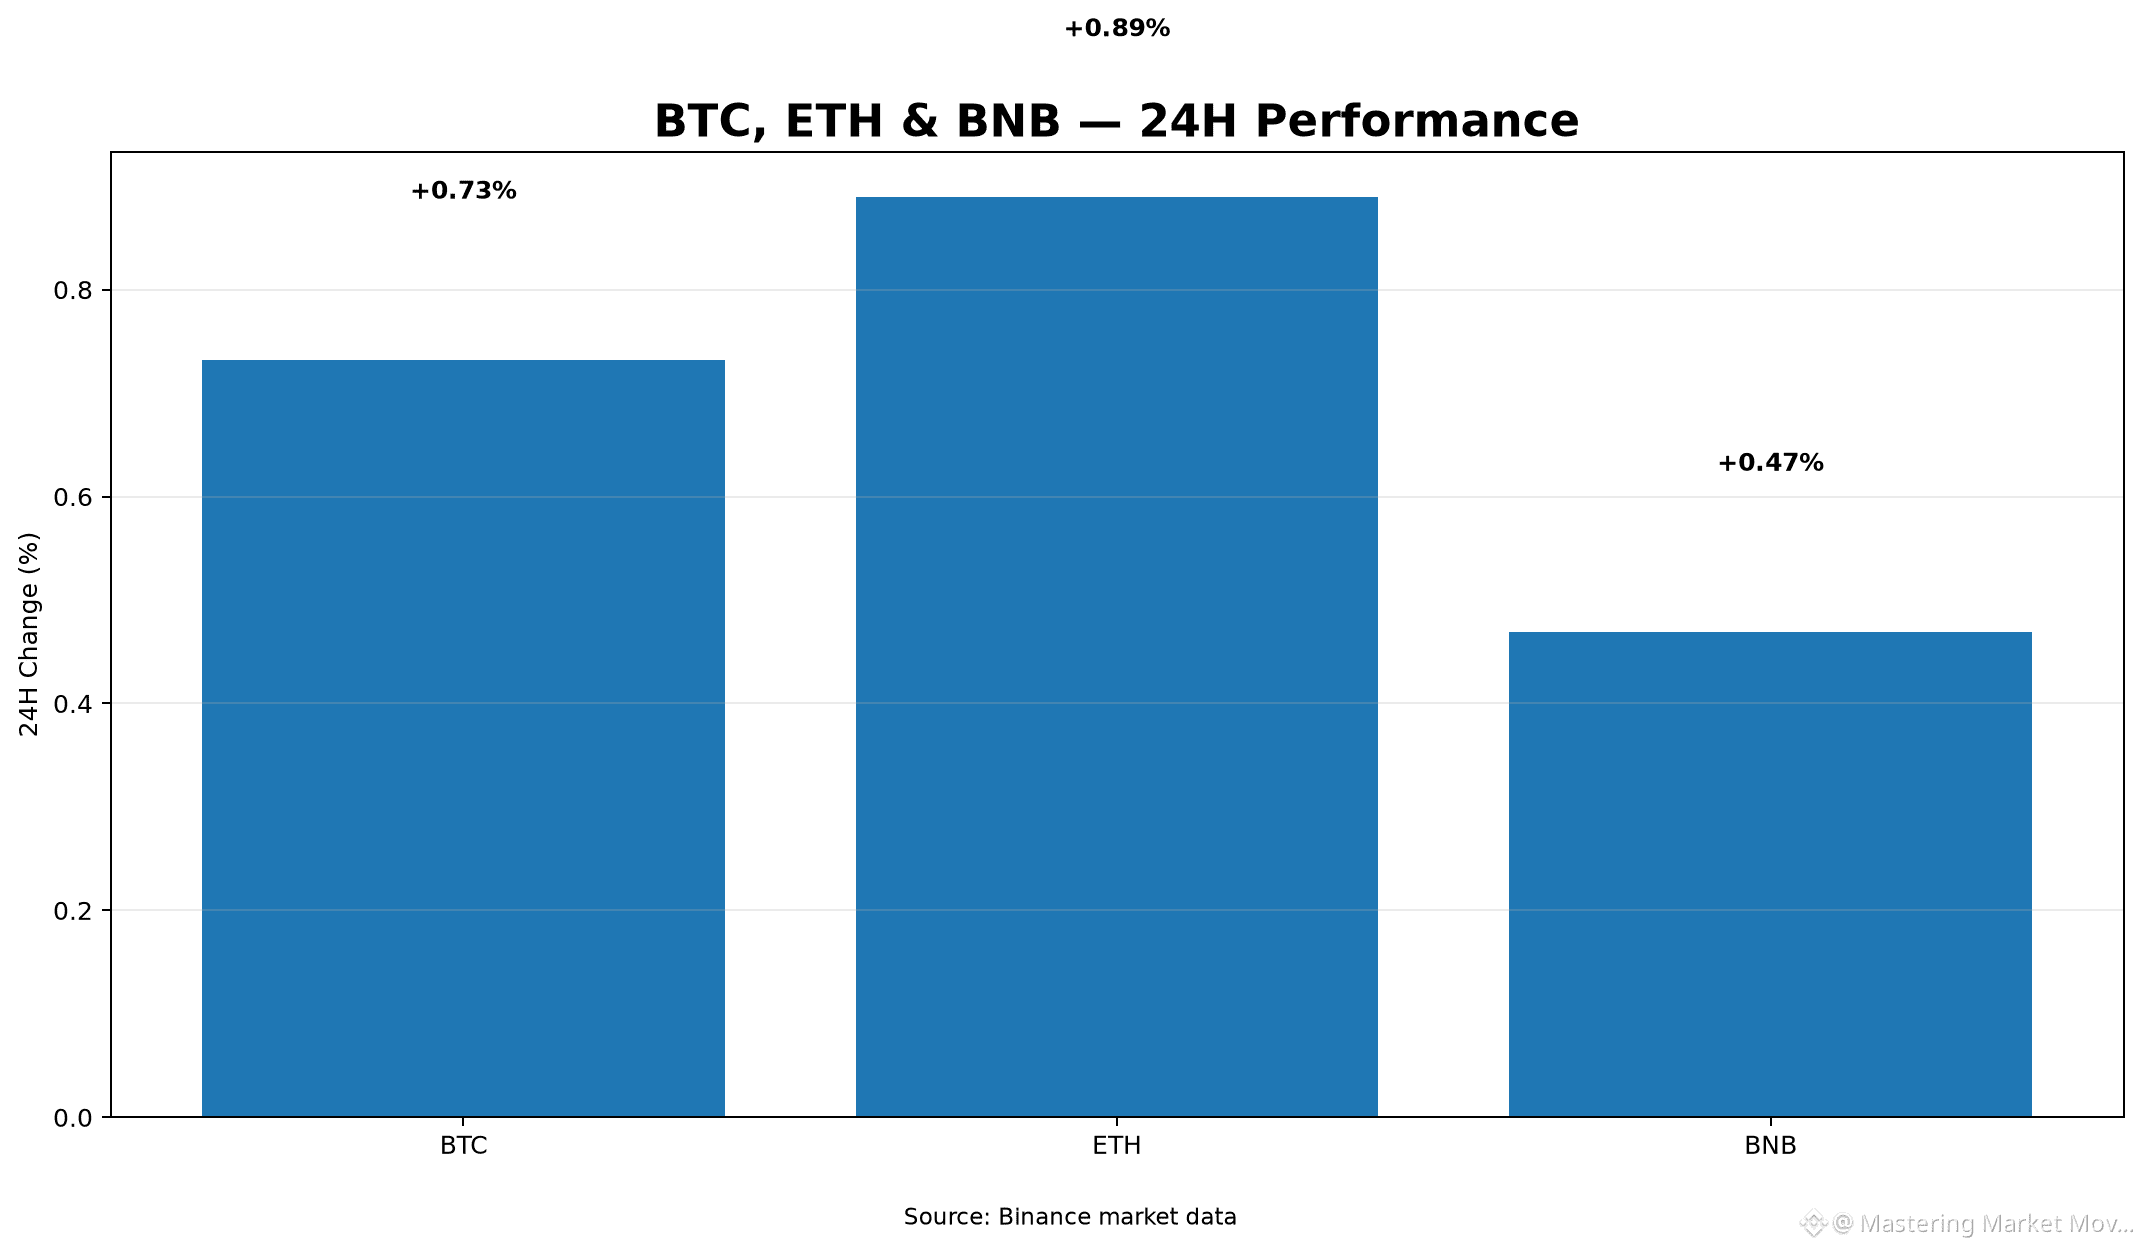
Krypto-Marktübersicht: Tägliche Volatilität und SpannenanalyseIn den letzten 24 Stunden zeigen die wichtigsten digitalen Vermögenswerte durchweg eine moderate positive Dynamik. $BTC wird bei 79.499,99 $ gehandelt, was einem Anstieg von 0,732 % entspricht, während es eine breite 24-Stunden-Spanne zwischen 78.806,0 $ und 82.300,0 $ durchläuft, gestützt von einem erheblichen Quote-Volumen von über 2,03 Milliarden $. Mit der stärksten relativen Stärke legte $ETH um 0,889 % auf 2.455,35 $ zu und verzeichnete dabei ein Tief von 2.430,73 $ und ein Hoch von 2.546,66 $ bei einem Quote-Volumen von 1,25 Milliarden $. Unterdessen verzeichnete $BNB einen moderaten Anstieg von 0,469 % und notiert derzeit bei 716,23 $ mit einer Hoch/Tief-Spanne von 710,52 $ bis 729,90 $ sowie einem Quote-Volumen von 134,68 Millionen $.
Krypto-Marktübersicht: Tägliche Volatilität und Spannenanalyse
In den letzten 24 Stunden zeigen die wichtigsten digitalen Vermögenswerte durchweg eine moderate positive Dynamik. $BTC wird bei 79.499,99 $ gehandelt, was einem Anstieg von 0,732 % entspricht, während es eine breite 24-Stunden-Spanne zwischen 78.806,0 $ und 82.300,0 $ durchläuft, gestützt von einem erheblichen Quote-Volumen von über 2,03 Milliarden $. Mit der stärksten relativen Stärke legte $ETH um 0,889 % auf 2.455,35 $ zu und verzeichnete dabei ein Tief von 2.430,73 $ und ein Hoch von 2.546,66 $ bei einem Quote-Volumen von 1,25 Milliarden $. Unterdessen verzeichnete $BNB einen moderaten Anstieg von 0,469 % und notiert derzeit bei 716,23 $ mit einer Hoch/Tief-Spanne von 710,52 $ bis 729,90 $ sowie einem Quote-Volumen von 134,68 Millionen $.
1
114
Übersetzung ansehen
Crypto Headlines: Standard Chartered UAE Trading, $BTC Tops $80K, UK Brokerage Launches Crypto ETNsHere are the top crypto news stories today:
1. Standard Chartered Launches Institutional Crypto Trading in UAE
- What happened: Banking giant Standard Chartered launched spot crypto trading for institutional clients in the United Arab Emirates.
- Why it matters: Marks a major expansion of traditional banking infrastructure offering direct spot crypto execution in key regulatory hubs.
- Source: Reuters
2. Bitcoin Rallies Past $80,000
- What happened: $BTC crossed the $80,000 threshold as macroeconomic data softened rate hike expectations.
- Why it matters: Drives widespread market optimism and sparks renewed momentum across digital asset products.
- Source: Yahoo Finance
3. Hargreaves Lansdown Offers Crypto ETNs
- What happened: UK investment platform Hargreaves Lansdown began offering crypto ETNs to investors almost a year after regulatory bans were removed.
- Why it matters: Opens up regulated crypto asset exposure to a massive base of UK retail and institutional investors.
- Source: Financial Times
4. Remixpoint Pivots to Bitcoin-Only Treasury Strategy
- What happened: Japan-listed company Remixpoint liquidated its holdings in $ETH and other altcoins to focus solely on Bitcoin.
- Why it matters: Reflects a continuing corporate trend of adopting Bitcoin-centric balance sheet strategies.
- Source: theblock.co
#CryptoNews #Bitcoin #CryptoAdoption
Crypto Headlines: Standard Chartered UAE Trading, $BTC Tops $80K, UK Brokerage Launches Crypto ETNs
Here are the top crypto news stories today:
1. Standard Chartered Launches Institutional Crypto Trading in UAE
- What happened: Banking giant Standard Chartered launched spot crypto trading for institutional clients in the United Arab Emirates.
- Why it matters: Marks a major expansion of traditional banking infrastructure offering direct spot crypto execution in key regulatory hubs.
- Source: Reuters
2. Bitcoin Rallies Past $80,000
- What happened: $BTC crossed the $80,000 threshold as macroeconomic data softened rate hike expectations.
- Why it matters: Drives widespread market optimism and sparks renewed momentum across digital asset products.
- Source: Yahoo Finance
3. Hargreaves Lansdown Offers Crypto ETNs
- What happened: UK investment platform Hargreaves Lansdown began offering crypto ETNs to investors almost a year after regulatory bans were removed.
- Why it matters: Opens up regulated crypto asset exposure to a massive base of UK retail and institutional investors.
- Source: Financial Times
4. Remixpoint Pivots to Bitcoin-Only Treasury Strategy
- What happened: Japan-listed company Remixpoint liquidated its holdings in $ETH and other altcoins to focus solely on Bitcoin.
- Why it matters: Reflects a continuing corporate trend of adopting Bitcoin-centric balance sheet strategies.
- Source: theblock.co
#CryptoNews #Bitcoin #CryptoAdoption
1. Standard Chartered Launches Institutional Crypto Trading in UAE
- What happened: Banking giant Standard Chartered launched spot crypto trading for institutional clients in the United Arab Emirates.
- Why it matters: Marks a major expansion of traditional banking infrastructure offering direct spot crypto execution in key regulatory hubs.
- Source: Reuters
2. Bitcoin Rallies Past $80,000
- What happened: $BTC crossed the $80,000 threshold as macroeconomic data softened rate hike expectations.
- Why it matters: Drives widespread market optimism and sparks renewed momentum across digital asset products.
- Source: Yahoo Finance
3. Hargreaves Lansdown Offers Crypto ETNs
- What happened: UK investment platform Hargreaves Lansdown began offering crypto ETNs to investors almost a year after regulatory bans were removed.
- Why it matters: Opens up regulated crypto asset exposure to a massive base of UK retail and institutional investors.
- Source: Financial Times
4. Remixpoint Pivots to Bitcoin-Only Treasury Strategy
- What happened: Japan-listed company Remixpoint liquidated its holdings in $ETH and other altcoins to focus solely on Bitcoin.
- Why it matters: Reflects a continuing corporate trend of adopting Bitcoin-centric balance sheet strategies.
- Source: theblock.co
#CryptoNews #Bitcoin #CryptoAdoption
121
Übersetzung ansehen
Demystifying Market Depth: How Order Books Shape Price Action and Trade ExecutionWhen trading cryptocurrencies, most beginners focus exclusively on the primary price chart—watching candlesticks move up or down in real time. However, the current spot price displayed on an exchange screen is merely the result of the most recent executed transaction. It tells you where the market was a moment ago, but it reveals very little about how much trading volume the market can handle right now without moving significantly.
To understand how easily an asset's price can move, how orders are filled, and why large transactions sometimes trigger sudden price spikes, traders must look under the hood at market depth.
Market depth is a foundational concept in market structure and liquidity analysis. It reflects an asset's ability to absorb large market orders without experiencing significant, abrupt price changes. In this guide, we will break down what market depth is, how order books function, how to interpret depth charts, and how intermediate traders can use this knowledge to improve trade execution while avoiding common structural pitfalls.
---
### Understanding Order Books and the Bid-Ask Spread
To comprehend market depth, one must first master the structure of an electronic order book. An order book is a real-time, continuously updated list of open limit buy and sell orders for a specific trading pair, organized by price level.
An order book consists of three primary components:
1. **The Bid Side (Buyers):** The bid side displays all active limit buy orders. These represent market participants who want to purchase the asset at a specified price or lower. The highest bid is the best available price for anyone looking to sell immediately.
2. **The Ask Side (Sellers):** The ask side (also known as the offer side) displays all active limit sell orders. These represent participants who want to sell the asset at a specified price or higher. The lowest ask is the best available price for anyone looking to buy immediately.
3. **The Bid-Ask Spread:** The numerical difference between the lowest ask price and the highest bid price is known as the bid-ask spread. In highly liquid markets, this spread is extremely narrow—often just a fraction of a cent or dollar. In illiquid markets, the spread can be wide.
When a trader submits a **market order**, it executes immediately against the best available limit orders resting in the order book. A market buy order sweeps through the ask side starting from the lowest ask price, while a market sell order sweeps through the bid side starting from the highest bid price.
---
### What is Market Depth and Why Does It Matter?
Market depth measures the volume of outstanding limit buy and sell orders at various price levels above and below the current mark price.
If a market has **high depth** (or "deep liquidity"), there are substantial volumes of limit orders residing close to the market price on both sides of the book. In such an environment, a trader can execute a large market order with minimal impact on the overall price.
Conversely, if a market has **shallow depth**, even a relatively modest market order can exhaust the available limit orders at the top level of the order book and force execution into higher or lower price tiers. This difference between the expected execution price and the actual executed price is known as **slippage**.
#### A Practical Example of Slippage and Depth
Imagine a scenario where the current displayed price of Bitcoin on an exchange is $60,000. A trader wants to purchase 10 Bitcoin immediately using a market buy order.
Suppose the order book's ask side looks like this:
* **Level 1:** 2 Bitcoin available at $60,000
* **Level 2:** 3 Bitcoin available at $60,050
* **Level 3:** 5 Bitcoin available at $60,100
When the market buy order for 10 Bitcoin is placed, the exchange order matching engine fills it progressively across available liquidity:
* 2 Bitcoin are bought at $60,000 (Cost: $120,000)
* 3 Bitcoin are bought at $60,050 (Cost: $180,150)
* 5 Bitcoin are bought at $60,100 (Cost: $300,500)
The total expenditure to acquire 10 Bitcoin is $600,650. The effective average purchase price per Bitcoin becomes **$60,065**, rather than the initial mark price of $60,000. The $65 per unit average difference is the direct result of consuming available market depth across multiple price tiers.
---
### Reading Depth Charts and Spotting "Order Walls"
Most visual trading interfaces provide a **Depth Chart** alongside traditional candlestick charts. A depth chart plots cumulative order volume on the Y-axis against price on the X-axis, divided into two colored regions: green for buy orders (bids) and red for sell orders (asks).
* **The Mid-Price:** The center point where the green and red shapes meet represents the current mid-market price.
* **Slope and Volume:** A shallow, gradual slope indicates that limit orders are distributed evenly across price levels. A steep, vertical wall indicates a heavy concentration of limit orders at a single price point.
#### Buy Walls and Sell Walls
* **Buy Wall:** A buy wall occurs when a massive limit buy order (or a dense cluster of orders) rests at a specific price level below the market price. On a depth chart, this appears as a tall green vertical step. Traders often view large buy walls as potential temporary support levels, as price cannot drop further until that entire aggregate buy volume is filled.
* **Sell Wall:** A sell wall occurs when a massive limit sell order rests at a price level above the current market price, appearing as a tall red vertical step. Sell walls represent potential short-term resistance, as buying pressure must absorb all that inventory before price can advance higher.
---
### The Role of Market Makers in Maintaining Depth
Where does market depth actually come from? While individual retail traders contribute limit orders, the bulk of market depth in modern digital asset markets is provided by **Market Makers**.
Market makers are specialized institutional entities or automated high-frequency trading algorithms that continuously place limit buy and limit sell orders on both sides of the book. Their primary objective is to earn small profits from the bid-ask spread while capturing exchange rebates for supplying liquidity.
Market makers play critical roles in market stability:
* **Reducing Slippage:** By placing orders at close intervals, market makers cushion the impact of incoming market orders.
* **Maintaining Efficiency:** Automated market maker bots continuously cross-reference prices across multiple exchanges. If Bitcoin trades at $60,000 on Exchange A and $60,100 on Exchange B, arbitrage algorithms buy on Exchange A and sell on Exchange B, quickly keeping prices and depth synchronized across global venues.
---
### Risks, Limitations, and Manipulative Tactics
While monitoring market depth provides valuable insights into order flow, relying strictly on visible order book data carries distinct risks and limitations:
1. **Spoofing and Fake Depth:** Limit orders are non-binding until filled and can be canceled instantly. Predatory traders sometimes place massive limit orders (e.g., a huge fake buy wall) to manipulate market sentiment and trick retail traders into buying, only to cancel the wall before price reaches it. This illegal tactic is known as spoofing.
2. **Iceberg Orders:** Institutional traders looking to move large positions often use "iceberg orders." These are algorithmic orders split into smaller displayed tranches. For instance, an institutional seller might place an order for 500 Ethereum, but only display 5 Ethereum at a time in the public order book. Once one tranche fills, the next automatically populates. Consequently, real market depth may be significantly larger than what is visible on screen.
3. **Off-Exchange Liquidity (OTC Desks):** Massive trades executed by institutions rarely go through public spot order books to prevent market impact. Instead, they occur Over-The-Counter (OTC). Therefore, exchange depth charts do not reflect total global supply and demand.
4. **Dynamic Liquidity Withdrawal:** During periods of sharp market volatility or macroeconomic announcements, market-making algorithms frequently cancel their limit orders in real time to avoid severe losses. As a result, order book depth can evaporate in milliseconds, leaving the market vulnerable to sharp slippage right when liquidity is needed most.
---
### Practical Execution Strategies for Traders
Understanding order book dynamics allows intermediate traders to make smarter execution decisions:
* **Match Order Types to Market Depth:** For major assets like Bitcoin or Ethereum on high-volume platforms, market orders may experience negligible slippage for small position sizes. However, for lower-capitalization altcoins with shallow order books, traders should rely primarily on **limit orders** or continuous execution algorithms (such as TWAP) to maintain price control.
* **Verify Walls Before Assuming Support:** Do not assume a buy or sell wall will hold as support or resistance simply because it appears on a depth chart. Observe how the wall behaves as price approaches: if the order volume rapidly shrinks or disappears entirely, it may have been a temporary or manipulative wall.
* **Account for Fee Structures:** Exchanges often charge lower fees to "makers" (those who add limit orders to the book) than to "takers" (those who remove orders with market orders). Using limit orders to add depth not only prevents slippage but can also lower transaction costs over time.
---
### Conclusion
Market depth offers a clear window into the real-time mechanics of asset pricing and trading volume distribution. By learning to interpret order books and depth charts, intermediate traders can better evaluate market structure, minimize execution costs, and recognize the structural realities behind rapid price moves.
However, order book analysis should never be viewed as an isolated forecasting tool. Because limit orders can be modified, canceled, or hidden within fractions of a second, market depth analysis must always be paired with prudent risk management, realistic positioning, and a broader analysis of market context.
#CryptoTrading #MarketDepth #OrderBook
Demystifying Market Depth: How Order Books Shape Price Action and Trade Execution
When trading cryptocurrencies, most beginners focus exclusively on the primary price chart—watching candlesticks move up or down in real time. However, the current spot price displayed on an exchange screen is merely the result of the most recent executed transaction. It tells you where the market was a moment ago, but it reveals very little about how much trading volume the market can handle right now without moving significantly.
To understand how easily an asset's price can move, how orders are filled, and why large transactions sometimes trigger sudden price spikes, traders must look under the hood at market depth.
Market depth is a foundational concept in market structure and liquidity analysis. It reflects an asset's ability to absorb large market orders without experiencing significant, abrupt price changes. In this guide, we will break down what market depth is, how order books function, how to interpret depth charts, and how intermediate traders can use this knowledge to improve trade execution while avoiding common structural pitfalls.
---
### Understanding Order Books and the Bid-Ask Spread
To comprehend market depth, one must first master the structure of an electronic order book. An order book is a real-time, continuously updated list of open limit buy and sell orders for a specific trading pair, organized by price level.
An order book consists of three primary components:
1. **The Bid Side (Buyers):** The bid side displays all active limit buy orders. These represent market participants who want to purchase the asset at a specified price or lower. The highest bid is the best available price for anyone looking to sell immediately.
2. **The Ask Side (Sellers):** The ask side (also known as the offer side) displays all active limit sell orders. These represent participants who want to sell the asset at a specified price or higher. The lowest ask is the best available price for anyone looking to buy immediately.
3. **The Bid-Ask Spread:** The numerical difference between the lowest ask price and the highest bid price is known as the bid-ask spread. In highly liquid markets, this spread is extremely narrow—often just a fraction of a cent or dollar. In illiquid markets, the spread can be wide.
When a trader submits a **market order**, it executes immediately against the best available limit orders resting in the order book. A market buy order sweeps through the ask side starting from the lowest ask price, while a market sell order sweeps through the bid side starting from the highest bid price.
---
### What is Market Depth and Why Does It Matter?
Market depth measures the volume of outstanding limit buy and sell orders at various price levels above and below the current mark price.
If a market has **high depth** (or "deep liquidity"), there are substantial volumes of limit orders residing close to the market price on both sides of the book. In such an environment, a trader can execute a large market order with minimal impact on the overall price.
Conversely, if a market has **shallow depth**, even a relatively modest market order can exhaust the available limit orders at the top level of the order book and force execution into higher or lower price tiers. This difference between the expected execution price and the actual executed price is known as **slippage**.
#### A Practical Example of Slippage and Depth
Imagine a scenario where the current displayed price of Bitcoin on an exchange is $60,000. A trader wants to purchase 10 Bitcoin immediately using a market buy order.
Suppose the order book's ask side looks like this:
* **Level 1:** 2 Bitcoin available at $60,000
* **Level 2:** 3 Bitcoin available at $60,050
* **Level 3:** 5 Bitcoin available at $60,100
When the market buy order for 10 Bitcoin is placed, the exchange order matching engine fills it progressively across available liquidity:
* 2 Bitcoin are bought at $60,000 (Cost: $120,000)
* 3 Bitcoin are bought at $60,050 (Cost: $180,150)
* 5 Bitcoin are bought at $60,100 (Cost: $300,500)
The total expenditure to acquire 10 Bitcoin is $600,650. The effective average purchase price per Bitcoin becomes **$60,065**, rather than the initial mark price of $60,000. The $65 per unit average difference is the direct result of consuming available market depth across multiple price tiers.
---
### Reading Depth Charts and Spotting "Order Walls"
Most visual trading interfaces provide a **Depth Chart** alongside traditional candlestick charts. A depth chart plots cumulative order volume on the Y-axis against price on the X-axis, divided into two colored regions: green for buy orders (bids) and red for sell orders (asks).
* **The Mid-Price:** The center point where the green and red shapes meet represents the current mid-market price.
* **Slope and Volume:** A shallow, gradual slope indicates that limit orders are distributed evenly across price levels. A steep, vertical wall indicates a heavy concentration of limit orders at a single price point.
#### Buy Walls and Sell Walls
* **Buy Wall:** A buy wall occurs when a massive limit buy order (or a dense cluster of orders) rests at a specific price level below the market price. On a depth chart, this appears as a tall green vertical step. Traders often view large buy walls as potential temporary support levels, as price cannot drop further until that entire aggregate buy volume is filled.
* **Sell Wall:** A sell wall occurs when a massive limit sell order rests at a price level above the current market price, appearing as a tall red vertical step. Sell walls represent potential short-term resistance, as buying pressure must absorb all that inventory before price can advance higher.
---
### The Role of Market Makers in Maintaining Depth
Where does market depth actually come from? While individual retail traders contribute limit orders, the bulk of market depth in modern digital asset markets is provided by **Market Makers**.
Market makers are specialized institutional entities or automated high-frequency trading algorithms that continuously place limit buy and limit sell orders on both sides of the book. Their primary objective is to earn small profits from the bid-ask spread while capturing exchange rebates for supplying liquidity.
Market makers play critical roles in market stability:
* **Reducing Slippage:** By placing orders at close intervals, market makers cushion the impact of incoming market orders.
* **Maintaining Efficiency:** Automated market maker bots continuously cross-reference prices across multiple exchanges. If Bitcoin trades at $60,000 on Exchange A and $60,100 on Exchange B, arbitrage algorithms buy on Exchange A and sell on Exchange B, quickly keeping prices and depth synchronized across global venues.
---
### Risks, Limitations, and Manipulative Tactics
While monitoring market depth provides valuable insights into order flow, relying strictly on visible order book data carries distinct risks and limitations:
1. **Spoofing and Fake Depth:** Limit orders are non-binding until filled and can be canceled instantly. Predatory traders sometimes place massive limit orders (e.g., a huge fake buy wall) to manipulate market sentiment and trick retail traders into buying, only to cancel the wall before price reaches it. This illegal tactic is known as spoofing.
2. **Iceberg Orders:** Institutional traders looking to move large positions often use "iceberg orders." These are algorithmic orders split into smaller displayed tranches. For instance, an institutional seller might place an order for 500 Ethereum, but only display 5 Ethereum at a time in the public order book. Once one tranche fills, the next automatically populates. Consequently, real market depth may be significantly larger than what is visible on screen.
3. **Off-Exchange Liquidity (OTC Desks):** Massive trades executed by institutions rarely go through public spot order books to prevent market impact. Instead, they occur Over-The-Counter (OTC). Therefore, exchange depth charts do not reflect total global supply and demand.
4. **Dynamic Liquidity Withdrawal:** During periods of sharp market volatility or macroeconomic announcements, market-making algorithms frequently cancel their limit orders in real time to avoid severe losses. As a result, order book depth can evaporate in milliseconds, leaving the market vulnerable to sharp slippage right when liquidity is needed most.
---
### Practical Execution Strategies for Traders
Understanding order book dynamics allows intermediate traders to make smarter execution decisions:
* **Match Order Types to Market Depth:** For major assets like Bitcoin or Ethereum on high-volume platforms, market orders may experience negligible slippage for small position sizes. However, for lower-capitalization altcoins with shallow order books, traders should rely primarily on **limit orders** or continuous execution algorithms (such as TWAP) to maintain price control.
* **Verify Walls Before Assuming Support:** Do not assume a buy or sell wall will hold as support or resistance simply because it appears on a depth chart. Observe how the wall behaves as price approaches: if the order volume rapidly shrinks or disappears entirely, it may have been a temporary or manipulative wall.
* **Account for Fee Structures:** Exchanges often charge lower fees to "makers" (those who add limit orders to the book) than to "takers" (those who remove orders with market orders). Using limit orders to add depth not only prevents slippage but can also lower transaction costs over time.
---
### Conclusion
Market depth offers a clear window into the real-time mechanics of asset pricing and trading volume distribution. By learning to interpret order books and depth charts, intermediate traders can better evaluate market structure, minimize execution costs, and recognize the structural realities behind rapid price moves.
However, order book analysis should never be viewed as an isolated forecasting tool. Because limit orders can be modified, canceled, or hidden within fractions of a second, market depth analysis must always be paired with prudent risk management, realistic positioning, and a broader analysis of market context.
#CryptoTrading #MarketDepth #OrderBook
To understand how easily an asset's price can move, how orders are filled, and why large transactions sometimes trigger sudden price spikes, traders must look under the hood at market depth.
Market depth is a foundational concept in market structure and liquidity analysis. It reflects an asset's ability to absorb large market orders without experiencing significant, abrupt price changes. In this guide, we will break down what market depth is, how order books function, how to interpret depth charts, and how intermediate traders can use this knowledge to improve trade execution while avoiding common structural pitfalls.
---
### Understanding Order Books and the Bid-Ask Spread
To comprehend market depth, one must first master the structure of an electronic order book. An order book is a real-time, continuously updated list of open limit buy and sell orders for a specific trading pair, organized by price level.
An order book consists of three primary components:
1. **The Bid Side (Buyers):** The bid side displays all active limit buy orders. These represent market participants who want to purchase the asset at a specified price or lower. The highest bid is the best available price for anyone looking to sell immediately.
2. **The Ask Side (Sellers):** The ask side (also known as the offer side) displays all active limit sell orders. These represent participants who want to sell the asset at a specified price or higher. The lowest ask is the best available price for anyone looking to buy immediately.
3. **The Bid-Ask Spread:** The numerical difference between the lowest ask price and the highest bid price is known as the bid-ask spread. In highly liquid markets, this spread is extremely narrow—often just a fraction of a cent or dollar. In illiquid markets, the spread can be wide.
When a trader submits a **market order**, it executes immediately against the best available limit orders resting in the order book. A market buy order sweeps through the ask side starting from the lowest ask price, while a market sell order sweeps through the bid side starting from the highest bid price.
---
### What is Market Depth and Why Does It Matter?
Market depth measures the volume of outstanding limit buy and sell orders at various price levels above and below the current mark price.
If a market has **high depth** (or "deep liquidity"), there are substantial volumes of limit orders residing close to the market price on both sides of the book. In such an environment, a trader can execute a large market order with minimal impact on the overall price.
Conversely, if a market has **shallow depth**, even a relatively modest market order can exhaust the available limit orders at the top level of the order book and force execution into higher or lower price tiers. This difference between the expected execution price and the actual executed price is known as **slippage**.
#### A Practical Example of Slippage and Depth
Imagine a scenario where the current displayed price of Bitcoin on an exchange is $60,000. A trader wants to purchase 10 Bitcoin immediately using a market buy order.
Suppose the order book's ask side looks like this:
* **Level 1:** 2 Bitcoin available at $60,000
* **Level 2:** 3 Bitcoin available at $60,050
* **Level 3:** 5 Bitcoin available at $60,100
When the market buy order for 10 Bitcoin is placed, the exchange order matching engine fills it progressively across available liquidity:
* 2 Bitcoin are bought at $60,000 (Cost: $120,000)
* 3 Bitcoin are bought at $60,050 (Cost: $180,150)
* 5 Bitcoin are bought at $60,100 (Cost: $300,500)
The total expenditure to acquire 10 Bitcoin is $600,650. The effective average purchase price per Bitcoin becomes **$60,065**, rather than the initial mark price of $60,000. The $65 per unit average difference is the direct result of consuming available market depth across multiple price tiers.
---
### Reading Depth Charts and Spotting "Order Walls"
Most visual trading interfaces provide a **Depth Chart** alongside traditional candlestick charts. A depth chart plots cumulative order volume on the Y-axis against price on the X-axis, divided into two colored regions: green for buy orders (bids) and red for sell orders (asks).
* **The Mid-Price:** The center point where the green and red shapes meet represents the current mid-market price.
* **Slope and Volume:** A shallow, gradual slope indicates that limit orders are distributed evenly across price levels. A steep, vertical wall indicates a heavy concentration of limit orders at a single price point.
#### Buy Walls and Sell Walls
* **Buy Wall:** A buy wall occurs when a massive limit buy order (or a dense cluster of orders) rests at a specific price level below the market price. On a depth chart, this appears as a tall green vertical step. Traders often view large buy walls as potential temporary support levels, as price cannot drop further until that entire aggregate buy volume is filled.
* **Sell Wall:** A sell wall occurs when a massive limit sell order rests at a price level above the current market price, appearing as a tall red vertical step. Sell walls represent potential short-term resistance, as buying pressure must absorb all that inventory before price can advance higher.
---
### The Role of Market Makers in Maintaining Depth
Where does market depth actually come from? While individual retail traders contribute limit orders, the bulk of market depth in modern digital asset markets is provided by **Market Makers**.
Market makers are specialized institutional entities or automated high-frequency trading algorithms that continuously place limit buy and limit sell orders on both sides of the book. Their primary objective is to earn small profits from the bid-ask spread while capturing exchange rebates for supplying liquidity.
Market makers play critical roles in market stability:
* **Reducing Slippage:** By placing orders at close intervals, market makers cushion the impact of incoming market orders.
* **Maintaining Efficiency:** Automated market maker bots continuously cross-reference prices across multiple exchanges. If Bitcoin trades at $60,000 on Exchange A and $60,100 on Exchange B, arbitrage algorithms buy on Exchange A and sell on Exchange B, quickly keeping prices and depth synchronized across global venues.
---
### Risks, Limitations, and Manipulative Tactics
While monitoring market depth provides valuable insights into order flow, relying strictly on visible order book data carries distinct risks and limitations:
1. **Spoofing and Fake Depth:** Limit orders are non-binding until filled and can be canceled instantly. Predatory traders sometimes place massive limit orders (e.g., a huge fake buy wall) to manipulate market sentiment and trick retail traders into buying, only to cancel the wall before price reaches it. This illegal tactic is known as spoofing.
2. **Iceberg Orders:** Institutional traders looking to move large positions often use "iceberg orders." These are algorithmic orders split into smaller displayed tranches. For instance, an institutional seller might place an order for 500 Ethereum, but only display 5 Ethereum at a time in the public order book. Once one tranche fills, the next automatically populates. Consequently, real market depth may be significantly larger than what is visible on screen.
3. **Off-Exchange Liquidity (OTC Desks):** Massive trades executed by institutions rarely go through public spot order books to prevent market impact. Instead, they occur Over-The-Counter (OTC). Therefore, exchange depth charts do not reflect total global supply and demand.
4. **Dynamic Liquidity Withdrawal:** During periods of sharp market volatility or macroeconomic announcements, market-making algorithms frequently cancel their limit orders in real time to avoid severe losses. As a result, order book depth can evaporate in milliseconds, leaving the market vulnerable to sharp slippage right when liquidity is needed most.
---
### Practical Execution Strategies for Traders
Understanding order book dynamics allows intermediate traders to make smarter execution decisions:
* **Match Order Types to Market Depth:** For major assets like Bitcoin or Ethereum on high-volume platforms, market orders may experience negligible slippage for small position sizes. However, for lower-capitalization altcoins with shallow order books, traders should rely primarily on **limit orders** or continuous execution algorithms (such as TWAP) to maintain price control.
* **Verify Walls Before Assuming Support:** Do not assume a buy or sell wall will hold as support or resistance simply because it appears on a depth chart. Observe how the wall behaves as price approaches: if the order volume rapidly shrinks or disappears entirely, it may have been a temporary or manipulative wall.
* **Account for Fee Structures:** Exchanges often charge lower fees to "makers" (those who add limit orders to the book) than to "takers" (those who remove orders with market orders). Using limit orders to add depth not only prevents slippage but can also lower transaction costs over time.
---
### Conclusion
Market depth offers a clear window into the real-time mechanics of asset pricing and trading volume distribution. By learning to interpret order books and depth charts, intermediate traders can better evaluate market structure, minimize execution costs, and recognize the structural realities behind rapid price moves.
However, order book analysis should never be viewed as an isolated forecasting tool. Because limit orders can be modified, canceled, or hidden within fractions of a second, market depth analysis must always be paired with prudent risk management, realistic positioning, and a broader analysis of market context.
#CryptoTrading #MarketDepth #OrderBook
104
Übersetzung ansehen
Crypto News Digest: Corporate ETH Holdings, Sberbank Crypto Loans, and South Korean Market ActivityHere are today's top crypto news updates:
1. Bitmine Purchases $131M in $ETH
• What happened: Bitmine Immersion Technologies acquired $131 million worth of Ethereum in its largest purchase since June, bringing its total holdings to 5.90 million ETH tokens.
• Why it matters: Shows ongoing corporate treasury accumulation of major crypto assets.
• Source: CoinDesk
2. Sberbank Prepares Crypto-Collateralized Loans
• What happened: Russia's Sberbank recorded $46 billion in crypto trading volume and announced plans to introduce loan products backed by $ETH and USDT.
• Why it matters: Signals expanding commercial bank adoption of crypto assets for credit products.
• Source: Decrypt
3. South Korean 'Kimchi Premium' Resurfaces
• What happened: The $BTC Kimchi Premium returned as trading activity picked up across South Korean crypto exchanges.
• Why it matters: Indicates a resurgence in regional retail demand and market sentiment in Asia.
• Source: Bloomberg
#CryptoNews #Ethereum #Bitcoin
Crypto News Digest: Corporate ETH Holdings, Sberbank Crypto Loans, and South Korean Market Activity
Here are today's top crypto news updates:
1. Bitmine Purchases $131M in $ETH
• What happened: Bitmine Immersion Technologies acquired $131 million worth of Ethereum in its largest purchase since June, bringing its total holdings to 5.90 million ETH tokens.
• Why it matters: Shows ongoing corporate treasury accumulation of major crypto assets.
• Source: CoinDesk
2. Sberbank Prepares Crypto-Collateralized Loans
• What happened: Russia's Sberbank recorded $46 billion in crypto trading volume and announced plans to introduce loan products backed by $ETH and USDT.
• Why it matters: Signals expanding commercial bank adoption of crypto assets for credit products.
• Source: Decrypt
3. South Korean 'Kimchi Premium' Resurfaces
• What happened: The $BTC Kimchi Premium returned as trading activity picked up across South Korean crypto exchanges.
• Why it matters: Indicates a resurgence in regional retail demand and market sentiment in Asia.
• Source: Bloomberg
#CryptoNews #Ethereum #Bitcoin
1. Bitmine Purchases $131M in $ETH
• What happened: Bitmine Immersion Technologies acquired $131 million worth of Ethereum in its largest purchase since June, bringing its total holdings to 5.90 million ETH tokens.
• Why it matters: Shows ongoing corporate treasury accumulation of major crypto assets.
• Source: CoinDesk
2. Sberbank Prepares Crypto-Collateralized Loans
• What happened: Russia's Sberbank recorded $46 billion in crypto trading volume and announced plans to introduce loan products backed by $ETH and USDT.
• Why it matters: Signals expanding commercial bank adoption of crypto assets for credit products.
• Source: Decrypt
3. South Korean 'Kimchi Premium' Resurfaces
• What happened: The $BTC Kimchi Premium returned as trading activity picked up across South Korean crypto exchanges.
• Why it matters: Indicates a resurgence in regional retail demand and market sentiment in Asia.
• Source: Bloomberg
#CryptoNews #Ethereum #Bitcoin
125
Übersetzung ansehen
Demystifying Market Depth: How Order Books Drive Crypto Execution and Price StabilityWhen observing cryptocurrency markets, most market participants focus primarily on the candlestick chart. They watch the price tick up or down, tracking resistance levels, support channels, and moving averages. However, a standard price chart only displays historical transactions—the record of where buyers and sellers previously agreed on value. It does not explicitly show the pending supply and demand sitting quietly behind the scenes.
To truly understand price movement, execution efficiency, and market fragility, one must look at market depth. Market depth provides a real-time window into the order book, detailing the volume of buy and sell limit orders waiting to be filled at various price levels. For intermediate traders and market participants, mastering the concepts of market depth is essential for minimizing execution costs, identifying potential manipulation, and gauging true market liquidity.
---
### What Is Market Depth?
At its core, market depth measures a market's ability to absorb relatively large market orders without causing significant price shifts. It reflects the overall volume of open limit orders placed on an exchange's central limit order book (CLOB).
In any standard exchange interface, the order book is split into two primary components:
1. **Bids (Buy Orders):** Located below the current market price, bids represent buyers willing to purchase an asset at a specified price or lower.
2. **Asks (Sell Orders or Offers):** Located above the current market price, asks represent sellers willing to part with their asset at a specified price or higher.
The difference between the lowest ask price and the highest bid price is known as the **bid-ask spread**.
Market depth visualizes how many units of an asset are queued up across price ticks on both the bid side and the ask side. A market is considered "deep" if there are substantial buy and sell orders close to the mid-price. Conversely, a market is considered "shallow" or "thin" if only a few small orders exist near the current trading price.
---
### Anatomy of the Order Book and Depth Chart
To visualize market depth, trading platforms often use a cumulative depth chart. This chart features price on the horizontal axis and cumulative order volume on the vertical axis.
* **The Bid Side (Green):** Slopes downward to the left. It accumulates the total volume of buy orders as price levels decrease from the current mark price.
* **The Ask Side (Red):** Slopes upward to the right. It accumulates the total volume of sell orders as price levels increase from the current mark price.
#### Buy Walls and Sell Walls
When viewing a depth chart, you may notice sharp, steep vertical steps. These are commonly referred to as "walls."
* **A Buy Wall** occurs when a single buyer or a group of buyers places a massive limit order at a specific price level below the current price. It acts as a potential support line because market sellers must fill all the volume within that wall before the price can drop lower.
* **A Sell Wall** occurs when a large limit sell order is placed at a specific price level above the current price. It acts as potential overhead resistance because market buyers must consume all the liquidity at that level before the price can move higher.
While walls appear to show strong support or resistance, intermediate market participants must approach them with caution. Unlike completed trades, unfilled limit orders can be canceled instantly by automated trading systems before price ever reaches them.
---
### Critical Metrics Derived from Market Depth
Understanding market depth requires analyzing specific metrics that quantify how easily orders can be executed.
#### 1. Slippage and Price Impact
Market orders prioritize speed of execution over price. When a trader places a large market buy order, the exchange engine fills the order against the lowest available ask. If the order size exceeds the volume available at the top of the order book, the engine automatically walks up the book, filling remaining portions of the order at progressively higher ask prices.
The difference between the expected execution price (the price visible when the order was submitted) and the actual average filled price is known as **slippage**. Deep market depth minimizes slippage, whereas thin market depth leads to high slippage and severe price impact.
#### 2. The 2% Market Depth Standard
Institutional participants and analytics platforms rarely rely solely on total order book volume, as orders placed 50% away from the current price have little relevance to immediate trading conditions. Instead, they monitor **2% Market Depth**.
This metric calculates the cumulative fiat value of bids and asks sitting within 2% above and below the current mid-price. For major digital assets like Bitcoin and Ethereum, 2% market depth often runs into tens of millions of dollars across top exchanges. For lower-capitalization tokens, 2% market depth might be only a few thousand dollars, rendering them highly vulnerable to sudden volatility caused by modest orders.
#### 3. Bid-Ask Spread Dynamics
The spread itself is a direct reflection of market depth and market-maker risk perception:
* **Tight Spreads:** Indicate high liquidity, dense order depth, and competitive market-making. Trades execute close to market valuation.
* **Wide Spreads:** Indicate low liquidity, sparse order depth, or heightened uncertainty (such as during major macroeconomic announcements), leading market makers to demand a higher risk premium.
---
### Practical Applications in Crypto Trading
Understanding depth allows market participants to move beyond basic chart patterns and make informed operational decisions:
* **Optimizing Order Execution:** If an investor intends to rebalance a portfolio position, inspecting market depth helps determine whether to use market orders, limit orders, or algorithmic execution strategies like Time-Weighted Average Price (TWAP). Placing a single large market order into a shallow book can instantly cause self-inflicted slippage losses.
* **Evaluating Token Fragility:** Market capitalization alone can be misleading. A token may sport a billion-dollar market cap based on circulating supply multiplied by the last trade price, but possess only $50,000 in 2% market depth. Market depth reveals the true capital required to move a token's price up or down.
* **Assessing Liquidity Fragmentation:** Cryptocurrency trading is spread across numerous centralized and decentralized venues. Analyzing market depth across different platforms helps participants identify where real liquidity resides versus venues with inflated reporting or hollow books.
---
### Risks, Manipulations, and Limitations
While market depth provides invaluable insights, relying on it blindly carries distinct risks. The order book is a dynamic environment subject to strategic maneuvering by sophisticated actors.
#### Spoofing and Phantom Liquidity
Spoofing occurs when traders place large, visible limit orders with no intention of executing them. The goal is to create a false impression of heavy buying support or selling pressure, deceiving other market participants into trading in a specific direction. Once price approaches the fake wall, the orders are instantly canceled using high-frequency APIs.
#### Hidden and Iceberg Orders
Not all depth is visible on the public order book. Institutions frequently utilize **iceberg orders**, which split a massive order into small visible tranches. As each visible tranche fills, another is automatically posted. Therefore, a price level that appears thin on the depth chart may actually contain substantial hidden liquidity.
#### Decentralized Automated Market Makers (AMMs)
Market depth mechanics differ substantially between traditional centralized order books and Decentralized Finance (DeFi) protocols using Constant Product Automated Market Makers (e.g., $x \times y = k$). On AMMs, depth is determined by liquidity pool balances rather than pending limit orders. Slippage on AMMs follows a deterministic mathematical curve rather than an aggregated list of individual limit prices.
---
### Final Thoughts
Market depth is the underlying structural engine of crypto market mechanics. While price charts tell you where an asset has been, market depth helps reveal how efficiently an asset can move next.
By analyzing order book density, monitoring 2% depth metrics, and remaining vigilant against phantom liquidity, intermediate crypto participants can execute trades more effectively, protect capital from excessive slippage, and gain a clearer understanding of true supply and demand.
#CryptoEducation #MarketDepth #TradingMechanics
Demystifying Market Depth: How Order Books Drive Crypto Execution and Price Stability
When observing cryptocurrency markets, most market participants focus primarily on the candlestick chart. They watch the price tick up or down, tracking resistance levels, support channels, and moving averages. However, a standard price chart only displays historical transactions—the record of where buyers and sellers previously agreed on value. It does not explicitly show the pending supply and demand sitting quietly behind the scenes.
To truly understand price movement, execution efficiency, and market fragility, one must look at market depth. Market depth provides a real-time window into the order book, detailing the volume of buy and sell limit orders waiting to be filled at various price levels. For intermediate traders and market participants, mastering the concepts of market depth is essential for minimizing execution costs, identifying potential manipulation, and gauging true market liquidity.
---
### What Is Market Depth?
At its core, market depth measures a market's ability to absorb relatively large market orders without causing significant price shifts. It reflects the overall volume of open limit orders placed on an exchange's central limit order book (CLOB).
In any standard exchange interface, the order book is split into two primary components:
1. **Bids (Buy Orders):** Located below the current market price, bids represent buyers willing to purchase an asset at a specified price or lower.
2. **Asks (Sell Orders or Offers):** Located above the current market price, asks represent sellers willing to part with their asset at a specified price or higher.
The difference between the lowest ask price and the highest bid price is known as the **bid-ask spread**.
Market depth visualizes how many units of an asset are queued up across price ticks on both the bid side and the ask side. A market is considered "deep" if there are substantial buy and sell orders close to the mid-price. Conversely, a market is considered "shallow" or "thin" if only a few small orders exist near the current trading price.
---
### Anatomy of the Order Book and Depth Chart
To visualize market depth, trading platforms often use a cumulative depth chart. This chart features price on the horizontal axis and cumulative order volume on the vertical axis.
* **The Bid Side (Green):** Slopes downward to the left. It accumulates the total volume of buy orders as price levels decrease from the current mark price.
* **The Ask Side (Red):** Slopes upward to the right. It accumulates the total volume of sell orders as price levels increase from the current mark price.
#### Buy Walls and Sell Walls
When viewing a depth chart, you may notice sharp, steep vertical steps. These are commonly referred to as "walls."
* **A Buy Wall** occurs when a single buyer or a group of buyers places a massive limit order at a specific price level below the current price. It acts as a potential support line because market sellers must fill all the volume within that wall before the price can drop lower.
* **A Sell Wall** occurs when a large limit sell order is placed at a specific price level above the current price. It acts as potential overhead resistance because market buyers must consume all the liquidity at that level before the price can move higher.
While walls appear to show strong support or resistance, intermediate market participants must approach them with caution. Unlike completed trades, unfilled limit orders can be canceled instantly by automated trading systems before price ever reaches them.
---
### Critical Metrics Derived from Market Depth
Understanding market depth requires analyzing specific metrics that quantify how easily orders can be executed.
#### 1. Slippage and Price Impact
Market orders prioritize speed of execution over price. When a trader places a large market buy order, the exchange engine fills the order against the lowest available ask. If the order size exceeds the volume available at the top of the order book, the engine automatically walks up the book, filling remaining portions of the order at progressively higher ask prices.
The difference between the expected execution price (the price visible when the order was submitted) and the actual average filled price is known as **slippage**. Deep market depth minimizes slippage, whereas thin market depth leads to high slippage and severe price impact.
#### 2. The 2% Market Depth Standard
Institutional participants and analytics platforms rarely rely solely on total order book volume, as orders placed 50% away from the current price have little relevance to immediate trading conditions. Instead, they monitor **2% Market Depth**.
This metric calculates the cumulative fiat value of bids and asks sitting within 2% above and below the current mid-price. For major digital assets like Bitcoin and Ethereum, 2% market depth often runs into tens of millions of dollars across top exchanges. For lower-capitalization tokens, 2% market depth might be only a few thousand dollars, rendering them highly vulnerable to sudden volatility caused by modest orders.
#### 3. Bid-Ask Spread Dynamics
The spread itself is a direct reflection of market depth and market-maker risk perception:
* **Tight Spreads:** Indicate high liquidity, dense order depth, and competitive market-making. Trades execute close to market valuation.
* **Wide Spreads:** Indicate low liquidity, sparse order depth, or heightened uncertainty (such as during major macroeconomic announcements), leading market makers to demand a higher risk premium.
---
### Practical Applications in Crypto Trading
Understanding depth allows market participants to move beyond basic chart patterns and make informed operational decisions:
* **Optimizing Order Execution:** If an investor intends to rebalance a portfolio position, inspecting market depth helps determine whether to use market orders, limit orders, or algorithmic execution strategies like Time-Weighted Average Price (TWAP). Placing a single large market order into a shallow book can instantly cause self-inflicted slippage losses.
* **Evaluating Token Fragility:** Market capitalization alone can be misleading. A token may sport a billion-dollar market cap based on circulating supply multiplied by the last trade price, but possess only $50,000 in 2% market depth. Market depth reveals the true capital required to move a token's price up or down.
* **Assessing Liquidity Fragmentation:** Cryptocurrency trading is spread across numerous centralized and decentralized venues. Analyzing market depth across different platforms helps participants identify where real liquidity resides versus venues with inflated reporting or hollow books.
---
### Risks, Manipulations, and Limitations
While market depth provides invaluable insights, relying on it blindly carries distinct risks. The order book is a dynamic environment subject to strategic maneuvering by sophisticated actors.
#### Spoofing and Phantom Liquidity
Spoofing occurs when traders place large, visible limit orders with no intention of executing them. The goal is to create a false impression of heavy buying support or selling pressure, deceiving other market participants into trading in a specific direction. Once price approaches the fake wall, the orders are instantly canceled using high-frequency APIs.
#### Hidden and Iceberg Orders
Not all depth is visible on the public order book. Institutions frequently utilize **iceberg orders**, which split a massive order into small visible tranches. As each visible tranche fills, another is automatically posted. Therefore, a price level that appears thin on the depth chart may actually contain substantial hidden liquidity.
#### Decentralized Automated Market Makers (AMMs)
Market depth mechanics differ substantially between traditional centralized order books and Decentralized Finance (DeFi) protocols using Constant Product Automated Market Makers (e.g., $x \times y = k$). On AMMs, depth is determined by liquidity pool balances rather than pending limit orders. Slippage on AMMs follows a deterministic mathematical curve rather than an aggregated list of individual limit prices.
---
### Final Thoughts
Market depth is the underlying structural engine of crypto market mechanics. While price charts tell you where an asset has been, market depth helps reveal how efficiently an asset can move next.
By analyzing order book density, monitoring 2% depth metrics, and remaining vigilant against phantom liquidity, intermediate crypto participants can execute trades more effectively, protect capital from excessive slippage, and gain a clearer understanding of true supply and demand.
#CryptoEducation #MarketDepth #TradingMechanics
To truly understand price movement, execution efficiency, and market fragility, one must look at market depth. Market depth provides a real-time window into the order book, detailing the volume of buy and sell limit orders waiting to be filled at various price levels. For intermediate traders and market participants, mastering the concepts of market depth is essential for minimizing execution costs, identifying potential manipulation, and gauging true market liquidity.
---
### What Is Market Depth?
At its core, market depth measures a market's ability to absorb relatively large market orders without causing significant price shifts. It reflects the overall volume of open limit orders placed on an exchange's central limit order book (CLOB).
In any standard exchange interface, the order book is split into two primary components:
1. **Bids (Buy Orders):** Located below the current market price, bids represent buyers willing to purchase an asset at a specified price or lower.
2. **Asks (Sell Orders or Offers):** Located above the current market price, asks represent sellers willing to part with their asset at a specified price or higher.
The difference between the lowest ask price and the highest bid price is known as the **bid-ask spread**.
Market depth visualizes how many units of an asset are queued up across price ticks on both the bid side and the ask side. A market is considered "deep" if there are substantial buy and sell orders close to the mid-price. Conversely, a market is considered "shallow" or "thin" if only a few small orders exist near the current trading price.
---
### Anatomy of the Order Book and Depth Chart
To visualize market depth, trading platforms often use a cumulative depth chart. This chart features price on the horizontal axis and cumulative order volume on the vertical axis.
* **The Bid Side (Green):** Slopes downward to the left. It accumulates the total volume of buy orders as price levels decrease from the current mark price.
* **The Ask Side (Red):** Slopes upward to the right. It accumulates the total volume of sell orders as price levels increase from the current mark price.
#### Buy Walls and Sell Walls
When viewing a depth chart, you may notice sharp, steep vertical steps. These are commonly referred to as "walls."
* **A Buy Wall** occurs when a single buyer or a group of buyers places a massive limit order at a specific price level below the current price. It acts as a potential support line because market sellers must fill all the volume within that wall before the price can drop lower.
* **A Sell Wall** occurs when a large limit sell order is placed at a specific price level above the current price. It acts as potential overhead resistance because market buyers must consume all the liquidity at that level before the price can move higher.
While walls appear to show strong support or resistance, intermediate market participants must approach them with caution. Unlike completed trades, unfilled limit orders can be canceled instantly by automated trading systems before price ever reaches them.
---
### Critical Metrics Derived from Market Depth
Understanding market depth requires analyzing specific metrics that quantify how easily orders can be executed.
#### 1. Slippage and Price Impact
Market orders prioritize speed of execution over price. When a trader places a large market buy order, the exchange engine fills the order against the lowest available ask. If the order size exceeds the volume available at the top of the order book, the engine automatically walks up the book, filling remaining portions of the order at progressively higher ask prices.
The difference between the expected execution price (the price visible when the order was submitted) and the actual average filled price is known as **slippage**. Deep market depth minimizes slippage, whereas thin market depth leads to high slippage and severe price impact.
#### 2. The 2% Market Depth Standard
Institutional participants and analytics platforms rarely rely solely on total order book volume, as orders placed 50% away from the current price have little relevance to immediate trading conditions. Instead, they monitor **2% Market Depth**.
This metric calculates the cumulative fiat value of bids and asks sitting within 2% above and below the current mid-price. For major digital assets like Bitcoin and Ethereum, 2% market depth often runs into tens of millions of dollars across top exchanges. For lower-capitalization tokens, 2% market depth might be only a few thousand dollars, rendering them highly vulnerable to sudden volatility caused by modest orders.
#### 3. Bid-Ask Spread Dynamics
The spread itself is a direct reflection of market depth and market-maker risk perception:
* **Tight Spreads:** Indicate high liquidity, dense order depth, and competitive market-making. Trades execute close to market valuation.
* **Wide Spreads:** Indicate low liquidity, sparse order depth, or heightened uncertainty (such as during major macroeconomic announcements), leading market makers to demand a higher risk premium.
---
### Practical Applications in Crypto Trading
Understanding depth allows market participants to move beyond basic chart patterns and make informed operational decisions:
* **Optimizing Order Execution:** If an investor intends to rebalance a portfolio position, inspecting market depth helps determine whether to use market orders, limit orders, or algorithmic execution strategies like Time-Weighted Average Price (TWAP). Placing a single large market order into a shallow book can instantly cause self-inflicted slippage losses.
* **Evaluating Token Fragility:** Market capitalization alone can be misleading. A token may sport a billion-dollar market cap based on circulating supply multiplied by the last trade price, but possess only $50,000 in 2% market depth. Market depth reveals the true capital required to move a token's price up or down.
* **Assessing Liquidity Fragmentation:** Cryptocurrency trading is spread across numerous centralized and decentralized venues. Analyzing market depth across different platforms helps participants identify where real liquidity resides versus venues with inflated reporting or hollow books.
---
### Risks, Manipulations, and Limitations
While market depth provides invaluable insights, relying on it blindly carries distinct risks. The order book is a dynamic environment subject to strategic maneuvering by sophisticated actors.
#### Spoofing and Phantom Liquidity
Spoofing occurs when traders place large, visible limit orders with no intention of executing them. The goal is to create a false impression of heavy buying support or selling pressure, deceiving other market participants into trading in a specific direction. Once price approaches the fake wall, the orders are instantly canceled using high-frequency APIs.
#### Hidden and Iceberg Orders
Not all depth is visible on the public order book. Institutions frequently utilize **iceberg orders**, which split a massive order into small visible tranches. As each visible tranche fills, another is automatically posted. Therefore, a price level that appears thin on the depth chart may actually contain substantial hidden liquidity.
#### Decentralized Automated Market Makers (AMMs)
Market depth mechanics differ substantially between traditional centralized order books and Decentralized Finance (DeFi) protocols using Constant Product Automated Market Makers (e.g., $x \times y = k$). On AMMs, depth is determined by liquidity pool balances rather than pending limit orders. Slippage on AMMs follows a deterministic mathematical curve rather than an aggregated list of individual limit prices.
---
### Final Thoughts
Market depth is the underlying structural engine of crypto market mechanics. While price charts tell you where an asset has been, market depth helps reveal how efficiently an asset can move next.
By analyzing order book density, monitoring 2% depth metrics, and remaining vigilant against phantom liquidity, intermediate crypto participants can execute trades more effectively, protect capital from excessive slippage, and gain a clearer understanding of true supply and demand.
#CryptoEducation #MarketDepth #TradingMechanics
137
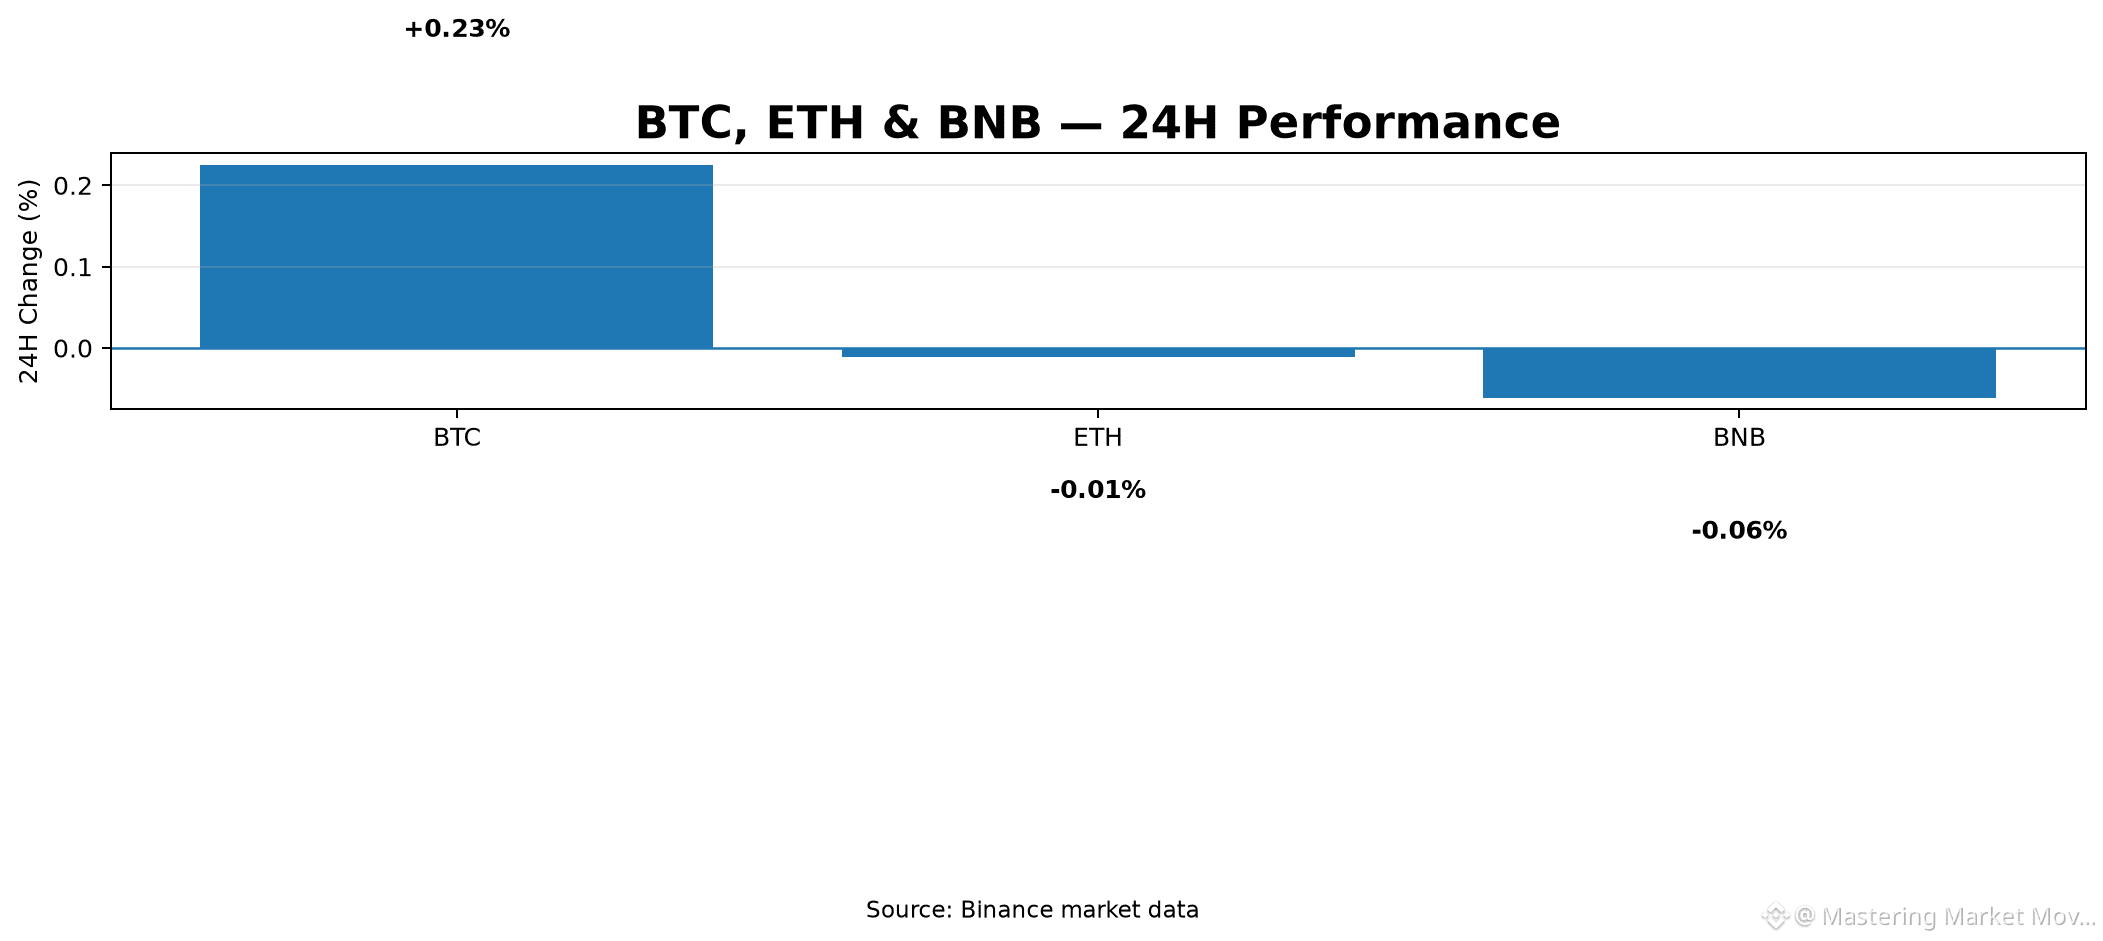
Artikel
Krypto-Marktübersicht: Tägliche Analyse wichtiger VermögenswerteMarktübersicht:
$BTC wird bei 78.342,11 $ gehandelt und zeigt einen moderaten 24-Stunden-Gewinn von +0,225 %. In der Zwischenzeit wird $ETH zu 2.454,35 $ bewertet, mit einem leichten Rückgang von -0,011 %, und $BNB liegt bei 687,98 $, was einen geringen Rückgang von -0,061 % verzeichnet.
Hohe/Niedrige Spannen & Volatilität:
- Bitcoin verzeichnete eine Intraday-Spanne zwischen einem Tief von 77.510,00 $ und einem Hoch von 79.250,00 $, was auf eine moderate Volatilität hindeutet.
- Ethereum wurde zwischen 2.426,58 $ und 2.489,95 $ gehandelt.
- BNB bewegte sich innerhalb einer engen Spanne von 683,52 $ bis 694,83 $, was auf eine geringe Volatilität hindeutet.
Krypto-Marktübersicht: Tägliche Analyse wichtiger Vermögenswerte
Marktübersicht:
$BTC wird bei 78.342,11 $ gehandelt und zeigt einen moderaten 24-Stunden-Gewinn von +0,225 %. In der Zwischenzeit wird $ETH zu 2.454,35 $ bewertet, mit einem leichten Rückgang von -0,011 %, und $BNB liegt bei 687,98 $, was einen geringen Rückgang von -0,061 % verzeichnet.
Hohe/Niedrige Spannen & Volatilität:
- Bitcoin verzeichnete eine Intraday-Spanne zwischen einem Tief von 77.510,00 $ und einem Hoch von 79.250,00 $, was auf eine moderate Volatilität hindeutet.
- Ethereum wurde zwischen 2.426,58 $ und 2.489,95 $ gehandelt.
- BNB bewegte sich innerhalb einer engen Spanne von 683,52 $ bis 694,83 $, was auf eine geringe Volatilität hindeutet.
$BTC wird bei 78.342,11 $ gehandelt und zeigt einen moderaten 24-Stunden-Gewinn von +0,225 %. In der Zwischenzeit wird $ETH zu 2.454,35 $ bewertet, mit einem leichten Rückgang von -0,011 %, und $BNB liegt bei 687,98 $, was einen geringen Rückgang von -0,061 % verzeichnet.
Hohe/Niedrige Spannen & Volatilität:
- Bitcoin verzeichnete eine Intraday-Spanne zwischen einem Tief von 77.510,00 $ und einem Hoch von 79.250,00 $, was auf eine moderate Volatilität hindeutet.
- Ethereum wurde zwischen 2.426,58 $ und 2.489,95 $ gehandelt.
- BNB bewegte sich innerhalb einer engen Spanne von 683,52 $ bis 694,83 $, was auf eine geringe Volatilität hindeutet.
90
Übersetzung ansehen
Crypto News Brief: Strategy Resumes Buying, Sberbank Plans ETH Loans, Bitmine AccumulatesHere are today's top crypto news updates:
1. Strategy Resumes Bitcoin Purchases
- What happened: Michael Saylor's Strategy made its first $BTC acquisition in two months.
- Why it matters: Signals a return to corporate treasury expansion by one of Bitcoin's largest institutional holders.
- Source: Fortune
2. Sberbank Announces Ethereum-Backed Loans
- What happened: Russia's Sberbank reported $46 billion in crypto trading activity and plans to introduce loans collateralized by $ETH and USDT.
- Why it matters: Demonstrates growing integration of digital assets within major traditional banking institutions.
- Source: Decrypt
3. Bitmine Expands Treasury to 5.9M Tokens
- What happened: Bitmine Immersion Technologies revealed its holdings reached 5.90 million $ETH following a recent $131 million purchase.
- Why it matters: Highlights continued large-scale institutional accumulation of Ethereum.
- Source: PR Newswire
4. North Korean Hackers Transfer Millions on Hyperliquid
- What happened: Illicit actors moved tens of millions of dollars across Hyperliquid as U.S. political figures push to bring the platform onshore.
- Why it matters: Underlines heightened regulatory scrutiny and security concerns facing decentralized trading venues.
- Source: CoinDesk
#CryptoNews #Bitcoin #Ethereum
Crypto News Brief: Strategy Resumes Buying, Sberbank Plans ETH Loans, Bitmine Accumulates
Here are today's top crypto news updates:
1. Strategy Resumes Bitcoin Purchases
- What happened: Michael Saylor's Strategy made its first $BTC acquisition in two months.
- Why it matters: Signals a return to corporate treasury expansion by one of Bitcoin's largest institutional holders.
- Source: Fortune
2. Sberbank Announces Ethereum-Backed Loans
- What happened: Russia's Sberbank reported $46 billion in crypto trading activity and plans to introduce loans collateralized by $ETH and USDT.
- Why it matters: Demonstrates growing integration of digital assets within major traditional banking institutions.
- Source: Decrypt
3. Bitmine Expands Treasury to 5.9M Tokens
- What happened: Bitmine Immersion Technologies revealed its holdings reached 5.90 million $ETH following a recent $131 million purchase.
- Why it matters: Highlights continued large-scale institutional accumulation of Ethereum.
- Source: PR Newswire
4. North Korean Hackers Transfer Millions on Hyperliquid
- What happened: Illicit actors moved tens of millions of dollars across Hyperliquid as U.S. political figures push to bring the platform onshore.
- Why it matters: Underlines heightened regulatory scrutiny and security concerns facing decentralized trading venues.
- Source: CoinDesk
#CryptoNews #Bitcoin #Ethereum
1. Strategy Resumes Bitcoin Purchases
- What happened: Michael Saylor's Strategy made its first $BTC acquisition in two months.
- Why it matters: Signals a return to corporate treasury expansion by one of Bitcoin's largest institutional holders.
- Source: Fortune
2. Sberbank Announces Ethereum-Backed Loans
- What happened: Russia's Sberbank reported $46 billion in crypto trading activity and plans to introduce loans collateralized by $ETH and USDT.
- Why it matters: Demonstrates growing integration of digital assets within major traditional banking institutions.
- Source: Decrypt
3. Bitmine Expands Treasury to 5.9M Tokens
- What happened: Bitmine Immersion Technologies revealed its holdings reached 5.90 million $ETH following a recent $131 million purchase.
- Why it matters: Highlights continued large-scale institutional accumulation of Ethereum.
- Source: PR Newswire
4. North Korean Hackers Transfer Millions on Hyperliquid
- What happened: Illicit actors moved tens of millions of dollars across Hyperliquid as U.S. political figures push to bring the platform onshore.
- Why it matters: Underlines heightened regulatory scrutiny and security concerns facing decentralized trading venues.
- Source: CoinDesk
#CryptoNews #Bitcoin #Ethereum
1
121
Krypto-Liquidität entmystifizieren: Wie Orderbücher, Markttiefe und Slippage jede einzelne Order prägenLiquidität wird oft als Lebenselixier der Finanzmärkte bezeichnet, bleibt jedoch eines der am häufigsten missverstandenen Konzepte unter aufstrebenden Krypto-Tradern. Während sich viele Marktteilnehmer übermäßig auf technische Chartmuster, Momentum-Indikatoren oder grundlegende Projekt-Updates konzentrieren, bestimmt die zugrunde liegende Liquiditätsstruktur letztlich, wie reibungslos – oder brutal – Orders ausgeführt werden.
Liquidität zu verstehen ist keine bloß akademische Übung; es ist ein entscheidender Bestandteil des Risikomanagements, der Ausführungsstrategie und der Marktanalyse. Im Krypto-Bereich, in dem rund um die Uhr an hunderten fragmentierter zentralisierter und dezentralisierter Plattformen gehandelt wird, können sich Liquiditätsdynamiken innerhalb eines Bruchteils einer Sekunde verändern.
Krypto-Liquidität entmystifizieren: Wie Orderbücher, Markttiefe und Slippage jede einzelne Order prägen
Liquidität wird oft als Lebenselixier der Finanzmärkte bezeichnet, bleibt jedoch eines der am häufigsten missverstandenen Konzepte unter aufstrebenden Krypto-Tradern. Während sich viele Marktteilnehmer übermäßig auf technische Chartmuster, Momentum-Indikatoren oder grundlegende Projekt-Updates konzentrieren, bestimmt die zugrunde liegende Liquiditätsstruktur letztlich, wie reibungslos – oder brutal – Orders ausgeführt werden.
Liquidität zu verstehen ist keine bloß akademische Übung; es ist ein entscheidender Bestandteil des Risikomanagements, der Ausführungsstrategie und der Marktanalyse. Im Krypto-Bereich, in dem rund um die Uhr an hunderten fragmentierter zentralisierter und dezentralisierter Plattformen gehandelt wird, können sich Liquiditätsdynamiken innerhalb eines Bruchteils einer Sekunde verändern.
Liquidität zu verstehen ist keine bloß akademische Übung; es ist ein entscheidender Bestandteil des Risikomanagements, der Ausführungsstrategie und der Marktanalyse. Im Krypto-Bereich, in dem rund um die Uhr an hunderten fragmentierter zentralisierter und dezentralisierter Plattformen gehandelt wird, können sich Liquiditätsdynamiken innerhalb eines Bruchteils einer Sekunde verändern.
128
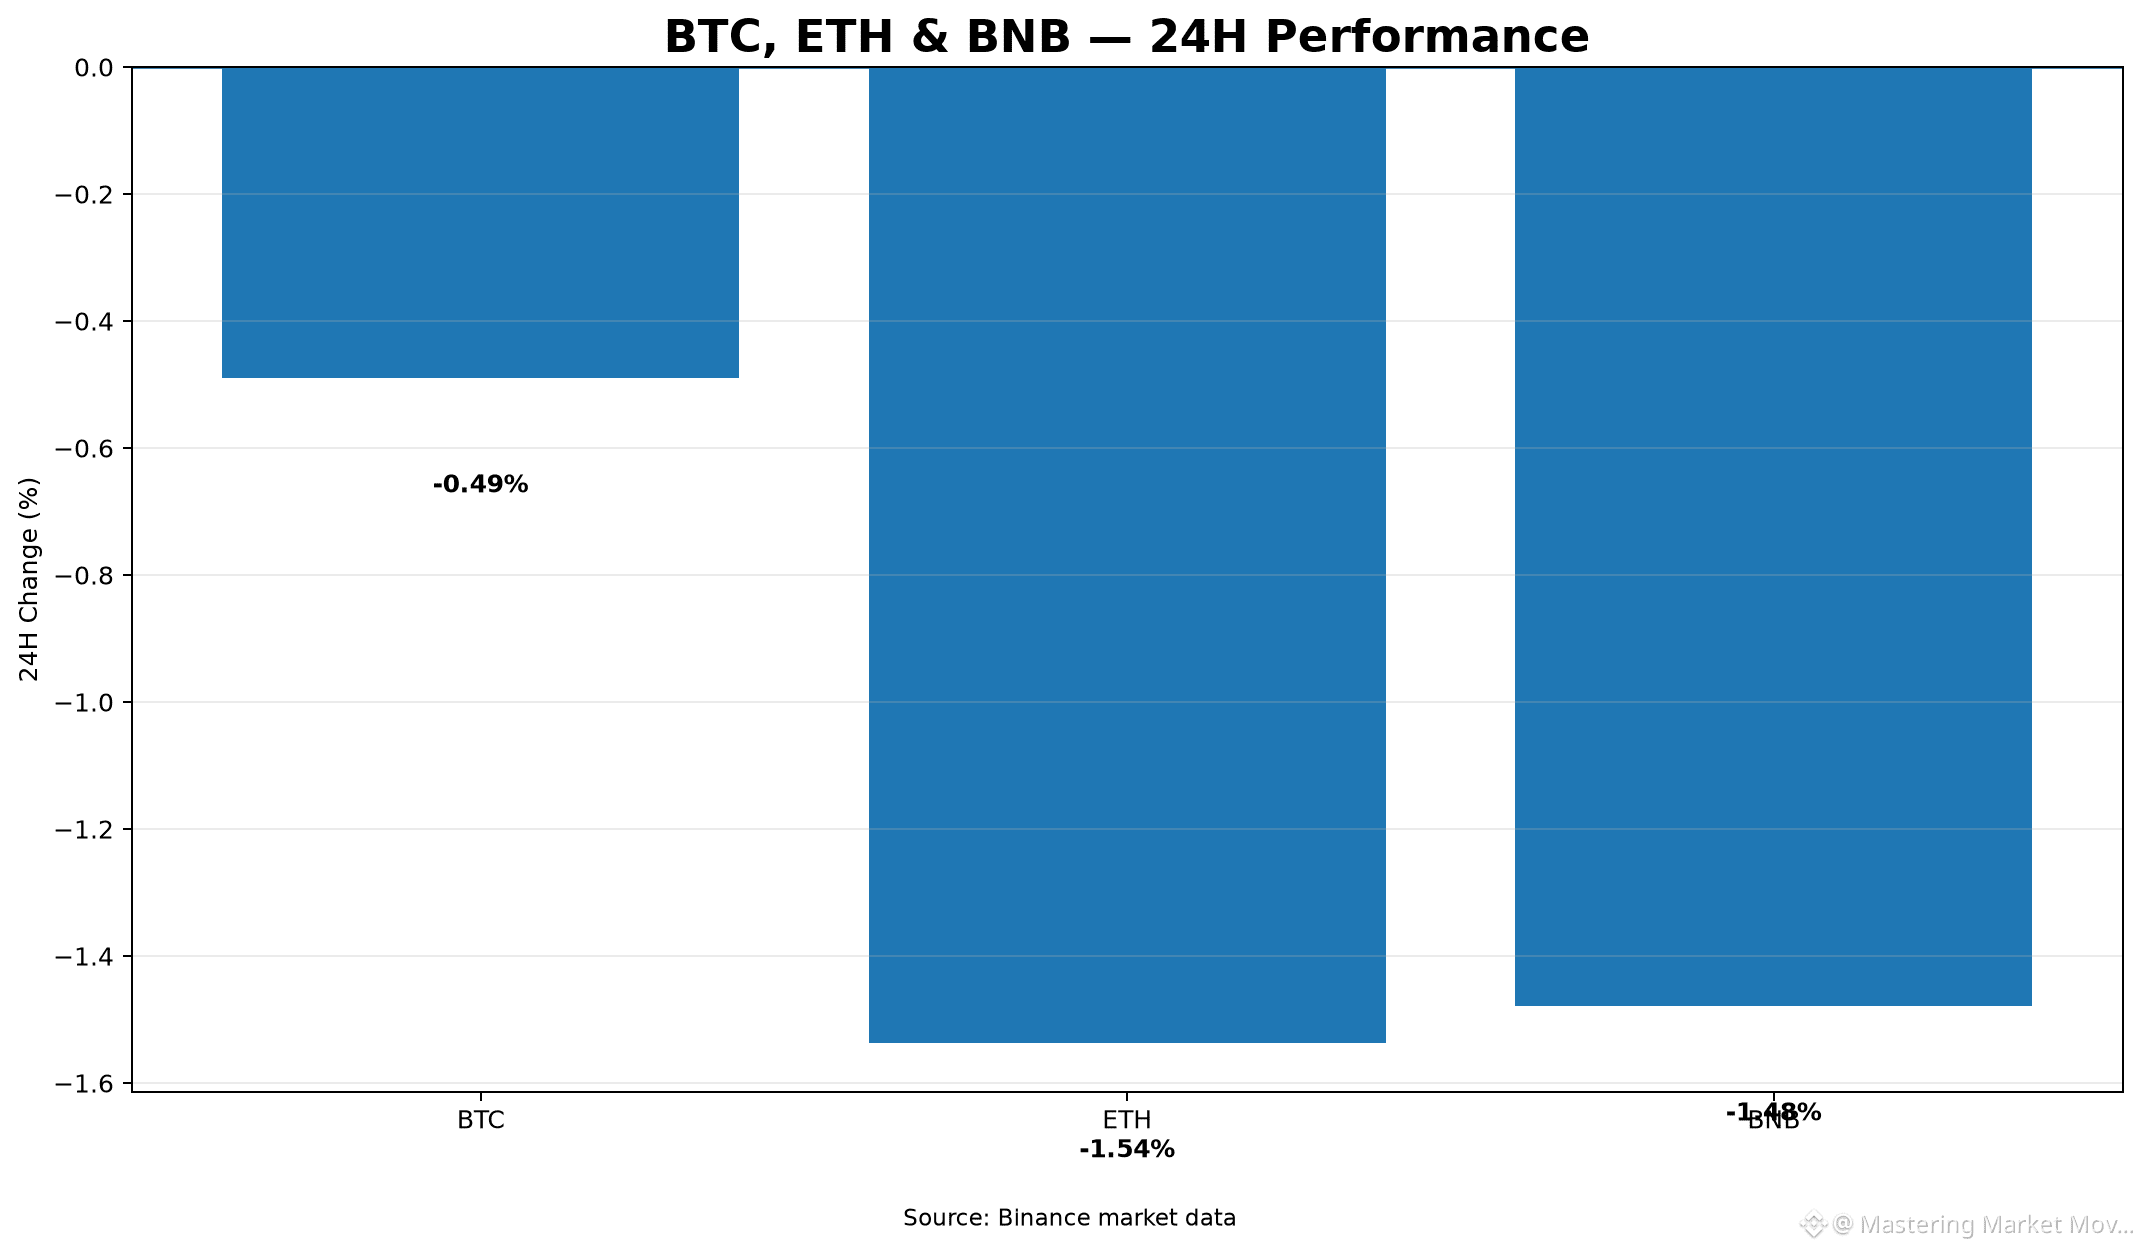
Artikel
Marktanalyse: Relative Stärke und Range-Dynamik bei Top-AssetsDer Markt zeigt in den vergangenen 24 Stunden leichte Rücksetzer bei wichtigen Assets. $BTC handelt bei 78.555,40 $ mit einer geringfügigen 24h-Änderung von -0,49 % und zeigt damit im Vergleich zu $ETH relative Stärke, das um -1,537 % auf 2.462,14 $ fiel, sowie zu $BNB, das um -1,479 % auf 689,00 $ nachgab.
High/Low-Spannen & Volatilität:
- Bitcoin verzeichnete eine hohe Volatilität zwischen einem 24h-Tief von 77.000,00 $ und einem Hoch von 79.181,99 $.
- Ethereum handelte in einer Spanne von 2.387,28 $ bis 2.517,54 $.
- BNB erlebte Kursbewegungen zwischen 679,09 $ und 702,57 $.
Marktanalyse: Relative Stärke und Range-Dynamik bei Top-Assets
Der Markt zeigt in den vergangenen 24 Stunden leichte Rücksetzer bei wichtigen Assets. $BTC handelt bei 78.555,40 $ mit einer geringfügigen 24h-Änderung von -0,49 % und zeigt damit im Vergleich zu $ETH relative Stärke, das um -1,537 % auf 2.462,14 $ fiel, sowie zu $BNB , das um -1,479 % auf 689,00 $ nachgab.
High/Low-Spannen & Volatilität:
- Bitcoin verzeichnete eine hohe Volatilität zwischen einem 24h-Tief von 77.000,00 $ und einem Hoch von 79.181,99 $.
- Ethereum handelte in einer Spanne von 2.387,28 $ bis 2.517,54 $.
- BNB erlebte Kursbewegungen zwischen 679,09 $ und 702,57 $.
High/Low-Spannen & Volatilität:
- Bitcoin verzeichnete eine hohe Volatilität zwischen einem 24h-Tief von 77.000,00 $ und einem Hoch von 79.181,99 $.
- Ethereum handelte in einer Spanne von 2.387,28 $ bis 2.517,54 $.
- BNB erlebte Kursbewegungen zwischen 679,09 $ und 702,57 $.
118
Krypto-News täglich: $BTC hält 78.000 US-Dollar, $ETH-ETF-Zuflüsse gehen weiter, $BNB überschreitet 700Hier sind die wichtigsten Krypto-News-Updates von heute:
1. Der Markt reagiert auf geopolitische Spannungen, da $BTC 78.000 US-Dollar hält
- Was passiert ist: Die zunehmenden Spannungen zwischen den USA und dem Iran führten zu kurzfristigen Rücksetzern bei den Preisen über große digitale Assets hinweg, obwohl Bitcoin stabil blieb und sich um 78.000 US-Dollar hielt, während der US-Dollar an Stärke gewann.
- Warum es wichtig ist: Geopolitische Ereignisse und makroökonomische Veränderungen bleiben die dominierenden Treiber der kurzfristigen Volatilität am Kryptomarkt.
- Quelle: Benzinga / CoinDesk
2. Bitcoin-ETF-Zuflussserie endet, während $ETH Mittel weiterhin Zuflüsse verzeichnen
Krypto-News täglich: $BTC hält 78.000 US-Dollar, $ETH-ETF-Zuflüsse gehen weiter, $BNB überschreitet 700
Hier sind die wichtigsten Krypto-News-Updates von heute:
1. Der Markt reagiert auf geopolitische Spannungen, da $BTC 78.000 US-Dollar hält
- Was passiert ist: Die zunehmenden Spannungen zwischen den USA und dem Iran führten zu kurzfristigen Rücksetzern bei den Preisen über große digitale Assets hinweg, obwohl Bitcoin stabil blieb und sich um 78.000 US-Dollar hielt, während der US-Dollar an Stärke gewann.
- Warum es wichtig ist: Geopolitische Ereignisse und makroökonomische Veränderungen bleiben die dominierenden Treiber der kurzfristigen Volatilität am Kryptomarkt.
- Quelle: Benzinga / CoinDesk
2. Bitcoin-ETF-Zuflussserie endet, während $ETH Mittel weiterhin Zuflüsse verzeichnen
1. Der Markt reagiert auf geopolitische Spannungen, da $BTC 78.000 US-Dollar hält
- Was passiert ist: Die zunehmenden Spannungen zwischen den USA und dem Iran führten zu kurzfristigen Rücksetzern bei den Preisen über große digitale Assets hinweg, obwohl Bitcoin stabil blieb und sich um 78.000 US-Dollar hielt, während der US-Dollar an Stärke gewann.
- Warum es wichtig ist: Geopolitische Ereignisse und makroökonomische Veränderungen bleiben die dominierenden Treiber der kurzfristigen Volatilität am Kryptomarkt.
- Quelle: Benzinga / CoinDesk
2. Bitcoin-ETF-Zuflussserie endet, während $ETH Mittel weiterhin Zuflüsse verzeichnen
1
135
Kryptoliquidität entmystifizieren: Wie Orderbücher, Pools und Markttiefe die Preisbewegung prägenLiquidität wird oft als Lebenselixier der Finanzmärkte beschrieben, bleibt jedoch eines der am häufigsten missverstandenen Konzepte unter Retail-Teilnehmern im Krypto-Markt. Während Händler sich häufig auf technische Chartmuster, fundamentale Entwicklungen oder Stimmungsindikatoren konzentrieren, bestimmt Liquidität im Verborgenen, ob ein Trade reibungslos zu einem erwarteten Preis ausgeführt wird oder eine kostspielige Kaskade von Slippage auslöst.
Für fortgeschrittene Trader, die über simples Spot-Kaufen hinausgehen, ist es entscheidend, ein strukturelles Verständnis der Krypto-Liquidität zu entwickeln. Es erklärt, warum es zu plötzlichen Marktcrashs kommt, wie große Orders Märkte bewegen und warum sich die Preisentwicklung über dezentralisierte Börsen hinweg anders verhält als in zentralisierten Orderbüchern.
Kryptoliquidität entmystifizieren: Wie Orderbücher, Pools und Markttiefe die Preisbewegung prägen
Liquidität wird oft als Lebenselixier der Finanzmärkte beschrieben, bleibt jedoch eines der am häufigsten missverstandenen Konzepte unter Retail-Teilnehmern im Krypto-Markt. Während Händler sich häufig auf technische Chartmuster, fundamentale Entwicklungen oder Stimmungsindikatoren konzentrieren, bestimmt Liquidität im Verborgenen, ob ein Trade reibungslos zu einem erwarteten Preis ausgeführt wird oder eine kostspielige Kaskade von Slippage auslöst.
Für fortgeschrittene Trader, die über simples Spot-Kaufen hinausgehen, ist es entscheidend, ein strukturelles Verständnis der Krypto-Liquidität zu entwickeln. Es erklärt, warum es zu plötzlichen Marktcrashs kommt, wie große Orders Märkte bewegen und warum sich die Preisentwicklung über dezentralisierte Börsen hinweg anders verhält als in zentralisierten Orderbüchern.
Für fortgeschrittene Trader, die über simples Spot-Kaufen hinausgehen, ist es entscheidend, ein strukturelles Verständnis der Krypto-Liquidität zu entwickeln. Es erklärt, warum es zu plötzlichen Marktcrashs kommt, wie große Orders Märkte bewegen und warum sich die Preisentwicklung über dezentralisierte Börsen hinweg anders verhält als in zentralisierten Orderbüchern.
1
105
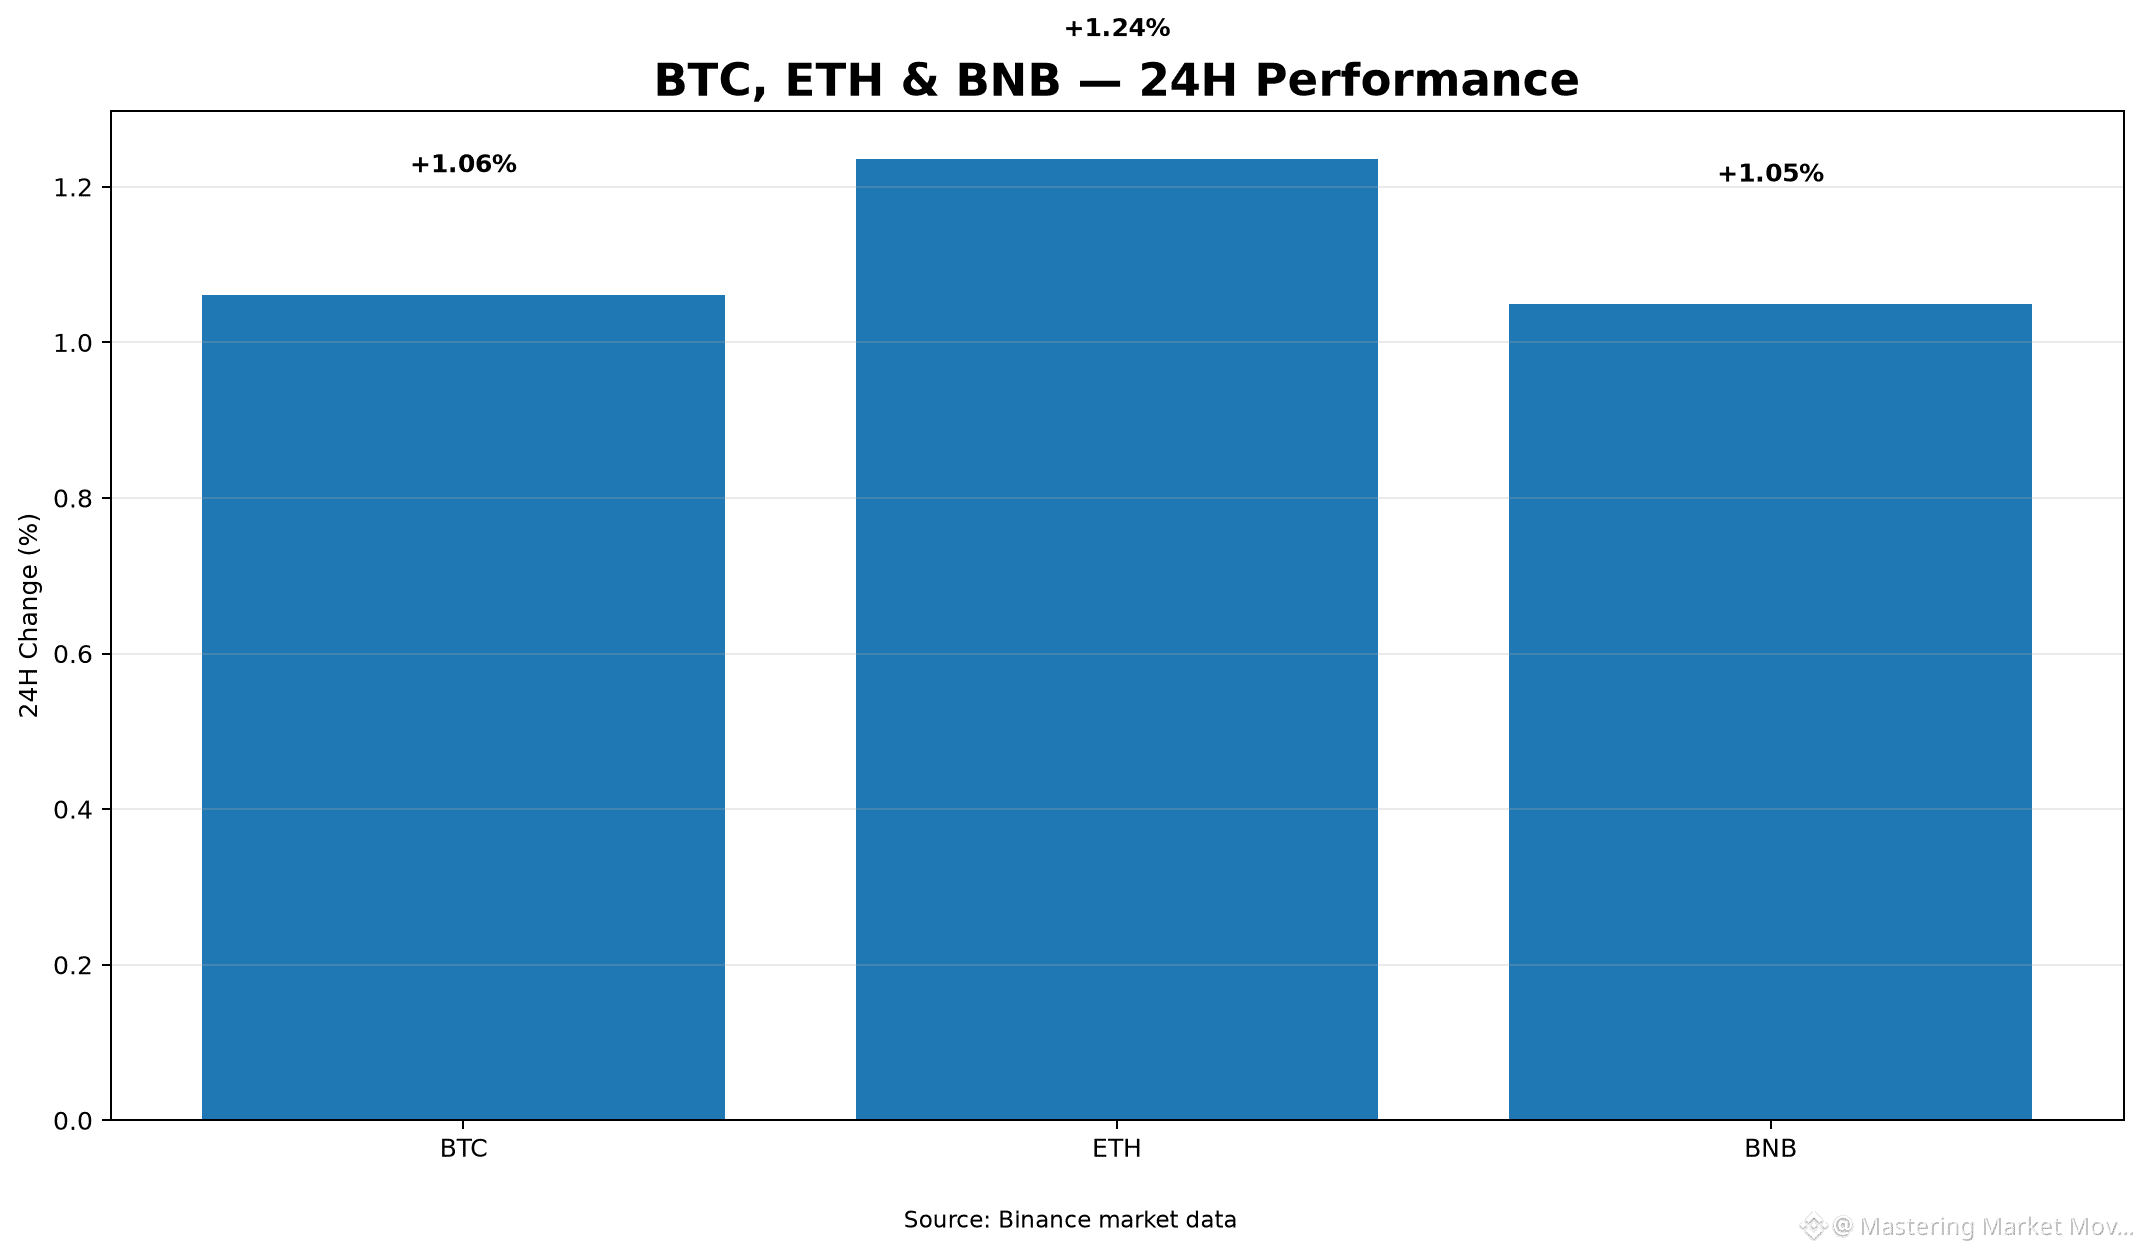
Artikel
Krypto-Marktanalyse: Wichtige Assets zeigen bescheidene Gewinne über 24 StundenDer Krypto-Markt hat in den letzten 24 Stunden eine leichte Aufwärtsdynamik über wichtige Assets hinweg verzeichnet. In Bezug auf die relative Stärke führt $ETH die Gruppe mit einem Anstieg von 1,236 %, aktuell bei 2.475,67 $. $BTC folgt mit einem Plus von 1,061 % und erreicht 78.775,24 $, während $BNB einen Anstieg von 1,049 % verbuchte und bei 698,11 $ steht.
Preisspannen & Volatilität:
Intraday-Spannen zeigen eine moderate Volatilität bei den wichtigsten Coins. Bitcoin handelte zwischen einem 24h-Tief von 77.806,90 $ und einem Hoch von 78.966,76 $. Ethereum schwankte zwischen 2.441,03 $ und einem Hoch von 2.479,71 $. BNB verzeichnete eine enge Spanne von 690,06 $ bis zu seinem Intraday-Höchststand von 700,00 $.
Krypto-Marktanalyse: Wichtige Assets zeigen bescheidene Gewinne über 24 Stunden
Der Krypto-Markt hat in den letzten 24 Stunden eine leichte Aufwärtsdynamik über wichtige Assets hinweg verzeichnet. In Bezug auf die relative Stärke führt $ETH die Gruppe mit einem Anstieg von 1,236 %, aktuell bei 2.475,67 $. $BTC folgt mit einem Plus von 1,061 % und erreicht 78.775,24 $, während $BNB einen Anstieg von 1,049 % verbuchte und bei 698,11 $ steht.
Preisspannen & Volatilität:
Intraday-Spannen zeigen eine moderate Volatilität bei den wichtigsten Coins. Bitcoin handelte zwischen einem 24h-Tief von 77.806,90 $ und einem Hoch von 78.966,76 $. Ethereum schwankte zwischen 2.441,03 $ und einem Hoch von 2.479,71 $. BNB verzeichnete eine enge Spanne von 690,06 $ bis zu seinem Intraday-Höchststand von 700,00 $.
Preisspannen & Volatilität:
Intraday-Spannen zeigen eine moderate Volatilität bei den wichtigsten Coins. Bitcoin handelte zwischen einem 24h-Tief von 77.806,90 $ und einem Hoch von 78.966,76 $. Ethereum schwankte zwischen 2.441,03 $ und einem Hoch von 2.479,71 $. BNB verzeichnete eine enge Spanne von 690,06 $ bis zu seinem Intraday-Höchststand von 700,00 $.
123
Krypto-Liquidität entmystifizieren: Wie Orderbücher, Slippage und Markttiefe jeden Trade prägenIn Finanzmärkten ist Liquidität die unsichtbare Antriebskraft, die jede Transaktion bewegt. Egal, ob du eine Mikro-Transaktion ausführst oder ein Multi-Millionen-Dollar-Portfolio neu ausbalancierst: Liquidität bestimmt, wie leicht, schnell und kosteneffektiv ein Asset in Cash oder ein anderes Asset umgewandelt werden kann—ohne dabei unvorhersehbare Preisschwankungen auszulösen. Auf dem schnelllebigen Kryptowährungsmarkt ist das Verständnis von Liquidität nicht nur eine akademische Übung—es ist eine grundlegende Fähigkeit, die die Ausführungsqualität, die operativen Kosten und das Risikomanagement direkt beeinflusst.
Krypto-Liquidität entmystifizieren: Wie Orderbücher, Slippage und Markttiefe jeden Trade prägen
In Finanzmärkten ist Liquidität die unsichtbare Antriebskraft, die jede Transaktion bewegt. Egal, ob du eine Mikro-Transaktion ausführst oder ein Multi-Millionen-Dollar-Portfolio neu ausbalancierst: Liquidität bestimmt, wie leicht, schnell und kosteneffektiv ein Asset in Cash oder ein anderes Asset umgewandelt werden kann—ohne dabei unvorhersehbare Preisschwankungen auszulösen. Auf dem schnelllebigen Kryptowährungsmarkt ist das Verständnis von Liquidität nicht nur eine akademische Übung—es ist eine grundlegende Fähigkeit, die die Ausführungsqualität, die operativen Kosten und das Risikomanagement direkt beeinflusst.
1
106
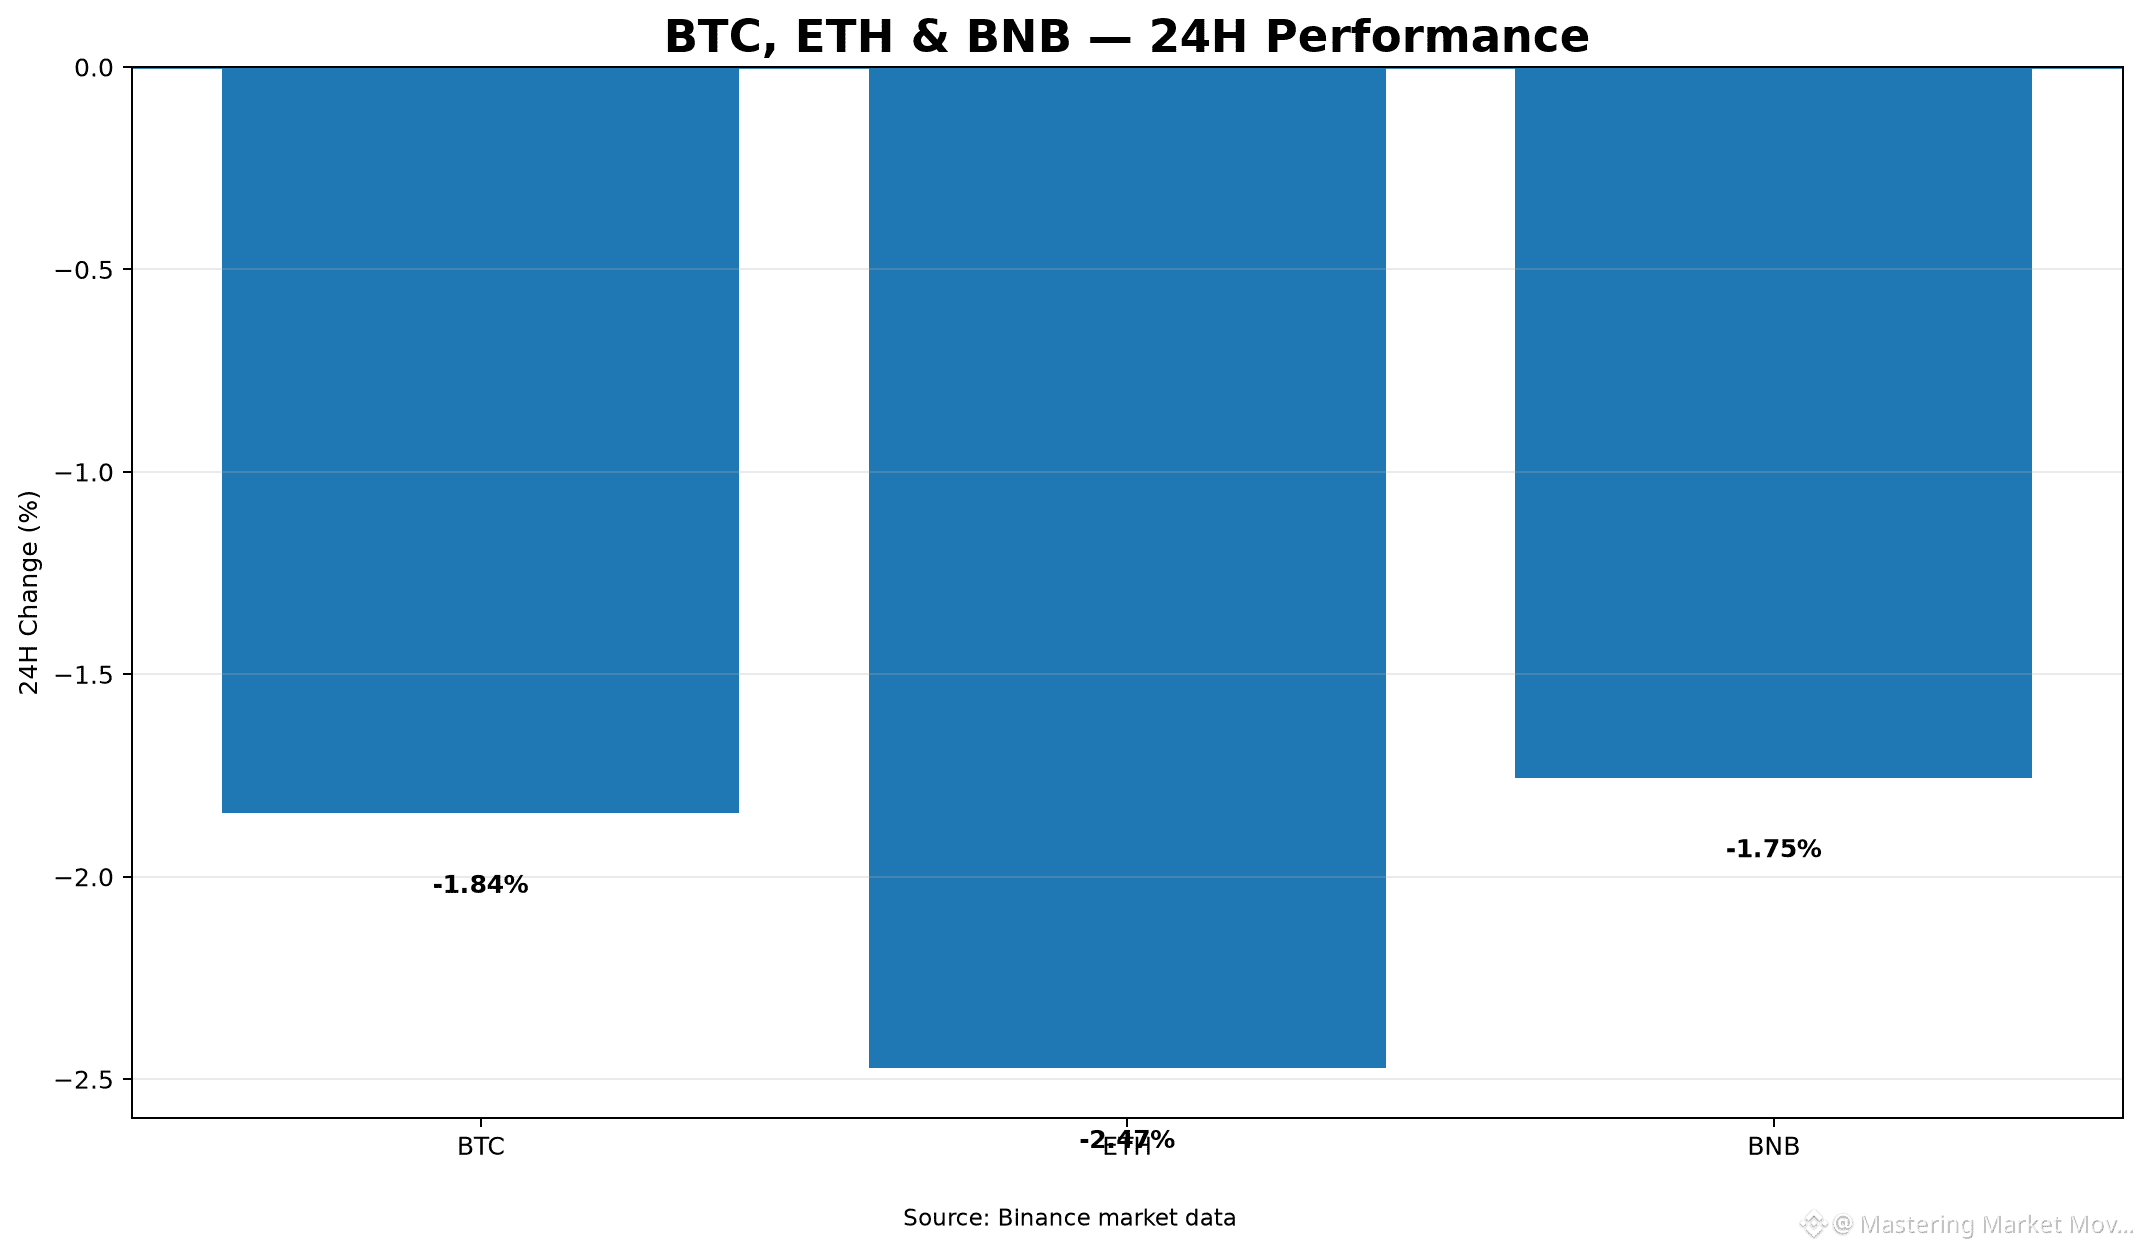
Artikel
Tägliche Marktanalyse: Top-Assets testen Intraday-UnterstützungsniveausDer Kryptomarkt verzeichnete in den letzten 24 Stunden leichte Rücksetzer bei wichtigen Assets.
Preis & Performance-Überblick:
- $BTC handelt bei 78.037,99 $ und spiegelt eine 24h-Änderung von -1,84% wider.
- $ETH <dropped -2,47%, derzeit bei 2.449,80 $ notiert.
- $BNB liegt bei 692,09 $ und verzeichnet einen Rückgang von -1,76%.
Volumen & Spannen der Hoch-/Tiefstände:
- Bitcoin bewegte sich in einer Spanne von einem 24h-Hoch von 79.838,73 $ bis zu einem Tief von 76.888,00 $ und verbuchte 964,59 Mio. $ an 24h-Quote-Volumen.
- Ethereum verzeichnete eine Spanne zwischen 2.405,97 $ und 2.519,25 $ mit 587,03 Mio. $ an Quote-Volumen.
Tägliche Marktanalyse: Top-Assets testen Intraday-Unterstützungsniveaus
Der Kryptomarkt verzeichnete in den letzten 24 Stunden leichte Rücksetzer bei wichtigen Assets.
Preis & Performance-Überblick:
- $BTC handelt bei 78.037,99 $ und spiegelt eine 24h-Änderung von -1,84% wider.
- $ETH <dropped -2,47%, derzeit bei 2.449,80 $ notiert.
- $BNB liegt bei 692,09 $ und verzeichnet einen Rückgang von -1,76%.
Volumen & Spannen der Hoch-/Tiefstände:
- Bitcoin bewegte sich in einer Spanne von einem 24h-Hoch von 79.838,73 $ bis zu einem Tief von 76.888,00 $ und verbuchte 964,59 Mio. $ an 24h-Quote-Volumen.
- Ethereum verzeichnete eine Spanne zwischen 2.405,97 $ und 2.519,25 $ mit 587,03 Mio. $ an Quote-Volumen.
Preis & Performance-Überblick:
- $BTC handelt bei 78.037,99 $ und spiegelt eine 24h-Änderung von -1,84% wider.
- $ETH <dropped -2,47%, derzeit bei 2.449,80 $ notiert.
- $BNB liegt bei 692,09 $ und verzeichnet einen Rückgang von -1,76%.
Volumen & Spannen der Hoch-/Tiefstände:
- Bitcoin bewegte sich in einer Spanne von einem 24h-Hoch von 79.838,73 $ bis zu einem Tief von 76.888,00 $ und verbuchte 964,59 Mio. $ an 24h-Quote-Volumen.
- Ethereum verzeichnete eine Spanne zwischen 2.405,97 $ und 2.519,25 $ mit 587,03 Mio. $ an Quote-Volumen.
90
Anmelden und weiter Inhalte entdecken
Krypto-Nutzer weltweit auf Binance Square kennenlernen
⚡️ Bleib in Sachen Krypto stets am Puls.
💬 Die weltgrößte Kryptobörse vertraut darauf.
👍 Erhalte verlässliche Einblicke von verifizierten Creators.
E-Mail-Adresse/Telefonnummer
Trendthemen
USStrikesIranTankersTehranRestrictsHormuz
2 Aufrufe
6 Kommentare
#USStrikesIranTankersTehranRestrictsHormuz #SamsungSKHynixLeadKoreanSharesHigher #RussiaUkraine72-hourCeasefire #RussiaUkraine72-hourCeasefire #CNPYAirdropOnBinanceAlpha
Aliya 1020
·0 Likes
·0 Aufrufe
SamsungSKHynixLeadKoreanSharesHigher
0 Aufrufe
3 Kommentare
RussiaUkraine72-hourCeasefire
174,812 Aufrufe
2,259 Kommentare