
sonsak
827 Beiträge

sonsak
x @sonsakripto — youtube @sonsakkkk
Trade eröffnen
Gelegenheitstrader
5.7 Jahre
16 Following
7.3K+ Follower
518 Like gegeben
Beiträge
Portfolio
Alle
Zitierungen
Videos
Übersetzung ansehen
📈 $TRX · 1H
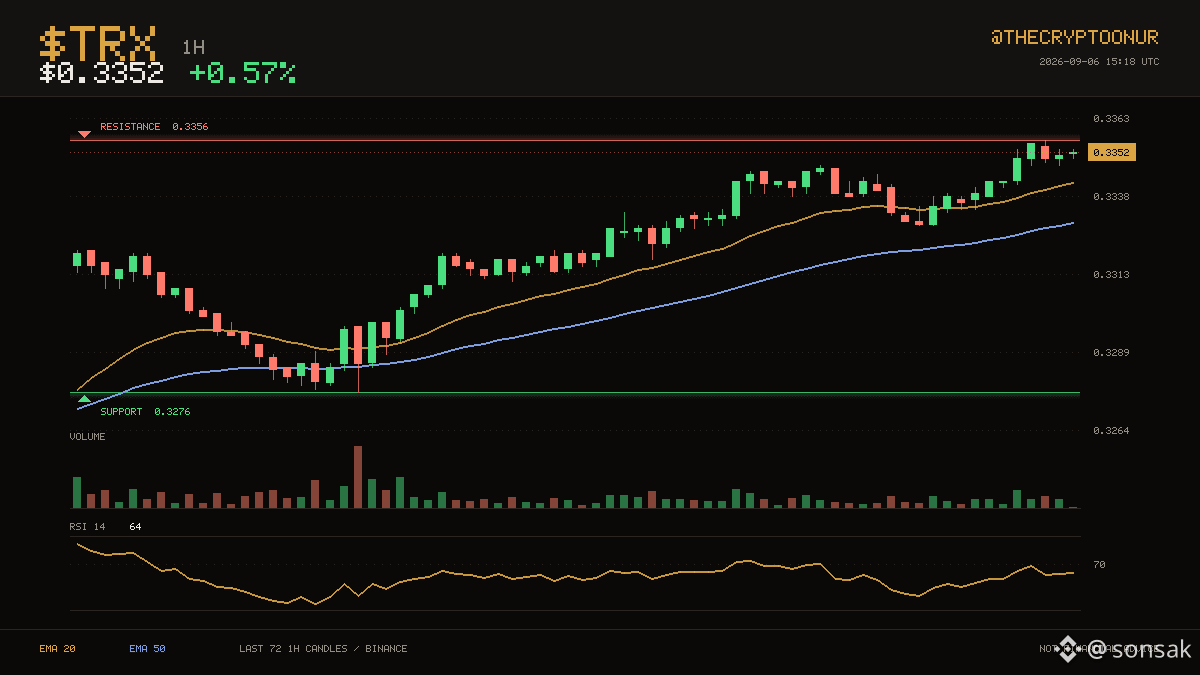
The last three days topped out near $0.3356, and price is pressing that area again. $TRX is trading at $0.3352, above both its 20 and 50 hourly averages. It is trading in the top third of the range right now. Resistance is only 0.1% away, so there is not much room before it matters. Averages have been ordered the same way for a long stretch now, with the 20 above the 50. Momentum is mid range with RSI at 64. The 24 hour range runs $0.3329 to $0.3356, and price is near the top of it. Volume is thin, around 0.6x the recent average, so moves here are easier to fade. Up 0.6% over 24 hours.
Binance spot data. DYOR
$TRX #Binance
The last three days topped out near $0.3356, and price is pressing that area again. $TRX is trading at $0.3352, above both its 20 and 50 hourly averages. It is trading in the top third of the range right now. Resistance is only 0.1% away, so there is not much room before it matters. Averages have been ordered the same way for a long stretch now, with the 20 above the 50. Momentum is mid range with RSI at 64. The 24 hour range runs $0.3329 to $0.3356, and price is near the top of it. Volume is thin, around 0.6x the recent average, so moves here are easier to fade. Up 0.6% over 24 hours.
Binance spot data. DYOR
$TRX #Binance
🔴 $TRUMP · 1H
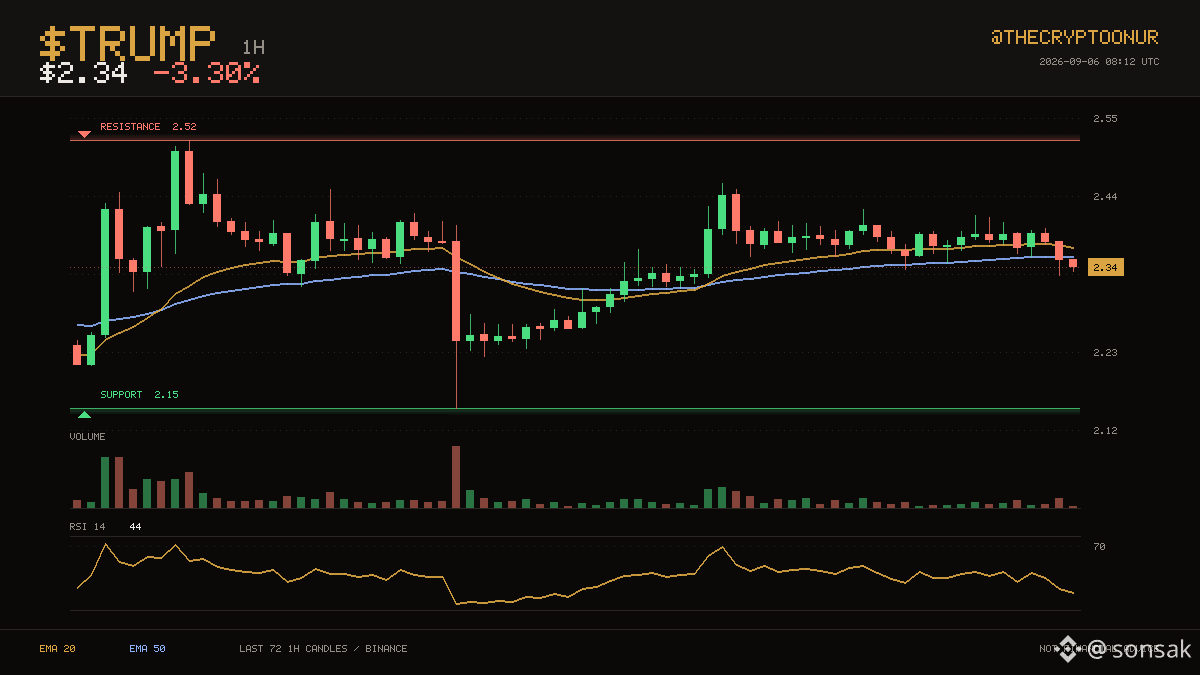
Der Preis liegt bei $2.34 und $TRUMP bleibt unter den Durchschnittswerten, die ihn zuvor gedeckelt haben. $2.15 auf der Unterseite und $2.52 auf der Oberseite haben die letzten drei Tage begrenzt. Das bringt den Preis in die Mitte der Spanne. Das sind 7.4% bis zur Decke und 8.2% bis zum Boden. Der 20er liegt seit 27 Kerzen über dem 50er. Der RSI bei 43 ist neutral, also blockiert das Momentum keine Bewegung in beide Richtungen. Im vergangenen Tag wurde zwischen $2.33 und $2.42 gehandelt, und der Kurs liegt jetzt nahe dem unteren Ende davon. Die Beteiligung ist gering bei etwa 0.6x dem durchschnittlichen Volumen. In 24 Stunden um 3.3% gefallen.
DYOR
$TRUMP #TechnicalAnalysis
Der Preis liegt bei $2.34 und $TRUMP bleibt unter den Durchschnittswerten, die ihn zuvor gedeckelt haben. $2.15 auf der Unterseite und $2.52 auf der Oberseite haben die letzten drei Tage begrenzt. Das bringt den Preis in die Mitte der Spanne. Das sind 7.4% bis zur Decke und 8.2% bis zum Boden. Der 20er liegt seit 27 Kerzen über dem 50er. Der RSI bei 43 ist neutral, also blockiert das Momentum keine Bewegung in beide Richtungen. Im vergangenen Tag wurde zwischen $2.33 und $2.42 gehandelt, und der Kurs liegt jetzt nahe dem unteren Ende davon. Die Beteiligung ist gering bei etwa 0.6x dem durchschnittlichen Volumen. In 24 Stunden um 3.3% gefallen.
DYOR
$TRUMP #TechnicalAnalysis
🟢 $ARB · 1H
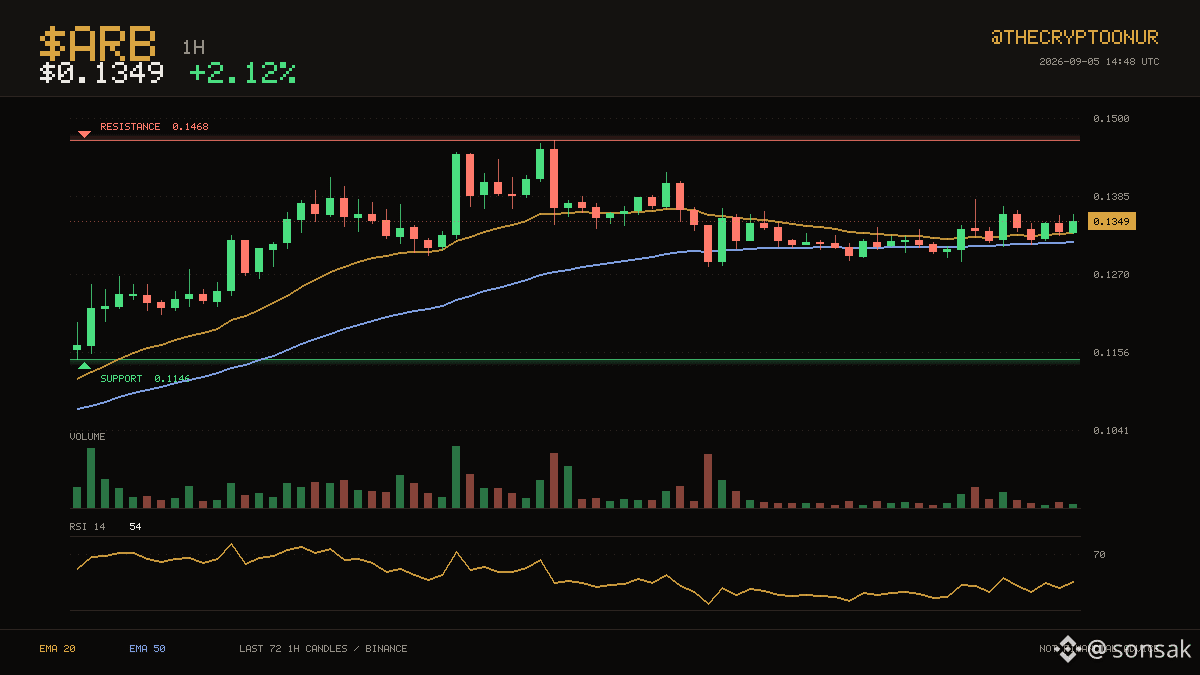
$0.1349 hält $ARB auf der stärkeren Seite seiner stündlichen Durchschnitte. $0.1146 auf der Unterseite und $0.1468 auf der Oberseite haben die letzten drei Tage begrenzt. Der Preis liegt hier ungefähr in der Mitte der Spanne. Der Widerstand liegt beim nächsten bei 8.8% darüber; die Unterstützung ist weit darunter und spielt derzeit keine Rolle. Die Durchschnitte sind schon seit längerer Zeit in derselben Reihenfolge angeordnet, wobei der 20er über dem 50er liegt. Das Momentum liegt im mittleren Bereich mit einem RSI von 54. Die 24-Stunden-Spanne reicht von $0.1289 bis $0.1380, und der Preis befindet sich ungefähr in deren Mitte. Das Volumen ist dünn, etwa 0.4x des jüngsten Durchschnitts, daher lassen sich Bewegungen hier leichter ausblenden. In 24 Stunden um 2.1% gestiegen.
DYOR
$ARB #Crypto
$0.1349 hält $ARB auf der stärkeren Seite seiner stündlichen Durchschnitte. $0.1146 auf der Unterseite und $0.1468 auf der Oberseite haben die letzten drei Tage begrenzt. Der Preis liegt hier ungefähr in der Mitte der Spanne. Der Widerstand liegt beim nächsten bei 8.8% darüber; die Unterstützung ist weit darunter und spielt derzeit keine Rolle. Die Durchschnitte sind schon seit längerer Zeit in derselben Reihenfolge angeordnet, wobei der 20er über dem 50er liegt. Das Momentum liegt im mittleren Bereich mit einem RSI von 54. Die 24-Stunden-Spanne reicht von $0.1289 bis $0.1380, und der Preis befindet sich ungefähr in deren Mitte. Das Volumen ist dünn, etwa 0.4x des jüngsten Durchschnitts, daher lassen sich Bewegungen hier leichter ausblenden. In 24 Stunden um 2.1% gestiegen.
DYOR
$ARB #Crypto
Übersetzung ansehen
📈 $TRX · 1H
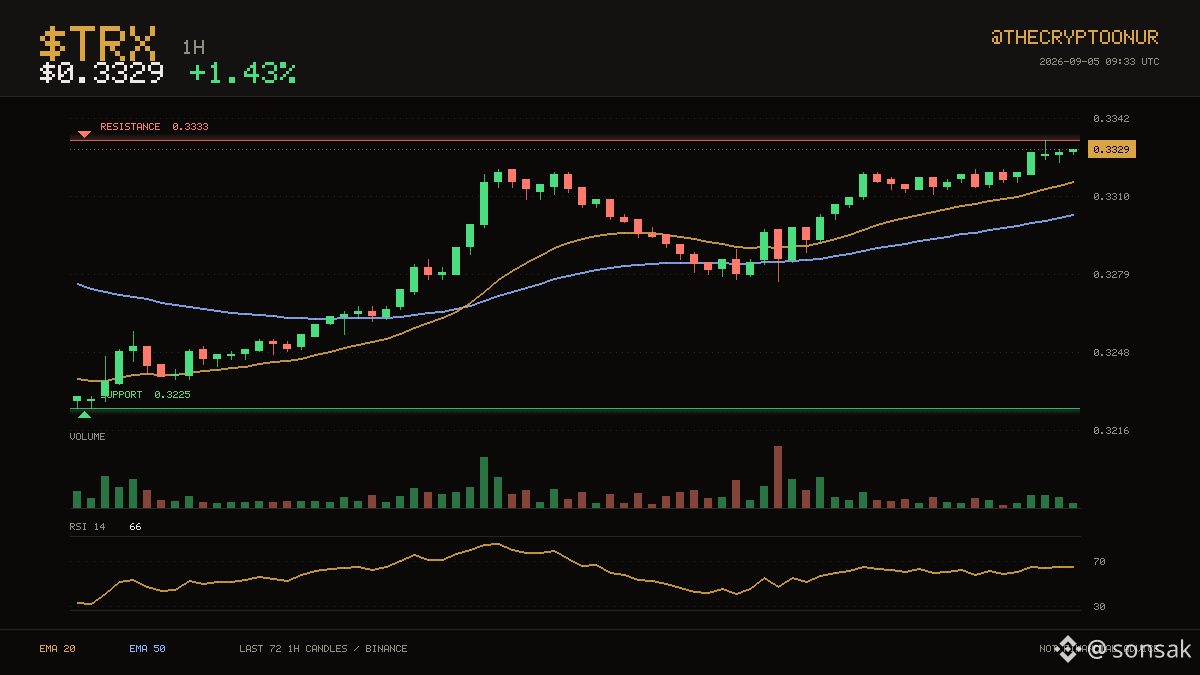
The last three days topped out near $0.3333, and price is pressing that area again. $TRX is trading at $0.3329, above both its 20 and 50 hourly averages. It is trading in the top third of the range right now. Resistance is only 0.1% away, so there is not much room before it matters. Averages have been ordered the same way for 44 candles, with the 20 above the 50. Momentum is mid range with RSI at 66. The 24 hour range runs $0.3276 to $0.3333, and price is near the top of it. Volume is close to normal at 0.8x the recent average. Up 1.4% over 24 hours.
Binance spot data. DYOR
$TRX #Binance
The last three days topped out near $0.3333, and price is pressing that area again. $TRX is trading at $0.3329, above both its 20 and 50 hourly averages. It is trading in the top third of the range right now. Resistance is only 0.1% away, so there is not much room before it matters. Averages have been ordered the same way for 44 candles, with the 20 above the 50. Momentum is mid range with RSI at 66. The 24 hour range runs $0.3276 to $0.3333, and price is near the top of it. Volume is close to normal at 0.8x the recent average. Up 1.4% over 24 hours.
Binance spot data. DYOR
$TRX #Binance
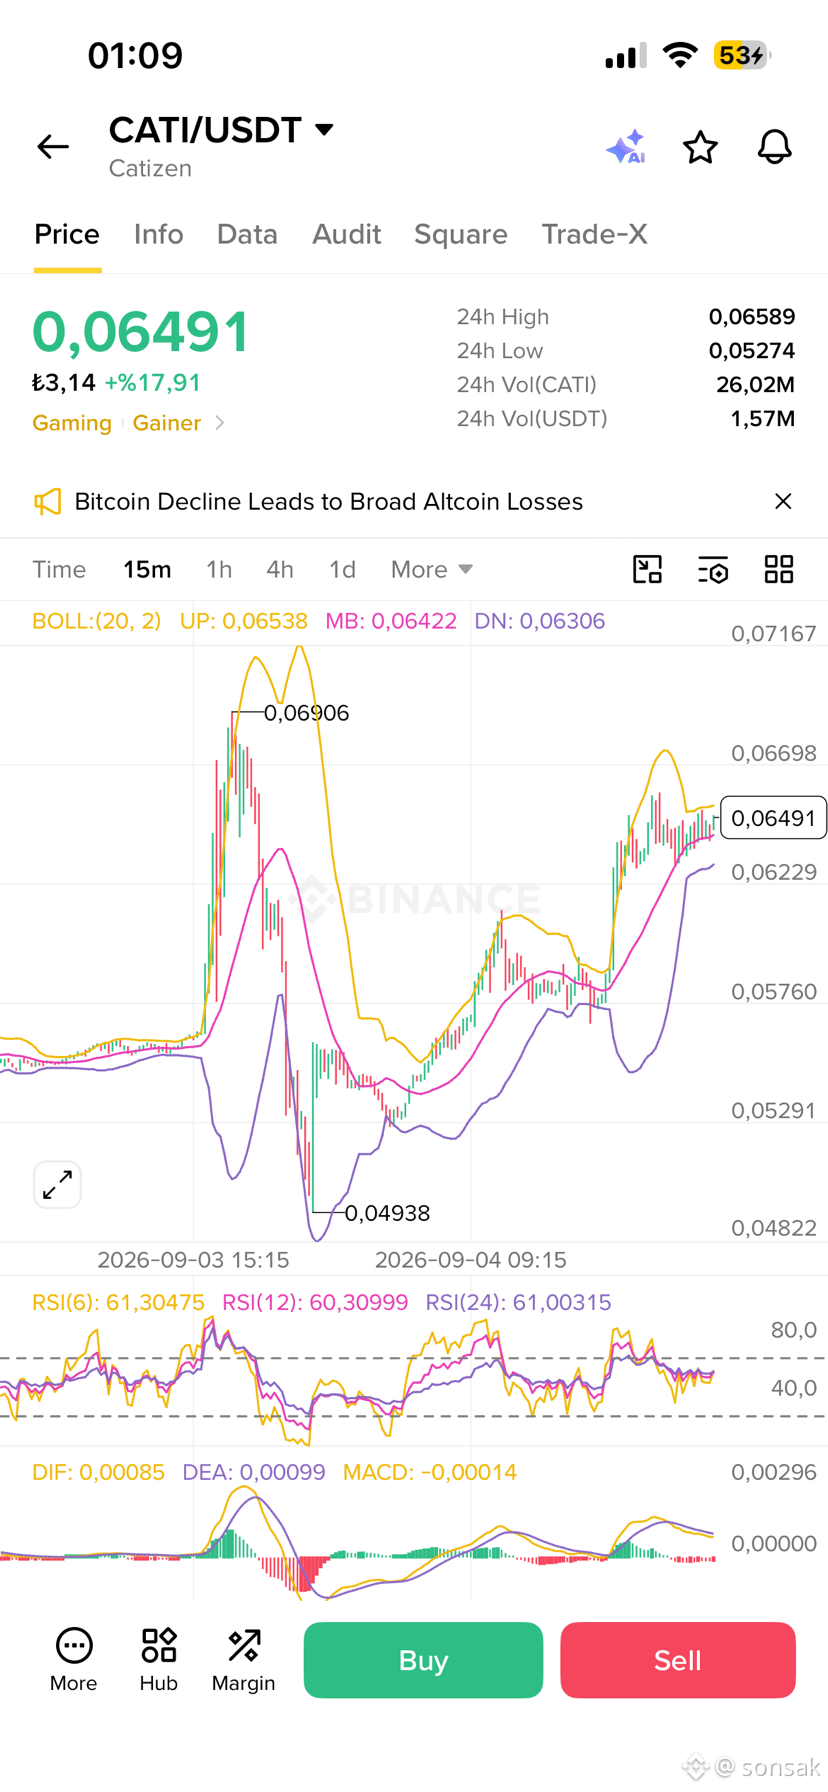
$CATI /USDT | Gaming-Tape lädt neu
**0.06449** | **+17.91%** | Hoch **0.06589** | Tief **0.05274**
Vol **1.57M USDT**. Gaming. Gewinner.
15m: abverkauft von **0.06906 → 0.04938**, dann V-Revival. Der Preis ist zurück im mittleren Band bei **0.06422** und klebt am oberen Bereich bei **0.06538**.
RSI ~**61** — da ist noch Luft. MACD flach/leicht rot. Kompression unter dem Hoch.
Level:
• Halten **0.06306–0.06422** = gespannt geladen
• Bruch **0.06589** → Retest von **0.06906**
• Verlust von **0.06229** → **0.05760**
Der erste Impuls ist bereits gedruckt. Das ist die Kerze der zweiten Chance. **0.0690** ist der Auslöser. Verpasst das, verpasst den Squeeze. $CATI
Keine Finanzberatung. Schnelles Gaming-Tape.
#CATI #Catizen #Gaming
**0.06449** | **+17.91%** | Hoch **0.06589** | Tief **0.05274**
Vol **1.57M USDT**. Gaming. Gewinner.
15m: abverkauft von **0.06906 → 0.04938**, dann V-Revival. Der Preis ist zurück im mittleren Band bei **0.06422** und klebt am oberen Bereich bei **0.06538**.
RSI ~**61** — da ist noch Luft. MACD flach/leicht rot. Kompression unter dem Hoch.
Level:
• Halten **0.06306–0.06422** = gespannt geladen
• Bruch **0.06589** → Retest von **0.06906**
• Verlust von **0.06229** → **0.05760**
Der erste Impuls ist bereits gedruckt. Das ist die Kerze der zweiten Chance. **0.0690** ist der Auslöser. Verpasst das, verpasst den Squeeze. $CATI
Keine Finanzberatung. Schnelles Gaming-Tape.
#CATI #Catizen #Gaming
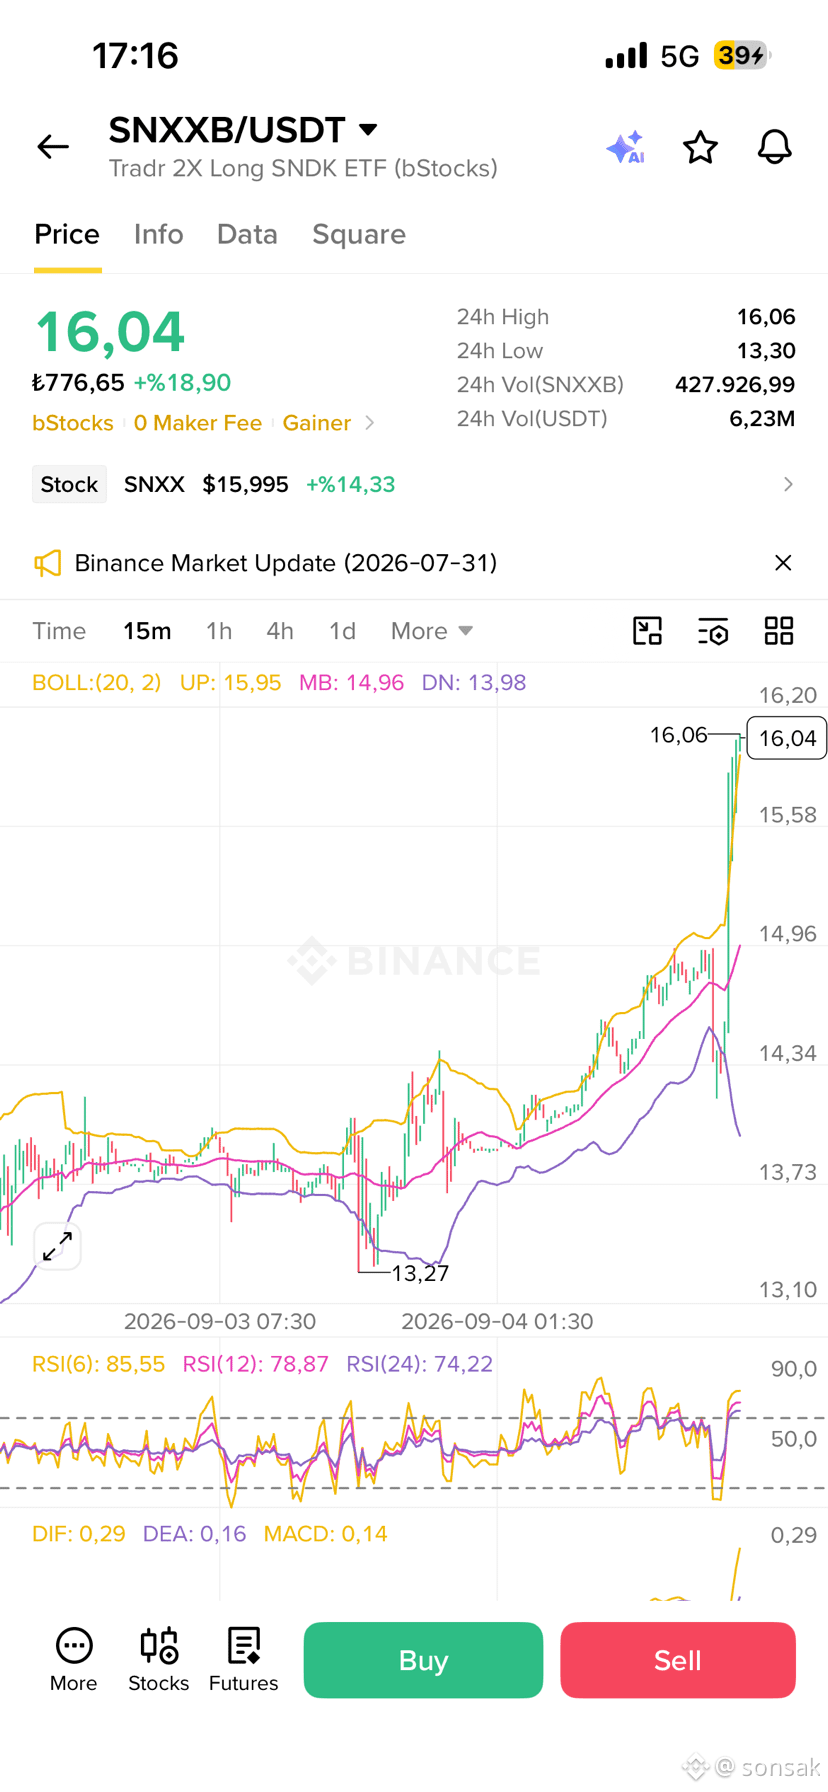
$SNXXB /USDT | 2x Sandisk Tape läuft
Das ist kein zufälliger Altcoin.
**SNXXB** = Tradr **2X Long SNDK ETF** auf Binance **bStocks**. Du handelst gehebeltes Sandisk-Exposure, 24/7.
Kurs: **16.04** | **+18.90%**
24h-Hoch **16.06** | 24h-Tief **13.30**
Volumen **6.23M USDT**. Basiswert **SNXX +14.33%**.
Chart (15m):
Basis bei **13.27** → Durchbruch durch das Mittelfeld **14.96** → Stoß an das obere Band **15.95** → Test von **16.06**.
Der Preis läuft am oberen Rand der Spanne. Bollinger weitet sich aus. Das ist ein Trend, kein Rauschen.
RSI: **85.55 / 78.87 / 74.22** — überdehnt.
MACD: **DIF 0.29 / DEA 0.16 / hist 0.14** — expandiert weiter. Überkauft + steigender MACD = spätes Momentum, kein toter Pump.
Levels:
• Unterstützung: **15.58** → **14.96** (mittleres BB) → **14.34** → **13.98** (unteres BB) → **13.27**
• Widerstand: **16.06–16.20** (Sitzungshoch / nächste runde Marke)
FOMO-Perspektive:
Die Börse ist geschlossen. Krypto ist offen. Genau das ist der gesamte bStocks-Trade. Wenn SNDK/SNXX in der Kassasitzung gefragt ist, kann SNXXB nach Börsenschluss weiter auslaufen. 2x bedeutet, dass die Bewegung bei der Aktie „klein“ aussieht und hier heftig wirkt. Späte Shorts auf einem 2x-Produkt werden mitgezogen.
Risiko, gleicher Satz:
2x zerfällt mit der Zeit. RSI ist heißgelaufen. Die erste rote Ausweitung zurück unter **15.58** kann schnell in Richtung **14.96** abverkaufen. Behandle das nicht wie $BTC. Ein schlechter US-Tape und der 2x wirkt in beide Richtungen.
Plan:
Hält **15.58** = Fortsetzung Richtung **16.20+**.
Fällt **14.96** = der Squeeze schwächt sich ab.
**13.27** ist die Invalidierung dieses Impulses.
Gehebelte tokenisierte Aktie. Hohes Risiko. Keine Anlageberatung.
#SNXXB #bStocks #SNDK #Sandisk
Das ist kein zufälliger Altcoin.
**SNXXB** = Tradr **2X Long SNDK ETF** auf Binance **bStocks**. Du handelst gehebeltes Sandisk-Exposure, 24/7.
Kurs: **16.04** | **+18.90%**
24h-Hoch **16.06** | 24h-Tief **13.30**
Volumen **6.23M USDT**. Basiswert **SNXX +14.33%**.
Chart (15m):
Basis bei **13.27** → Durchbruch durch das Mittelfeld **14.96** → Stoß an das obere Band **15.95** → Test von **16.06**.
Der Preis läuft am oberen Rand der Spanne. Bollinger weitet sich aus. Das ist ein Trend, kein Rauschen.
RSI: **85.55 / 78.87 / 74.22** — überdehnt.
MACD: **DIF 0.29 / DEA 0.16 / hist 0.14** — expandiert weiter. Überkauft + steigender MACD = spätes Momentum, kein toter Pump.
Levels:
• Unterstützung: **15.58** → **14.96** (mittleres BB) → **14.34** → **13.98** (unteres BB) → **13.27**
• Widerstand: **16.06–16.20** (Sitzungshoch / nächste runde Marke)
FOMO-Perspektive:
Die Börse ist geschlossen. Krypto ist offen. Genau das ist der gesamte bStocks-Trade. Wenn SNDK/SNXX in der Kassasitzung gefragt ist, kann SNXXB nach Börsenschluss weiter auslaufen. 2x bedeutet, dass die Bewegung bei der Aktie „klein“ aussieht und hier heftig wirkt. Späte Shorts auf einem 2x-Produkt werden mitgezogen.
Risiko, gleicher Satz:
2x zerfällt mit der Zeit. RSI ist heißgelaufen. Die erste rote Ausweitung zurück unter **15.58** kann schnell in Richtung **14.96** abverkaufen. Behandle das nicht wie $BTC. Ein schlechter US-Tape und der 2x wirkt in beide Richtungen.
Plan:
Hält **15.58** = Fortsetzung Richtung **16.20+**.
Fällt **14.96** = der Squeeze schwächt sich ab.
**13.27** ist die Invalidierung dieses Impulses.
Gehebelte tokenisierte Aktie. Hohes Risiko. Keine Anlageberatung.
#SNXXB #bStocks #SNDK #Sandisk
$MarsCoin /USDT | Vertikale Kerze, erster Rücksetzer
Das ist ein Meme-Tape, kein langsames Dahinschleichen.
Preis **0.1691** | **+54.43%** | 24h-Hoch **0.1888** | 24h-Tief **0.1095**
Volumen: **83.30M MARSCOIN** / **14.32M USDT**
Was der 15m-Chart gerade gemacht hat:
Eine Kerze hat den Kurs von **0.1095 → 0.1888** gehoben. Das ist keine Akkumulation. Das ist Zündung.
Jetzt steht er nach der ersten roten Ablehnung bei **0.1691**. Klassische Struktur der ersten Welle: Spike → Shakeout → Entscheidung.
Levels:
• Unterstützung: **0.1579** → **0.1404** → **0.1230** → **0.1095** (Session-Tief / Invalidierung)
• Widerstand: **0.1753** → **0.1888** (Hoch) → **0.1928**
Hält **0.1579–0.1690**, dann ist das ein Reload, kein Top.
Erholt sich **0.1753** zurück, wird das Hoch bei **0.1888** erneut angegriffen.
Verliert **0.1404** und der Pump war nur ein Docht.
Schlagzeile auf dem Bildschirm: eine **Sniper-Wallet hat den ganzen Bag gedumpt**. Das ist das erste Liquiditätsereignis. Schwache Hände geraten in Panik, späte Longs werden abgespült, das nächste Bid stirbt entweder… oder wird sauberer.
FOMO-Winkel:
Top-Gainer-Liste. Dünne Float-Energie. Wenn ein Meme einen vertikalen +50%-Move druckt und nur einen Teil der Range wieder abgibt, sucht CT die zweite Welle. Zweite Wellen zahlen mehr als die erste, wenn das Tief hält. Sie löschen aber auch Konten, wenn man dem Docht mit Größe hinterherjagt.
Plan, kein Hopium:
Beobachte **0.1579**.
Bruch und Halt über **0.1753**.
Ziel ist der Retest von **0.1888**.
Wenn **0.1095** bricht, ist der Film für diese Session vorbei. $MARSCOIN
Meme. Hohes Risiko. Schnelles Tape. NFA.
#MARSCOIN #MARSCOINUSDT #MemeCoins
Das ist ein Meme-Tape, kein langsames Dahinschleichen.
Preis **0.1691** | **+54.43%** | 24h-Hoch **0.1888** | 24h-Tief **0.1095**
Volumen: **83.30M MARSCOIN** / **14.32M USDT**
Was der 15m-Chart gerade gemacht hat:
Eine Kerze hat den Kurs von **0.1095 → 0.1888** gehoben. Das ist keine Akkumulation. Das ist Zündung.
Jetzt steht er nach der ersten roten Ablehnung bei **0.1691**. Klassische Struktur der ersten Welle: Spike → Shakeout → Entscheidung.
Levels:
• Unterstützung: **0.1579** → **0.1404** → **0.1230** → **0.1095** (Session-Tief / Invalidierung)
• Widerstand: **0.1753** → **0.1888** (Hoch) → **0.1928**
Hält **0.1579–0.1690**, dann ist das ein Reload, kein Top.
Erholt sich **0.1753** zurück, wird das Hoch bei **0.1888** erneut angegriffen.
Verliert **0.1404** und der Pump war nur ein Docht.
Schlagzeile auf dem Bildschirm: eine **Sniper-Wallet hat den ganzen Bag gedumpt**. Das ist das erste Liquiditätsereignis. Schwache Hände geraten in Panik, späte Longs werden abgespült, das nächste Bid stirbt entweder… oder wird sauberer.
FOMO-Winkel:
Top-Gainer-Liste. Dünne Float-Energie. Wenn ein Meme einen vertikalen +50%-Move druckt und nur einen Teil der Range wieder abgibt, sucht CT die zweite Welle. Zweite Wellen zahlen mehr als die erste, wenn das Tief hält. Sie löschen aber auch Konten, wenn man dem Docht mit Größe hinterherjagt.
Plan, kein Hopium:
Beobachte **0.1579**.
Bruch und Halt über **0.1753**.
Ziel ist der Retest von **0.1888**.
Wenn **0.1095** bricht, ist der Film für diese Session vorbei. $MARSCOIN
Meme. Hohes Risiko. Schnelles Tape. NFA.
#MARSCOIN #MARSCOINUSDT #MemeCoins
Übersetzung ansehen
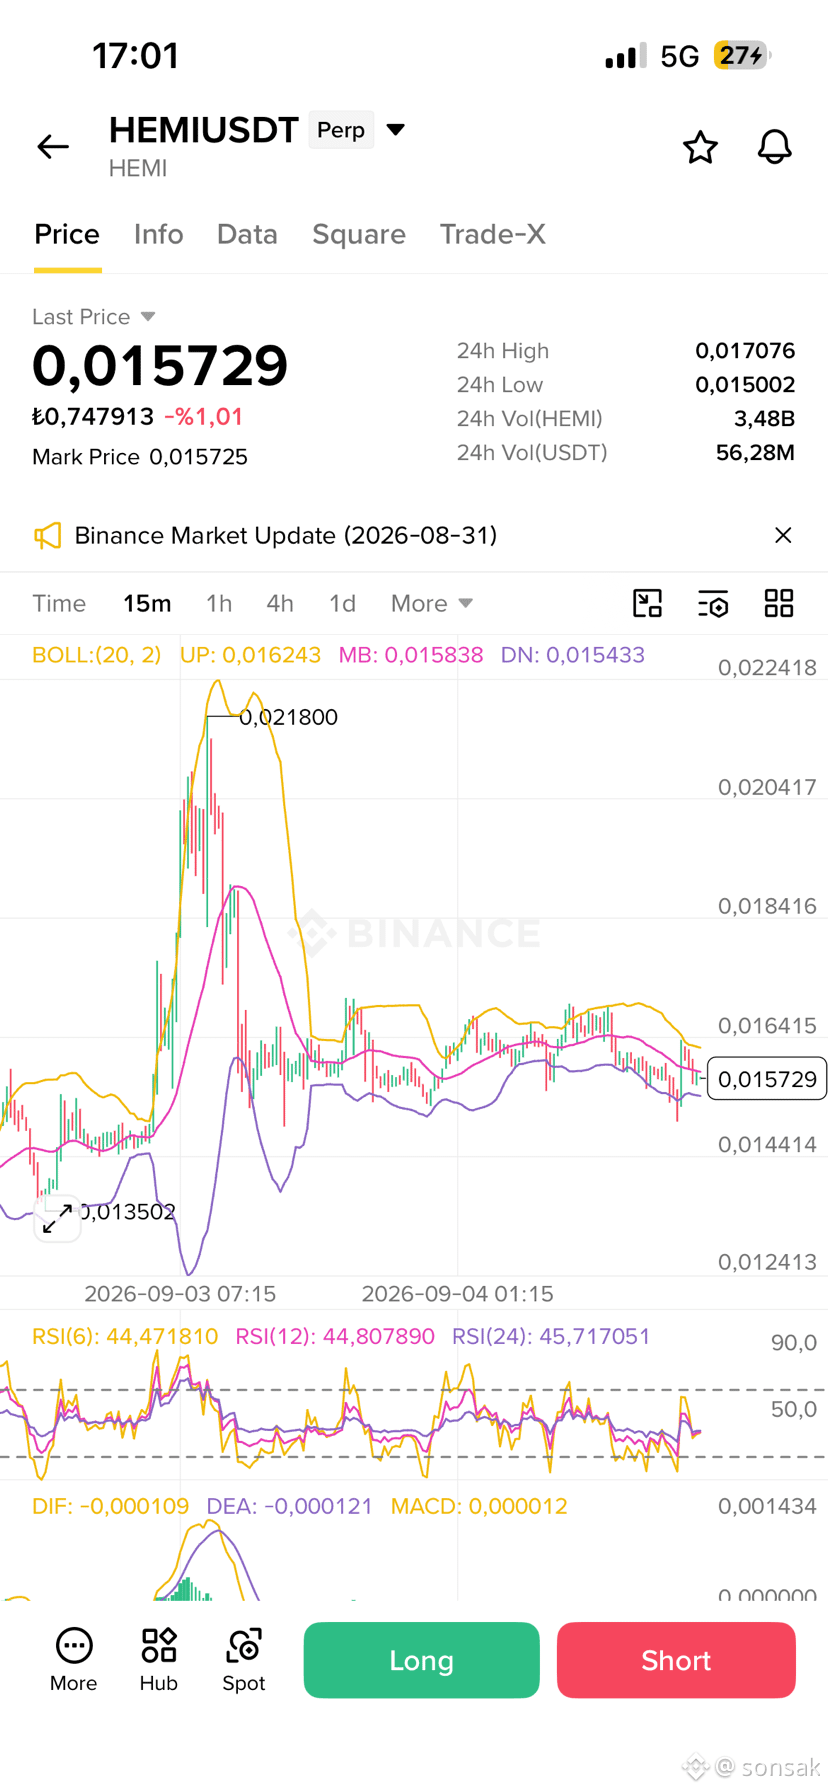
$HEMI /USDT | This Dip Won’t Stay Quiet
Hemi is a Bitcoin + Ethereum modular L2: programmable Bitcoin, hVM, Proof-of-Proof, BTCFi. Backed by Jeff Garzik and YZi Labs (formerly Binance Labs). Listed on Binance. The story is not empty.
Chart right now:
Price ~$0.016.
~+40% on 7D, ~+230% on 30D.
ATH ~$0.19. Still ~10x below the high.
Circulating ~977M vs 10B max — when flow returns, moves get violent.
Recent tape:
• Sep 2 wick: $0.0112 → $0.0225
• Sep 3 high near $0.0215
• Now digesting in $0.0151–$0.0170
This is not “the move is over.” This is the first-wave pullback.
Levels:
• Support: $0.0151 → $0.0142 → $0.0115
• Resistance: $0.0171 → $0.0215–$0.0225 → $0.030
Hold $0.015 = reload zone.
Daily close above $0.0225 = second leg / price discovery.
Why the FOMO now?
While CT is glued to $ZEC and $DASH, $HEMI is still a small cap. When the Bitcoin L2 / BTCFi bid rotates, these names get bought late — and late entries pay more.
Risks are real: large max supply, unlock pressure, sharp red candles. Do not ape size. Have a plan.
Scenario I’m watching:
Hold above $0.015 → break $0.0171 → retest $0.0225.
If that high goes, the real expansion starts.
NFA. Your risk, your call.
#HEMI #HEMIUSDT #BTCFi #BitcoinL2
Hemi is a Bitcoin + Ethereum modular L2: programmable Bitcoin, hVM, Proof-of-Proof, BTCFi. Backed by Jeff Garzik and YZi Labs (formerly Binance Labs). Listed on Binance. The story is not empty.
Chart right now:
Price ~$0.016.
~+40% on 7D, ~+230% on 30D.
ATH ~$0.19. Still ~10x below the high.
Circulating ~977M vs 10B max — when flow returns, moves get violent.
Recent tape:
• Sep 2 wick: $0.0112 → $0.0225
• Sep 3 high near $0.0215
• Now digesting in $0.0151–$0.0170
This is not “the move is over.” This is the first-wave pullback.
Levels:
• Support: $0.0151 → $0.0142 → $0.0115
• Resistance: $0.0171 → $0.0215–$0.0225 → $0.030
Hold $0.015 = reload zone.
Daily close above $0.0225 = second leg / price discovery.
Why the FOMO now?
While CT is glued to $ZEC and $DASH, $HEMI is still a small cap. When the Bitcoin L2 / BTCFi bid rotates, these names get bought late — and late entries pay more.
Risks are real: large max supply, unlock pressure, sharp red candles. Do not ape size. Have a plan.
Scenario I’m watching:
Hold above $0.015 → break $0.0171 → retest $0.0225.
If that high goes, the real expansion starts.
NFA. Your risk, your call.
#HEMI #HEMIUSDT #BTCFi #BitcoinL2
Übersetzung ansehen
$LINK Technical Analysis | Oracle / RWA Bid Is Back
Chainlink is back in the conversation with RWA and CCIP flow. $LINK is trading near $11.60–$12.10 after an ~8% bounce.
Structure: • Short-term trend has flipped up from the $10–$11 base. • Resistance: $12.20–$12.50, then $13.00–$13.50. • Support: $11.40, $11.00, then $10.20–$10.50.
What matters: LINK usually follows BTC/ETH risk-on plus RWA headlines. A hold above $11.50 keeps higher-low structure intact. A rejection at $12.50 with falling volume would signal just a relief bounce.
Bias: Cautiously bullish above $11.00. Need a daily close over $12.50 to confirm continuation. Break of $10.50 weakens the setup. $LINK
Not financial advice.
#LINK #Chainlink #RWA
#USAugustAvgHourlyEarningsRise3.1%
Chainlink is back in the conversation with RWA and CCIP flow. $LINK is trading near $11.60–$12.10 after an ~8% bounce.
Structure: • Short-term trend has flipped up from the $10–$11 base. • Resistance: $12.20–$12.50, then $13.00–$13.50. • Support: $11.40, $11.00, then $10.20–$10.50.
What matters: LINK usually follows BTC/ETH risk-on plus RWA headlines. A hold above $11.50 keeps higher-low structure intact. A rejection at $12.50 with falling volume would signal just a relief bounce.
Bias: Cautiously bullish above $11.00. Need a daily close over $12.50 to confirm continuation. Break of $10.50 weakens the setup. $LINK
Not financial advice.
#LINK #Chainlink #RWA
#USAugustAvgHourlyEarningsRise3.1%
$SOL Technische Analyse | Struktur intakt, Momentum lässt nach
Solana ist weiterhin ein viel diskutiertes L1. Der Preis liegt bei etwa 104 $, nachdem er rund 106 $ markiert und wieder auf den 103-$-Pivot zurückgefallen ist.
Struktur: • Der tägliche Trend bleibt bullisch. Der Preis liegt über EMA20 (~96 $), EMA50 (~88 $) und EMA200 (~90 $). • Marke der Entscheidung: 103–104 $. Halten = erneuter Test von 106–110 $. • Aufwärtspotenzial: 106 $, 110–115 $. • Unterstützung: 101,60 $, 100 $ und dann 94–96 $ (EMA20 / mittlerer Bandbereich).
Momentum: RSI ~67. Nicht extrem. Der MACD flacht ab, also ist dies eine Entscheidungszone, kein Blow-off.
Bias: Bullisch oberhalb von 100 $. Ein Tagesschluss über 104–106 $ öffnet den Weg zu 110–115 $. Ein Schlusskurs unter 100 $ bringt 94 $ wieder ins Spiel.
Keine Finanzberatung. $SOL
#SOL #Solana #CryptoTA
#USWeeklyInitialJoblessClaimsRiseTo206000
Solana ist weiterhin ein viel diskutiertes L1. Der Preis liegt bei etwa 104 $, nachdem er rund 106 $ markiert und wieder auf den 103-$-Pivot zurückgefallen ist.
Struktur: • Der tägliche Trend bleibt bullisch. Der Preis liegt über EMA20 (~96 $), EMA50 (~88 $) und EMA200 (~90 $). • Marke der Entscheidung: 103–104 $. Halten = erneuter Test von 106–110 $. • Aufwärtspotenzial: 106 $, 110–115 $. • Unterstützung: 101,60 $, 100 $ und dann 94–96 $ (EMA20 / mittlerer Bandbereich).
Momentum: RSI ~67. Nicht extrem. Der MACD flacht ab, also ist dies eine Entscheidungszone, kein Blow-off.
Bias: Bullisch oberhalb von 100 $. Ein Tagesschluss über 104–106 $ öffnet den Weg zu 110–115 $. Ein Schlusskurs unter 100 $ bringt 94 $ wieder ins Spiel.
Keine Finanzberatung. $SOL
#SOL #Solana #CryptoTA
#USWeeklyInitialJoblessClaimsRiseTo206000
Übersetzung ansehen
$UNI Technical Analysis | DeFi Beta Is Waking Up
Uniswap is one of the strongest large-cap DeFi names this week. $UNI is trading near $6.38 after breaking a long base under $5. Volume is elevated (~$880M).
Structure: • Rounded-bottom breakout above $5.00–$5.69 is the key shift. • Immediate resistance: $6.52, then $7.00, then $8.00. • Bigger weekly hurdle: ~$7.80 (200-week EMA area). • Support: $5.84–$5.69, then $5.00, then $4.60 (20 EMA).
Momentum: Daily RSI is stretched (high 70s to ~80). Trend is up, but the first move is extended. A retest of $5.70–$5.85 would be healthier than a blind breakout chase.
Bias: Bullish while $5.69 holds. Close above $6.52 keeps $7–$8 in play. Weekly close back under $5 would invalidate the breakout.
Not financial advice. $UNI
#UNI #Uniswap #DeFi
Uniswap is one of the strongest large-cap DeFi names this week. $UNI is trading near $6.38 after breaking a long base under $5. Volume is elevated (~$880M).
Structure: • Rounded-bottom breakout above $5.00–$5.69 is the key shift. • Immediate resistance: $6.52, then $7.00, then $8.00. • Bigger weekly hurdle: ~$7.80 (200-week EMA area). • Support: $5.84–$5.69, then $5.00, then $4.60 (20 EMA).
Momentum: Daily RSI is stretched (high 70s to ~80). Trend is up, but the first move is extended. A retest of $5.70–$5.85 would be healthier than a blind breakout chase.
Bias: Bullish while $5.69 holds. Close above $6.52 keeps $7–$8 in play. Weekly close back under $5 would invalidate the breakout.
Not financial advice. $UNI
#UNI #Uniswap #DeFi
Übersetzung ansehen
$DASH Technical Analysis | Privacy Rotation Is Spreading
Dash is riding the same privacy wave as $ZEC. Price is around $50–$53 after a +17% to +26% session, with a high near $54.60. Volume is well above average.
Structure: • Daily trend is bullish. Price is above the 20/50/100/200 EMAs. • Breakout zone: $46.40–$48. Holding this area keeps the move valid. • Resistance: $54–$55, then $58–$62. • Support: $48–$50, then $44–$45, then $41.80.
Momentum: RSI is overbought on the daily (mid-70s). That fits a strong trend, but chasing the wick is poor R/R. Better setup is a pullback into $48–$50.
Bias: Bullish above $46.40. Daily close over $55 opens $58–$62. Loss of $44 weakens the breakout. $DASH
Not financial advice. High volatility.
#DASH #PrivacyCoins #CryptoTA #BTCTops$80K
Dash is riding the same privacy wave as $ZEC. Price is around $50–$53 after a +17% to +26% session, with a high near $54.60. Volume is well above average.
Structure: • Daily trend is bullish. Price is above the 20/50/100/200 EMAs. • Breakout zone: $46.40–$48. Holding this area keeps the move valid. • Resistance: $54–$55, then $58–$62. • Support: $48–$50, then $44–$45, then $41.80.
Momentum: RSI is overbought on the daily (mid-70s). That fits a strong trend, but chasing the wick is poor R/R. Better setup is a pullback into $48–$50.
Bias: Bullish above $46.40. Daily close over $55 opens $58–$62. Loss of $44 weakens the breakout. $DASH
Not financial advice. High volatility.
#DASH #PrivacyCoins #CryptoTA #BTCTops$80K
Übersetzung ansehen
🟢 $SNDKB · 1H
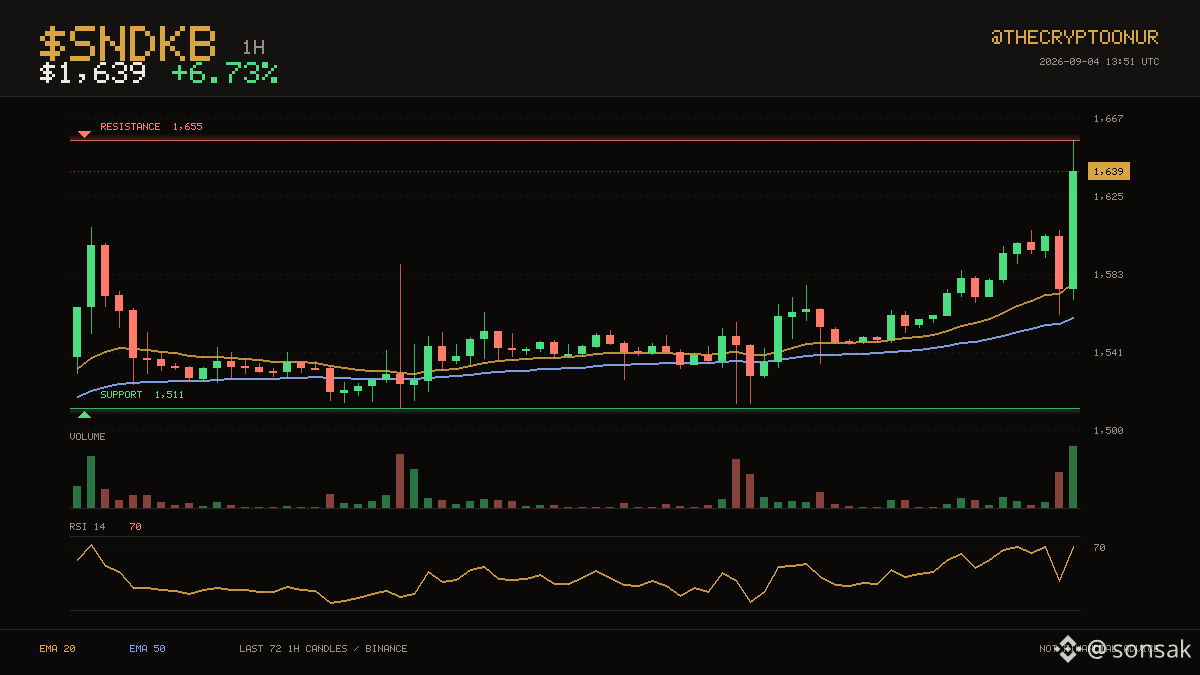
$1,639 keeps $SNDKB on the stronger side of its hourly averages. The last three days topped out near $1,655, and price is pressing that area again. It is trading in the top third of the range right now. Resistance is only 1.0% away, so there is not much room before it matters. Averages have been ordered the same way for a long stretch now, with the 20 above the 50. At 70 on RSI the move is getting hot. The 24 hour range runs $1,514 to $1,655, and price is near the top of it. Volume is close to normal at 1.2x the recent average. Up 6.7% over 24 hours.
⚠️ DYOR
$SNDKB #Crypto
$1,639 keeps $SNDKB on the stronger side of its hourly averages. The last three days topped out near $1,655, and price is pressing that area again. It is trading in the top third of the range right now. Resistance is only 1.0% away, so there is not much room before it matters. Averages have been ordered the same way for a long stretch now, with the 20 above the 50. At 70 on RSI the move is getting hot. The 24 hour range runs $1,514 to $1,655, and price is near the top of it. Volume is close to normal at 1.2x the recent average. Up 6.7% over 24 hours.
⚠️ DYOR
$SNDKB #Crypto
HYPE Technische Analyse | Perp-DEX-Leader weiterhin im Fokus
Hyperliquid bleibt einer der meistdiskutierten Infrastruktur-Tokens. $HYPE wird nahe $85–$87 gehandelt, nachdem ein lokales ATH um $88 erreicht wurde. Die Marktkapitalisierung liegt im oberen zweistelligen Milliardenbereich, mit starkem Volumen und anhaltender Buyback-Erzählung.
Struktur: • Der Preis liegt auf dem 4H über den 21/55/200 EMAs. • Unmittelbarer Widerstand: $88–$90 (ATH / Kanaloberkante). • Erweiterungsziele bei einem Ausbruch: $94–$95, dann $100–$104. • Unterstützung: $84.50, $81, dann $78.50–$79.
Momentum: Der RSI ist erhöht, aber nicht so überdehnt wie bei $ZEC. Der ADX ist stark, also ist der Trend real. Beobachte den Unlock am 6. Sep. (~9.92M HYPE) — das kann kurzfristig Angebot erzeugen.
Bias: Bullisch über $81. Ein 4H-Schluss über $88.20 öffnet den Weg zu $94–$100. Ein Verlust von $78.50 schwächt die Struktur und bringt $72–$75 wieder ins Spiel.
Starke Story + echte Gebühren, aber Unlocks und Hebel können in beide Richtungen wirken. Keine Finanzberatung. $HYPE
#HYPE #Hyperliquid #CryptoTA
#BitcoinEthereumHitMultiMonthHighs
Hyperliquid bleibt einer der meistdiskutierten Infrastruktur-Tokens. $HYPE wird nahe $85–$87 gehandelt, nachdem ein lokales ATH um $88 erreicht wurde. Die Marktkapitalisierung liegt im oberen zweistelligen Milliardenbereich, mit starkem Volumen und anhaltender Buyback-Erzählung.
Struktur: • Der Preis liegt auf dem 4H über den 21/55/200 EMAs. • Unmittelbarer Widerstand: $88–$90 (ATH / Kanaloberkante). • Erweiterungsziele bei einem Ausbruch: $94–$95, dann $100–$104. • Unterstützung: $84.50, $81, dann $78.50–$79.
Momentum: Der RSI ist erhöht, aber nicht so überdehnt wie bei $ZEC. Der ADX ist stark, also ist der Trend real. Beobachte den Unlock am 6. Sep. (~9.92M HYPE) — das kann kurzfristig Angebot erzeugen.
Bias: Bullisch über $81. Ein 4H-Schluss über $88.20 öffnet den Weg zu $94–$100. Ein Verlust von $78.50 schwächt die Struktur und bringt $72–$75 wieder ins Spiel.
Starke Story + echte Gebühren, aber Unlocks und Hebel können in beide Richtungen wirken. Keine Finanzberatung. $HYPE
#HYPE #Hyperliquid #CryptoTA
#BitcoinEthereumHitMultiMonthHighs
Übersetzung ansehen
HEY #CRCL / $CRCLB
$CRCLB Technical Analysis | Tokenized Circle Is in Play
Circle (CRCL) is one of the hottest TradFi-crypto names. On Binance, the tokenized version $CRCLB is tracking the stock and sitting among the top gainers (recent prints around $101–$103, +13% to +15% sessions).
Why it is talked about: USDC growth, bank-charter narrative, tokenization, and 24/7 crypto access to a listed stablecoin issuer.
Structure (treat CRCLB as a proxy for CRCL): • Short-term trend is bullish after the bounce from the $50s–$60s region earlier this year. • Near-term resistance: $107–$110, then the $120–$136 analyst zone / prior supply. • Support: $97–$100, then $90, then $80.
What to watch: • Does CRCLB hold above $100 on daily closes? • Equity-session gaps vs 24/7 crypto trading can create wicks. • Broader stablecoin / RWA sentiment still drives this name more than pure crypto TA.
Bias: Bullish above $97–$100. A daily close back under $90 would signal the rally is fading.
This is tokenized equity exposure, not a native L1 coin. Different risk profile. DYOR. Not financial advice.
$CRCLB Technical Analysis | Tokenized Circle Is in Play
Circle (CRCL) is one of the hottest TradFi-crypto names. On Binance, the tokenized version $CRCLB is tracking the stock and sitting among the top gainers (recent prints around $101–$103, +13% to +15% sessions).
Why it is talked about: USDC growth, bank-charter narrative, tokenization, and 24/7 crypto access to a listed stablecoin issuer.
Structure (treat CRCLB as a proxy for CRCL): • Short-term trend is bullish after the bounce from the $50s–$60s region earlier this year. • Near-term resistance: $107–$110, then the $120–$136 analyst zone / prior supply. • Support: $97–$100, then $90, then $80.
What to watch: • Does CRCLB hold above $100 on daily closes? • Equity-session gaps vs 24/7 crypto trading can create wicks. • Broader stablecoin / RWA sentiment still drives this name more than pure crypto TA.
Bias: Bullish above $97–$100. A daily close back under $90 would signal the rally is fading.
This is tokenized equity exposure, not a native L1 coin. Different risk profile. DYOR. Not financial advice.
Übersetzung ansehen
$ZEC Technical Analysis | Privacy Narrative Is Live
Zcash is one of the most discussed coins right now after breaking above the 2018 high near $900 and pushing into the $970–$1,020 zone. 24h performance is strong (roughly +15% to +22% depending on the print), with volume expanding above $1B.
Structure: • Daily trend remains firmly bullish. Price is above the 20/50/100/200 EMAs. • Key breakout zone: $888–$900 (old high + Fib anchor). Holding this area keeps the uptrend intact. • Next resistance: $1,058 (127.2% Fib extension), then $1,115–$1,322 if momentum continues. • Support: $888, then $845 (50 EMA), then $773.
Momentum: RSI is overbought (mid-70s to ~80). That does not kill the trend, but it raises the chance of a pullback or sideways digestion before the next leg.
Bias: Bullish while $888 holds. A clean 4H/daily close above $1,058 opens $1,300+. Failure back under $845 would cool the move and target $773.
Not financial advice. High volatility. Manage risk.
$ZEC
Zcash is one of the most discussed coins right now after breaking above the 2018 high near $900 and pushing into the $970–$1,020 zone. 24h performance is strong (roughly +15% to +22% depending on the print), with volume expanding above $1B.
Structure: • Daily trend remains firmly bullish. Price is above the 20/50/100/200 EMAs. • Key breakout zone: $888–$900 (old high + Fib anchor). Holding this area keeps the uptrend intact. • Next resistance: $1,058 (127.2% Fib extension), then $1,115–$1,322 if momentum continues. • Support: $888, then $845 (50 EMA), then $773.
Momentum: RSI is overbought (mid-70s to ~80). That does not kill the trend, but it raises the chance of a pullback or sideways digestion before the next leg.
Bias: Bullish while $888 holds. A clean 4H/daily close above $1,058 opens $1,300+. Failure back under $845 would cool the move and target $773.
Not financial advice. High volatility. Manage risk.
$ZEC
Übersetzung ansehen
🔴 $PAXG · 1D
At $4,399, $PAXG is sitting right in the middle of its daily averages. $3,945 on the low side and $4,689 on the high side have contained the last two months. That puts price in the middle of the range. That is 6.6% to the ceiling and 10.3% to the floor. The 20 has stayed above the 50 for 27 candles. RSI at 48 is neutral, so momentum is not blocking a move either way. Over the past day it has traded between $4,375 and $4,512, sitting near the bottom of it now. Turnover is unremarkable, running 1.0x the recent average. Down 2.0% over 24 hours.
DYOR
$PAXG #TechnicalAnalysis
#USAugustJobGrowthNearlyTriplesForecast
At $4,399, $PAXG is sitting right in the middle of its daily averages. $3,945 on the low side and $4,689 on the high side have contained the last two months. That puts price in the middle of the range. That is 6.6% to the ceiling and 10.3% to the floor. The 20 has stayed above the 50 for 27 candles. RSI at 48 is neutral, so momentum is not blocking a move either way. Over the past day it has traded between $4,375 and $4,512, sitting near the bottom of it now. Turnover is unremarkable, running 1.0x the recent average. Down 2.0% over 24 hours.
DYOR
$PAXG #TechnicalAnalysis
#USAugustJobGrowthNearlyTriplesForecast
https://binance-tr.onelink.me/a2LU/cc?pid=contentcreators&c=Spatula&af_adset=All
Anmelden und weiter Inhalte entdecken