
ProTrader365
153 Beiträge

ProTrader365
Melden
Nutzer blockieren
"Over 8 years in crypto have taught us one thing: winning isn’t luck; it’s strategy. We're here to help you master yours." ProTrader | Investor | Content Creator | Analyzer
0 Following
1 Follower
6 Like gegeben
Beiträge
·
--
Übersetzung ansehen
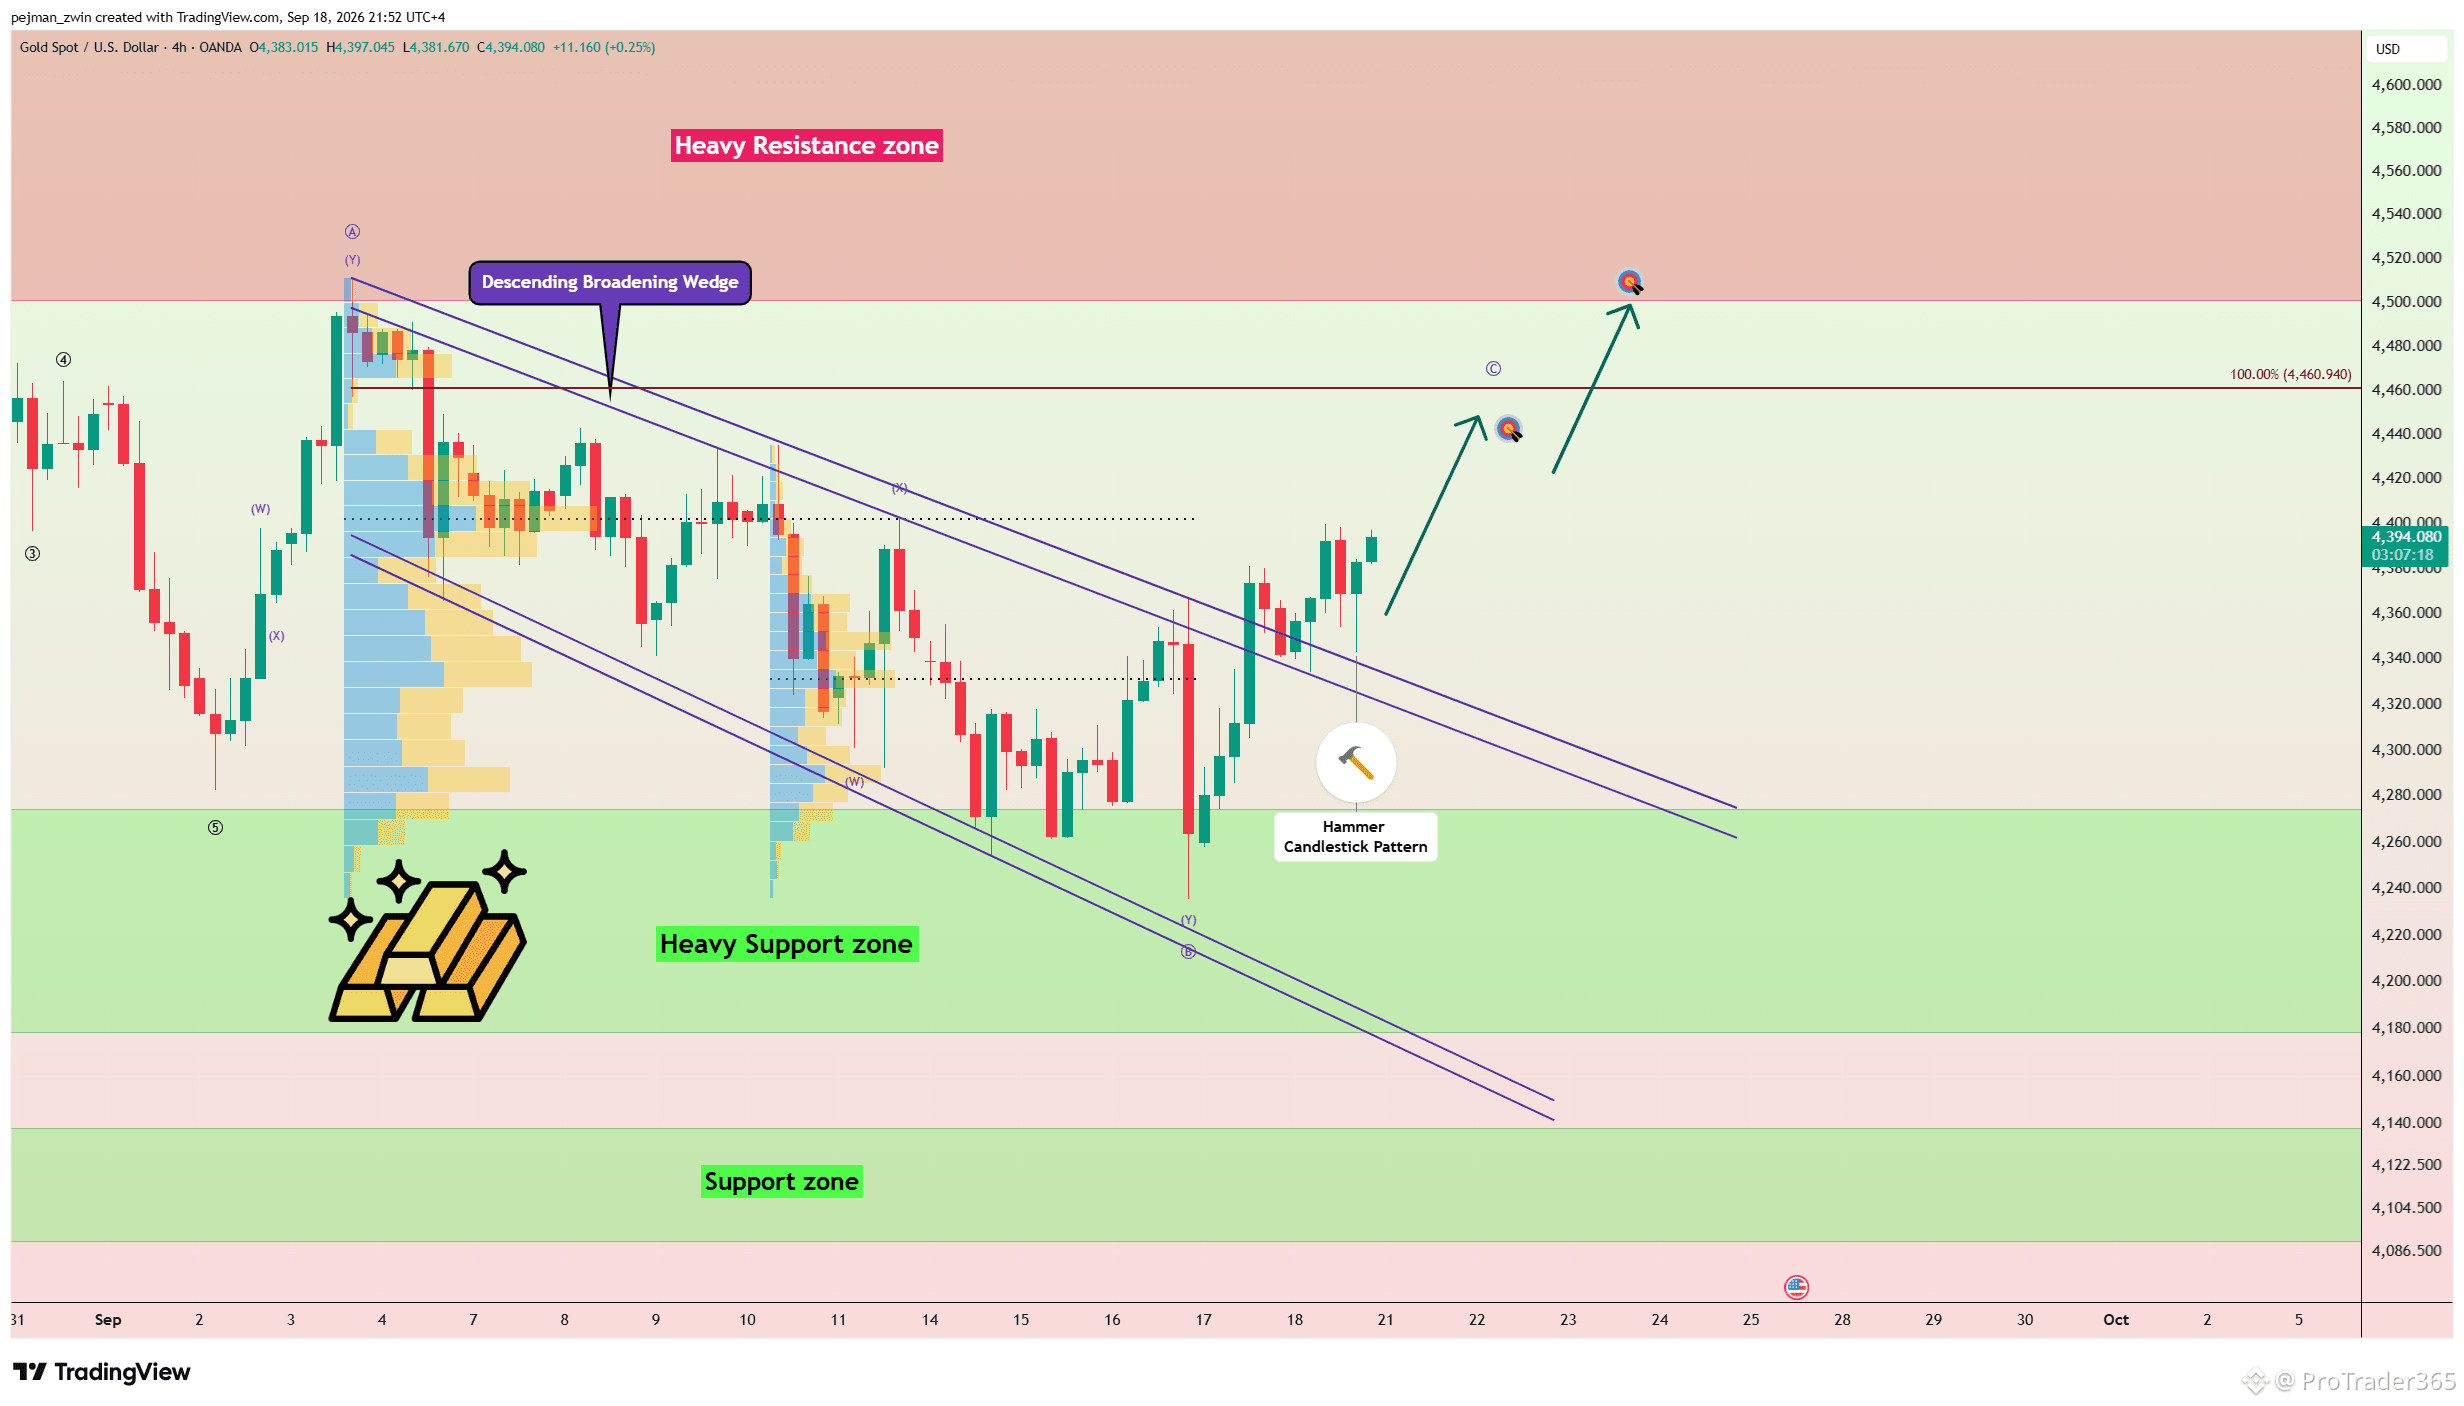
$XAUt Breaks the Descending Broadening Wedge — Can Gold Reach $4,487? Gold has successfully broken above the upper trendline of the Descending Broadening Wedge Pattern and is currently trading above the pattern, increasing the probability of another bullish move. Technical Analysis The breakout suggests that bearish pressure may be weakening and buyers are attempting to regain control. However, the key $4,400 trading level remains the main confirmation level for stronger bullish momentum. I expect gold, after successfully breaking above $4,400, to rise at least toward $4,443. If bullish momentum increases, the move could extend toward $4,487. First Take Profit(TP): $4,443 Second Take Profit(TP): $4,487 Stop Loss(SL): $4,321(Worst) Can gold confirm the breakout above $4,400 and extend the rally toward $4,487? #Gold
$XAUt Breaks the Descending Broadening Wedge — Can Gold Reach $4,487? Gold has successfully broken above the upper trendline of the Descending Broadening Wedge Pattern and is currently trading above the pattern, increasing the probability of another bullish move. Technical Analysis The breakout suggests that bearish pressure may be weakening and buyers are attempting to regain control. However, the key $4,400 trading level remains the main confirmation level for stronger bullish momentum. I expect gold, after successfully breaking above $4,400, to rise at least toward $4,443. If bullish momentum increases, the move could extend toward $4,487. First Take Profit(TP): $4,443 Second Take Profit(TP): $4,487 Stop Loss(SL): $4,321(Worst) Can gold confirm the breakout above $4,400 and extend the rally toward $4,487? #Gold
61
·
--
Übersetzung ansehen
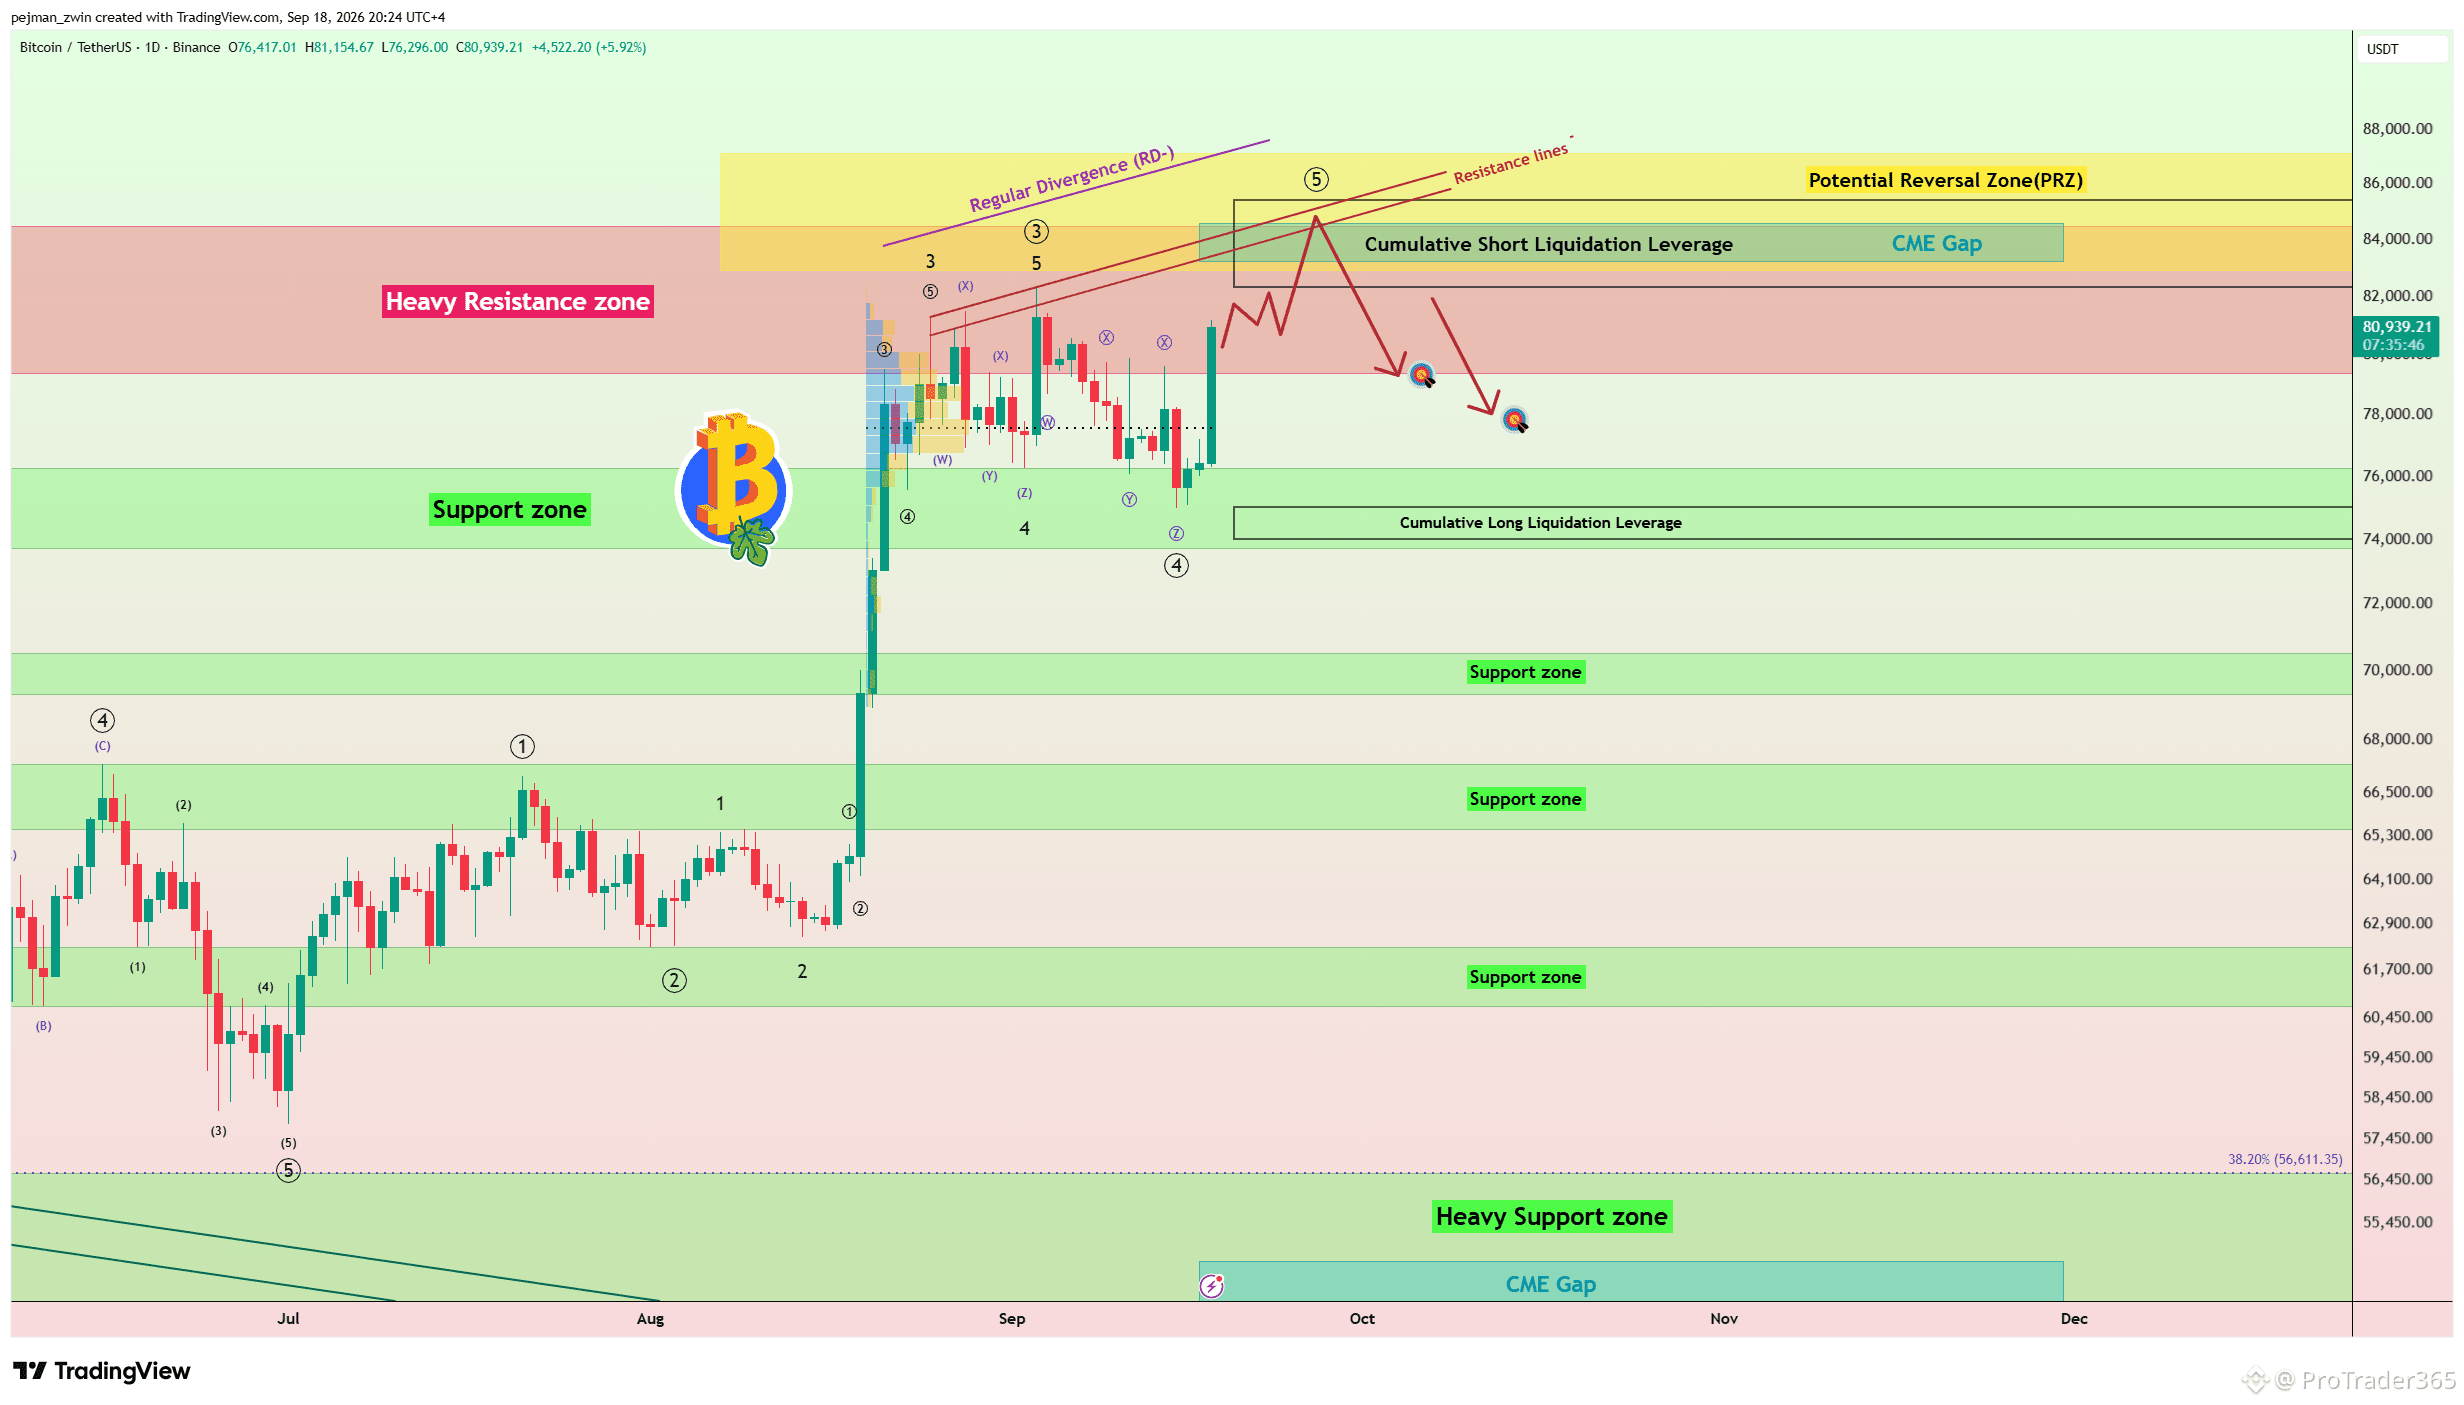
$BTC Enters a Major Reversal Zone — Is a Correction Next? Bitcoin has gained more than 6–7% over the past few hours, but the rally is now entering a major resistance structure while ETF flows remain mixed and regulatory uncertainty persists. Technical Analysis Bitcoin is trading inside the Heavy Resistance Zone($84,500-$79,350), near the Potential Reversal Zone(PRZ)[$87,100-$82,850], the Cumulative Short Liquidation Leverage($85,400-$82,300), and the Resistance Lines. Price could also fill the upper CME Gap($84,560-$83,215). From an Elliott Wave perspective, Bitcoin appears to be completing Primary Wave 5, while a Negative Regular Divergence(RD-) is visible between Consecutive Peaks. I expect Bitcoin to move deeper into the PRZ before another bearish move begins, potentially after a Bull Trap above the Heavy Resistance Zone. First Take Profit(TP): $79,000 Second Take Profit(TP): $77,700 Stop Loss(SL): $87,300(Worst) Which level will Bitcoin reach first: $77,700 or $87,300?
$BTC Enters a Major Reversal Zone — Is a Correction Next? Bitcoin has gained more than 6–7% over the past few hours, but the rally is now entering a major resistance structure while ETF flows remain mixed and regulatory uncertainty persists. Technical Analysis Bitcoin is trading inside the Heavy Resistance Zone($84,500-$79,350), near the Potential Reversal Zone(PRZ)[$87,100-$82,850], the Cumulative Short Liquidation Leverage($85,400-$82,300), and the Resistance Lines. Price could also fill the upper CME Gap($84,560-$83,215). From an Elliott Wave perspective, Bitcoin appears to be completing Primary Wave 5, while a Negative Regular Divergence(RD-) is visible between Consecutive Peaks. I expect Bitcoin to move deeper into the PRZ before another bearish move begins, potentially after a Bull Trap above the Heavy Resistance Zone. First Take Profit(TP): $79,000 Second Take Profit(TP): $77,700 Stop Loss(SL): $87,300(Worst) Which level will Bitcoin reach first: $77,700 or $87,300?
42
·
--
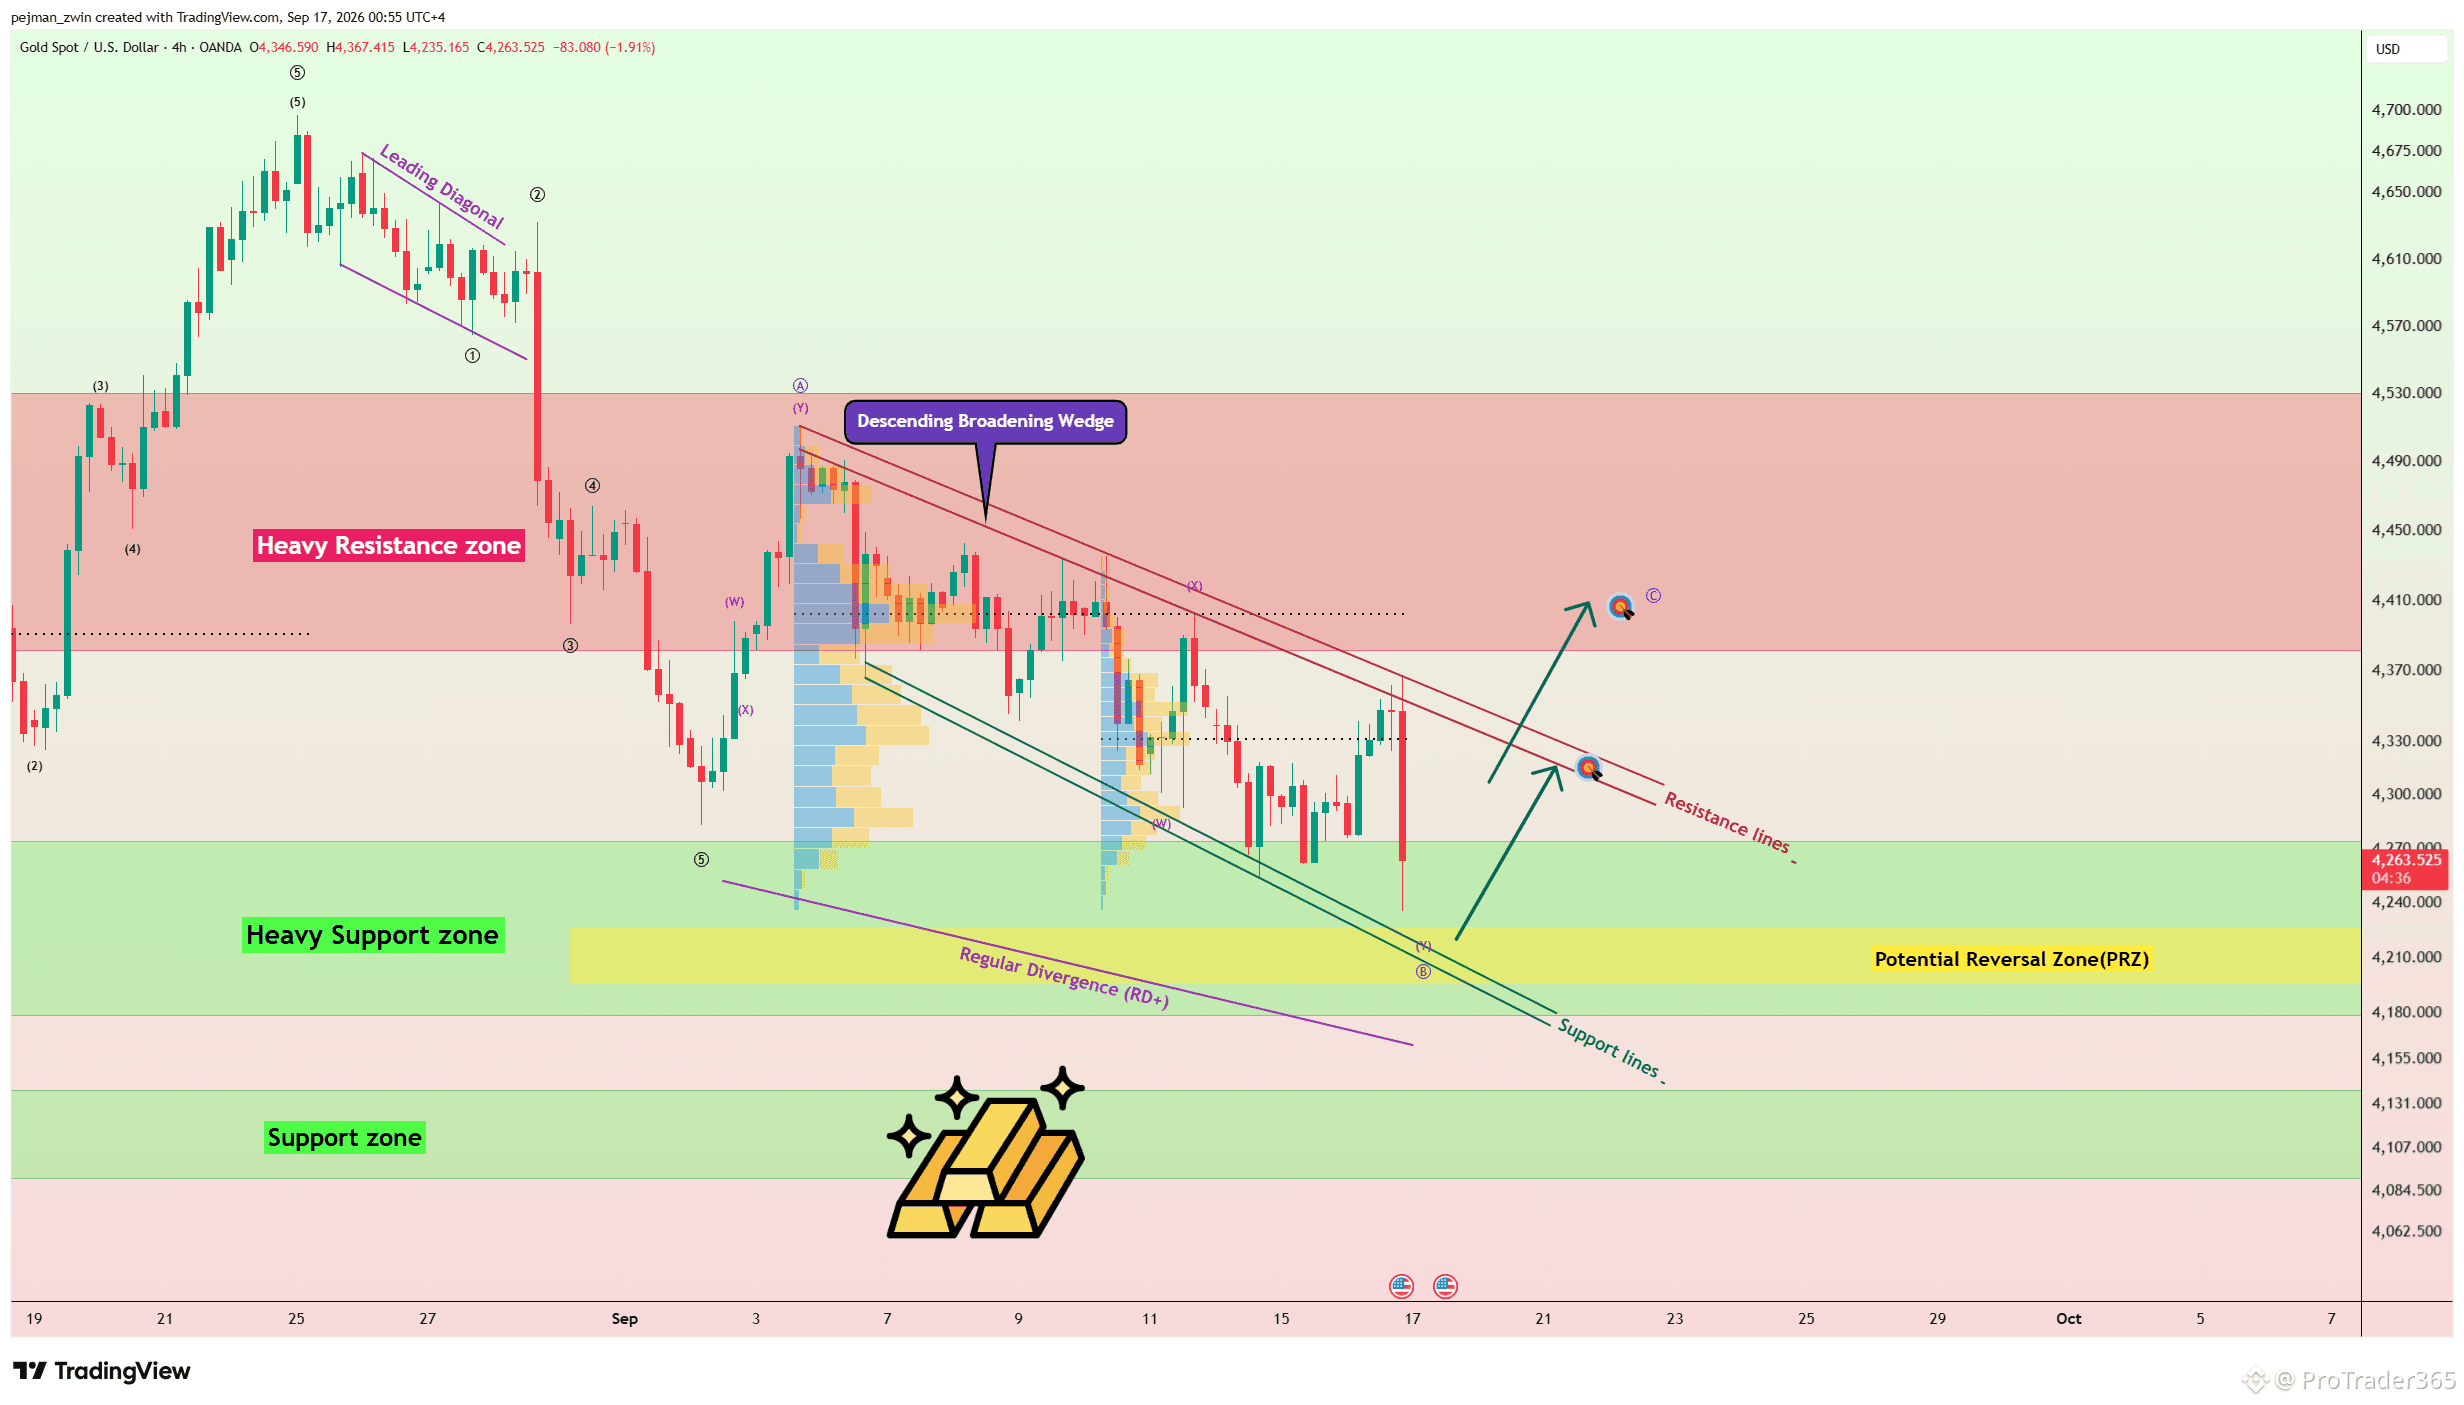
$XAUt Testet einen großen PRZ — Kann Gold nach starker Unterstützung wieder nach oben drehen? Gold ist nach der Entscheidung zur Federal Funds Rate und den Bemerkungen von Kevin Warsh mit starkem bärischem Momentum zurückgegangen, aber der Kurs hat nun die Zone der starken Unterstützung, die Unterstützungs-Linien und die große potenzielle Umkehrzone (PRZ) erreicht [$4,226-$4,195]. Technische Analyse Aus Sicht der Elliott-Wave-Perspektive wirkt der Rückgang der letzten 13 Tage korrektiv. Gold hat außerdem ein absteigendes breites Keilmuster (Descending Broadening Wedge Pattern) gebildet, während eine positive reguläre Divergenz (RD+) zwischen zwei wichtigen aufeinanderfolgenden Tal-Tiefpunkten sichtbar ist. Ich erwarte, dass Gold beginnt, sich von der PRZ und den Unterstützungs-Linien nach oben zu bewegen, in Richtung $4,317. Wenn das bullische Momentum zunimmt und der Kurs über die Widerstandslinien ausbricht, könnte die Erholung sich bis in Richtung $4,391 fortsetzen. Stop Loss (SL): $4,170 Kann Gold diese Unterstützungsstruktur halten und die nächste bullische Erholung einleiten? #Gold
$XAUt Testet einen großen PRZ — Kann Gold nach starker Unterstützung wieder nach oben drehen? Gold ist nach der Entscheidung zur Federal Funds Rate und den Bemerkungen von Kevin Warsh mit starkem bärischem Momentum zurückgegangen, aber der Kurs hat nun die Zone der starken Unterstützung, die Unterstützungs-Linien und die große potenzielle Umkehrzone (PRZ) erreicht [$4,226-$4,195]. Technische Analyse Aus Sicht der Elliott-Wave-Perspektive wirkt der Rückgang der letzten 13 Tage korrektiv. Gold hat außerdem ein absteigendes breites Keilmuster (Descending Broadening Wedge Pattern) gebildet, während eine positive reguläre Divergenz (RD+) zwischen zwei wichtigen aufeinanderfolgenden Tal-Tiefpunkten sichtbar ist. Ich erwarte, dass Gold beginnt, sich von der PRZ und den Unterstützungs-Linien nach oben zu bewegen, in Richtung $4,317. Wenn das bullische Momentum zunimmt und der Kurs über die Widerstandslinien ausbricht, könnte die Erholung sich bis in Richtung $4,391 fortsetzen. Stop Loss (SL): $4,170 Kann Gold diese Unterstützungsstruktur halten und die nächste bullische Erholung einleiten? #Gold
40
·
--
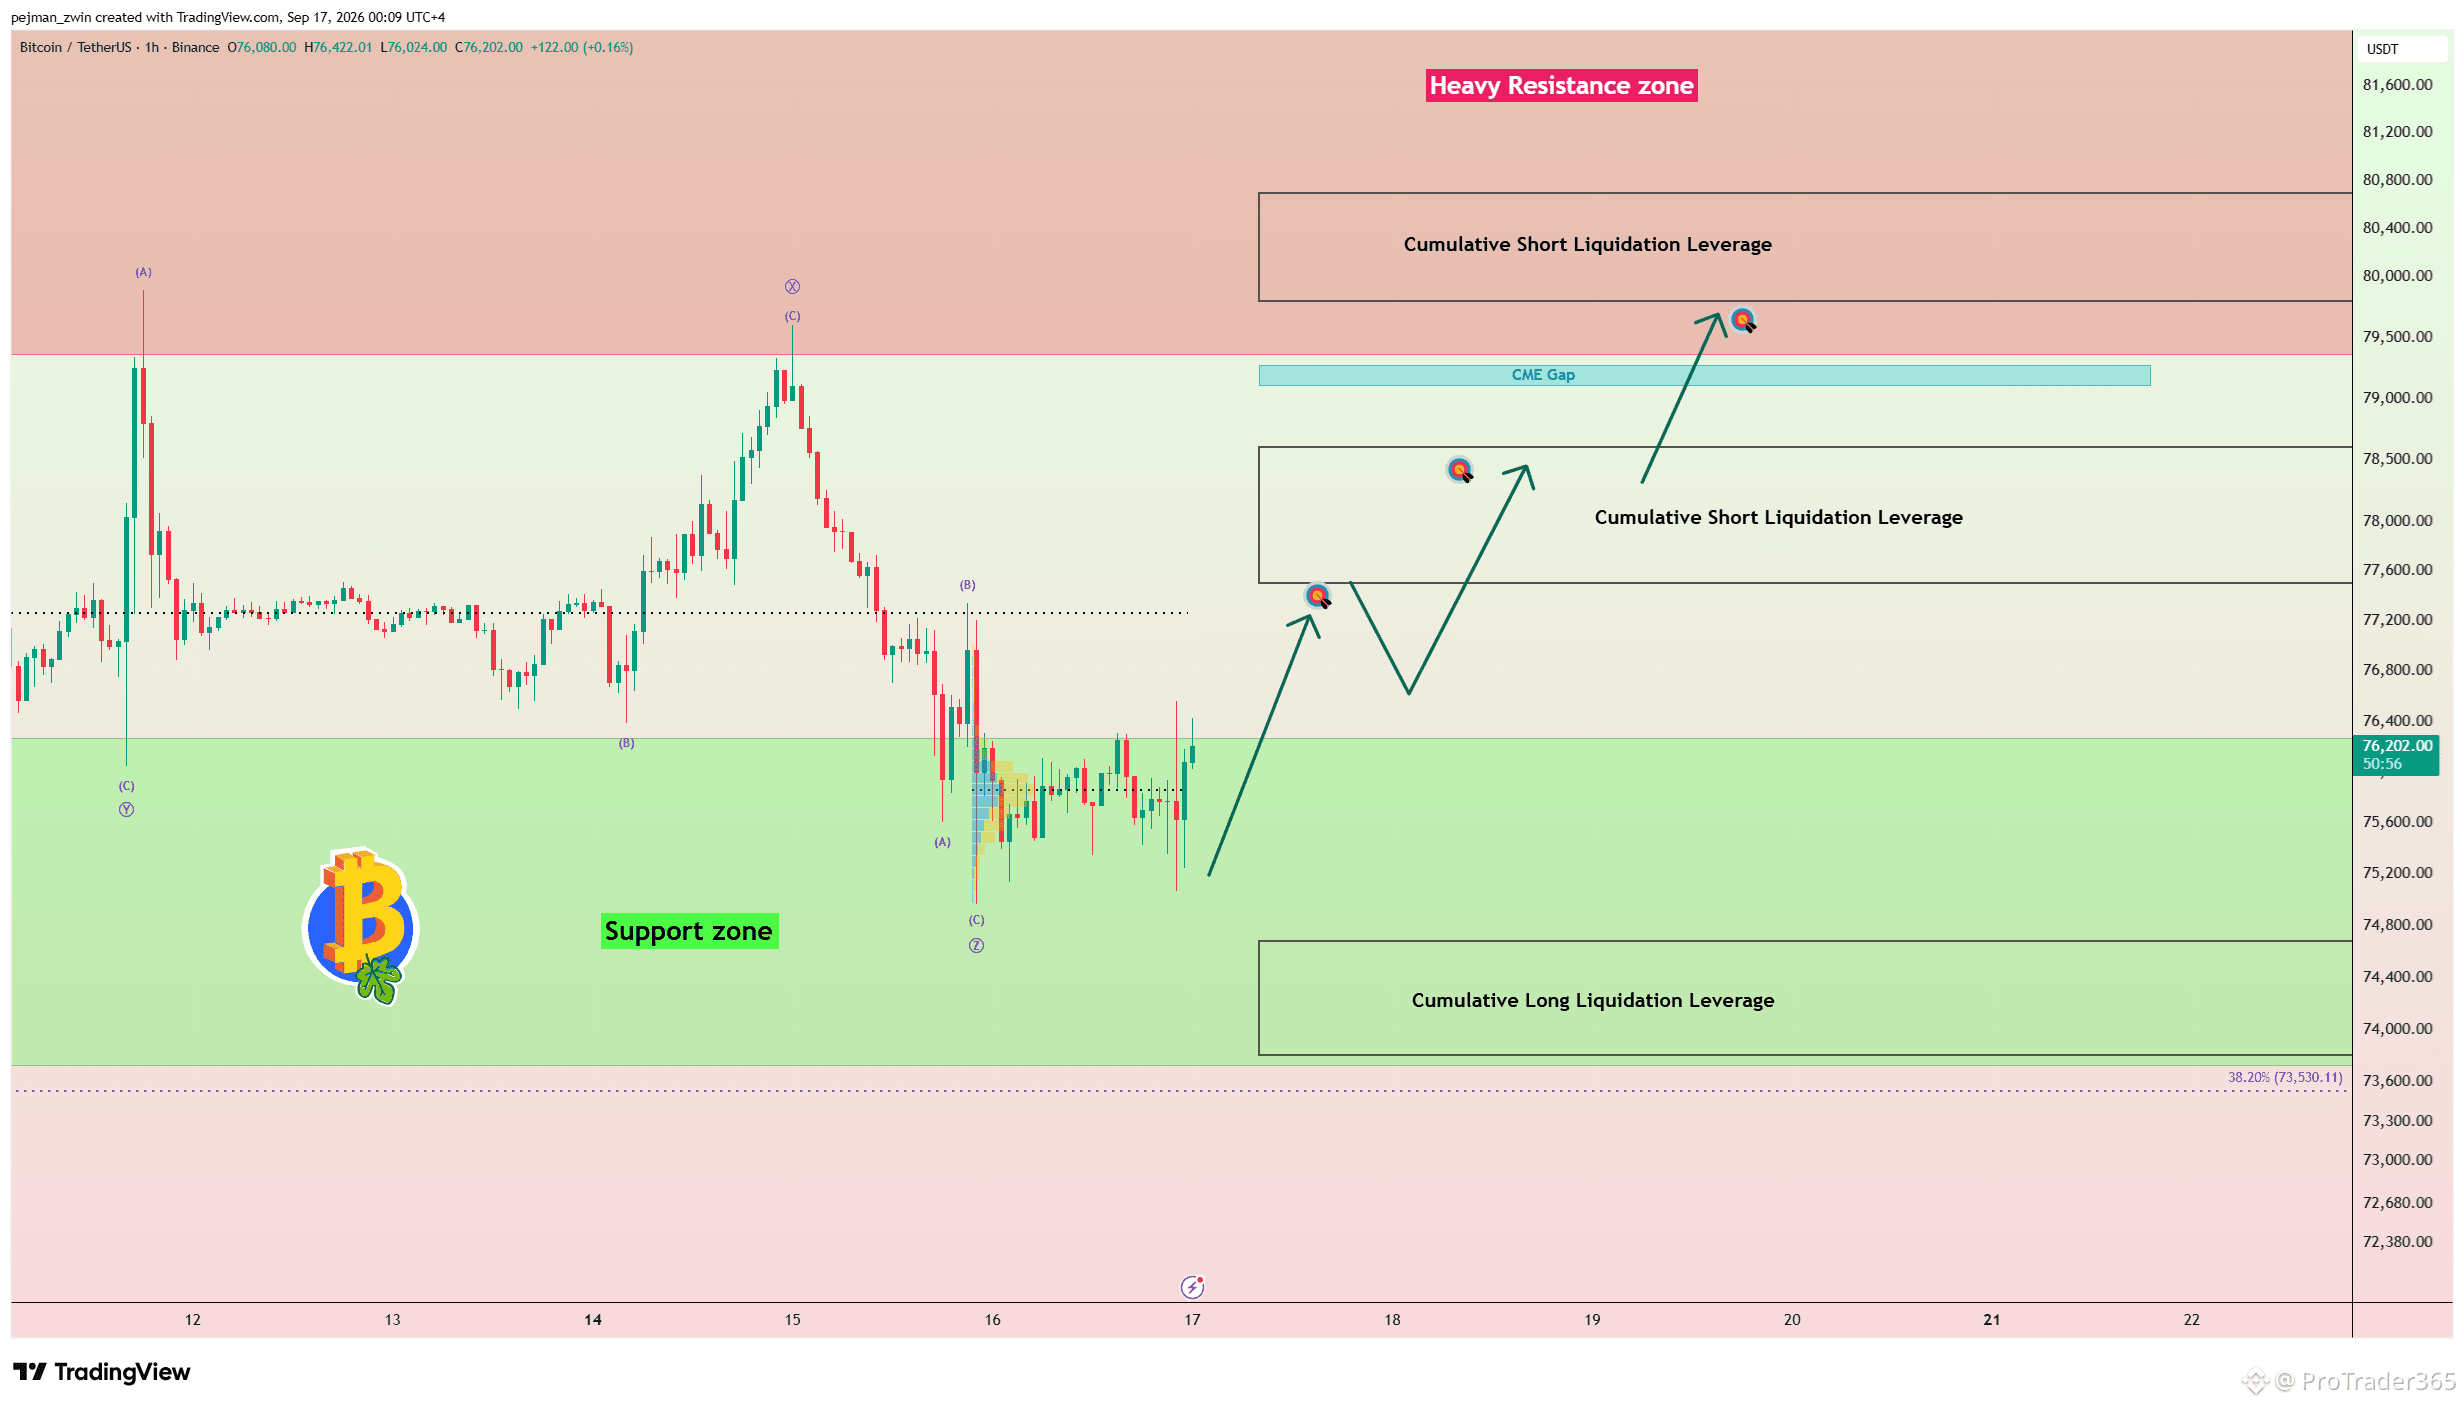
$BTC Hält die Unterstützungszone — Kann Bitcoin Richtung $80.000 zurückspringen? Bitcoin erlebte eine starke Volatilität, nachdem der Federal Funds Rate bei 4,00% veröffentlicht wurde, gefolgt von Bemerkungen von Kevin Warsh. Im Gegensatz zu Gold und dem S&P 500 hat Bitcoin bislang innerhalb seiner Unterstützungszone gehalten und zeigt damit relative Stärke. Technische Analyse Bitcoin handelt nahe dem Kumulierenden Long Liquidation Leverage($74.680-$73.800). Auch ist ein gültiger Golden Cross zwischen der 50_SMA(Daily) und der 200_SMA(Daily) entstanden. Aus Sicht der Elliott-Wave-Analyse wirken die vergangenen 12 Tage eher korrigierend als impulsiv bärisch. Ich erwarte, dass Bitcoin weiter nach oben steigt. Ein Ausbruch über die wichtige Handelsmarke von $77.280 könnte den Weg freimachen in Richtung $78.370 und zum Kumulierenden Short Liquidation Leverage($80.700-$79.800). Stop Loss (SL): $73.500 (Worst) Kann Bitcoin die Unterstützungszone verteidigen und als Nächstes $80.000 erreichen? #BTC Price Analysis# #Was ist deine Bitcoin-Preisprognose?#
$BTC Hält die Unterstützungszone — Kann Bitcoin Richtung $80.000 zurückspringen? Bitcoin erlebte eine starke Volatilität, nachdem der Federal Funds Rate bei 4,00% veröffentlicht wurde, gefolgt von Bemerkungen von Kevin Warsh. Im Gegensatz zu Gold und dem S&P 500 hat Bitcoin bislang innerhalb seiner Unterstützungszone gehalten und zeigt damit relative Stärke. Technische Analyse Bitcoin handelt nahe dem Kumulierenden Long Liquidation Leverage($74.680-$73.800). Auch ist ein gültiger Golden Cross zwischen der 50_SMA(Daily) und der 200_SMA(Daily) entstanden. Aus Sicht der Elliott-Wave-Analyse wirken die vergangenen 12 Tage eher korrigierend als impulsiv bärisch. Ich erwarte, dass Bitcoin weiter nach oben steigt. Ein Ausbruch über die wichtige Handelsmarke von $77.280 könnte den Weg freimachen in Richtung $78.370 und zum Kumulierenden Short Liquidation Leverage($80.700-$79.800). Stop Loss (SL): $73.500 (Worst) Kann Bitcoin die Unterstützungszone verteidigen und als Nächstes $80.000 erreichen? #BTC Price Analysis# #Was ist deine Bitcoin-Preisprognose?#
53
·
--
Übersetzung ansehen
$BTC Shows Relative Strength — Can Bitcoin Defend $75,000? Following the Federal Funds Rate decision and Fed Chair Warsh’s remarks, Bitcoin has so far shown relative strength compared with Gold and U.S. stock indices, particularly the S&P 500, resisting part of the broader selling pressure across financial markets. The key level now is $75,000. This area becomes even more important because more than $1 billion in leveraged positions could be liquidated around $74,860. If Bitcoin moves into this liquidity zone, volatility could increase sharply and potentially accelerate the next directional move. As long as Bitcoin remains above $75,000, buyers still have an opportunity to defend the current structure. Do you think Bitcoin can hold $75,000, or will the $74,860 liquidity zone be tested next?
$BTC Shows Relative Strength — Can Bitcoin Defend $75,000? Following the Federal Funds Rate decision and Fed Chair Warsh’s remarks, Bitcoin has so far shown relative strength compared with Gold and U.S. stock indices, particularly the S&P 500, resisting part of the broader selling pressure across financial markets. The key level now is $75,000. This area becomes even more important because more than $1 billion in leveraged positions could be liquidated around $74,860. If Bitcoin moves into this liquidity zone, volatility could increase sharply and potentially accelerate the next directional move. As long as Bitcoin remains above $75,000, buyers still have an opportunity to defend the current structure. Do you think Bitcoin can hold $75,000, or will the $74,860 liquidity zone be tested next?
62
·
--
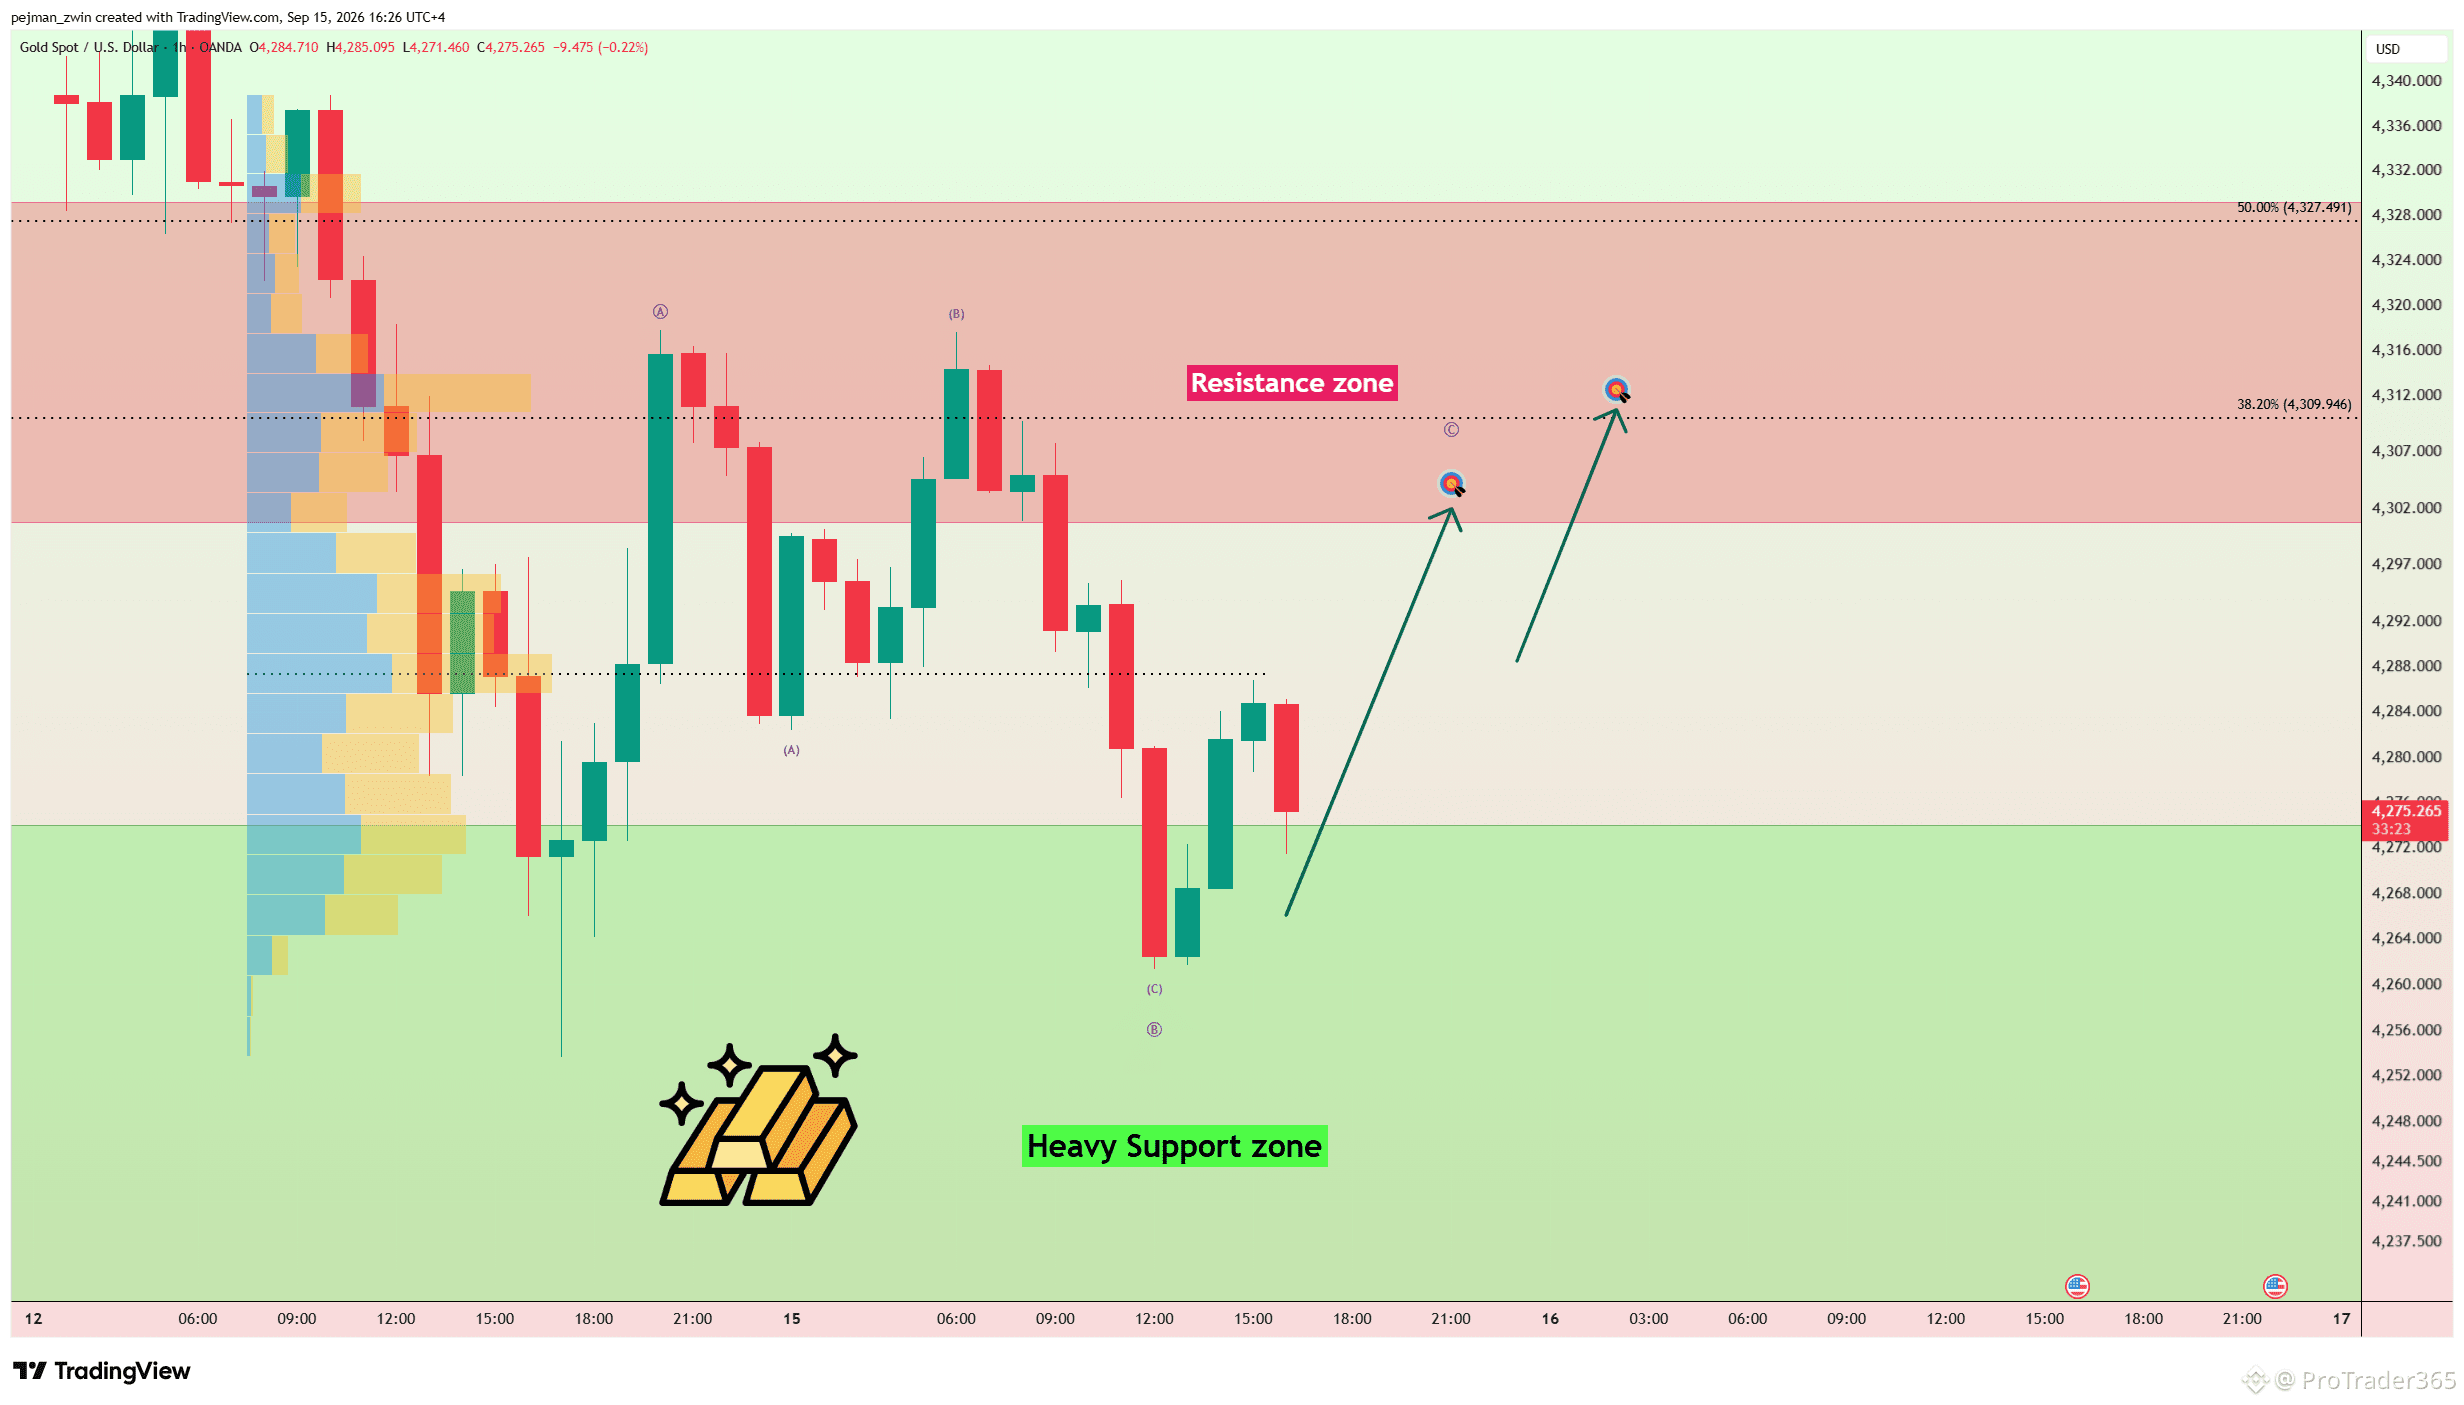
$XAUt Tests der wichtigsten Unterstützung — Kann Gold die Welle C nach oben starten? Gold handelt derzeit nahe einer wichtigen Unterstützungszone und versucht, über die wichtige $4,288-Handelsmarke auszubrechen. Die Reaktion aus diesem Bereich könnte darüber entscheiden, ob Käufer bereit sind, die kurzfristige Kontrolle wiederzugewinnen. Technische Analyse Aus der Perspektive der Elliott-Wellenanalyse scheint sich Gold zu einer Zickzack-Korrektur (A-B-C) zu entwickeln. Welle B scheint abgeschlossen zu sein, was darauf hindeutet, dass nun eine impulsive Welle C nach oben beginnen könnte. Ich erwarte, dass Gold höher in Richtung $4,306 steigt. Wenn der bullische Schwung zunimmt, könnte die Bewegung sich bis zu $4,316 erstrecken und möglicherweise die nahe Widerstandszone erreichen. Erster Take Profit(TP): $4,306 Zweiter Take Profit(TP): $4,316 Stop Loss(SL): $4,250 Kann Gold die Unterstützungszone halten und die nächste impulsive Welle C starten? #Gold
$XAUt Tests der wichtigsten Unterstützung — Kann Gold die Welle C nach oben starten? Gold handelt derzeit nahe einer wichtigen Unterstützungszone und versucht, über die wichtige $4,288-Handelsmarke auszubrechen. Die Reaktion aus diesem Bereich könnte darüber entscheiden, ob Käufer bereit sind, die kurzfristige Kontrolle wiederzugewinnen. Technische Analyse Aus der Perspektive der Elliott-Wellenanalyse scheint sich Gold zu einer Zickzack-Korrektur (A-B-C) zu entwickeln. Welle B scheint abgeschlossen zu sein, was darauf hindeutet, dass nun eine impulsive Welle C nach oben beginnen könnte. Ich erwarte, dass Gold höher in Richtung $4,306 steigt. Wenn der bullische Schwung zunimmt, könnte die Bewegung sich bis zu $4,316 erstrecken und möglicherweise die nahe Widerstandszone erreichen. Erster Take Profit(TP): $4,306 Zweiter Take Profit(TP): $4,316 Stop Loss(SL): $4,250 Kann Gold die Unterstützungszone halten und die nächste impulsive Welle C starten? #Gold
65
·
--
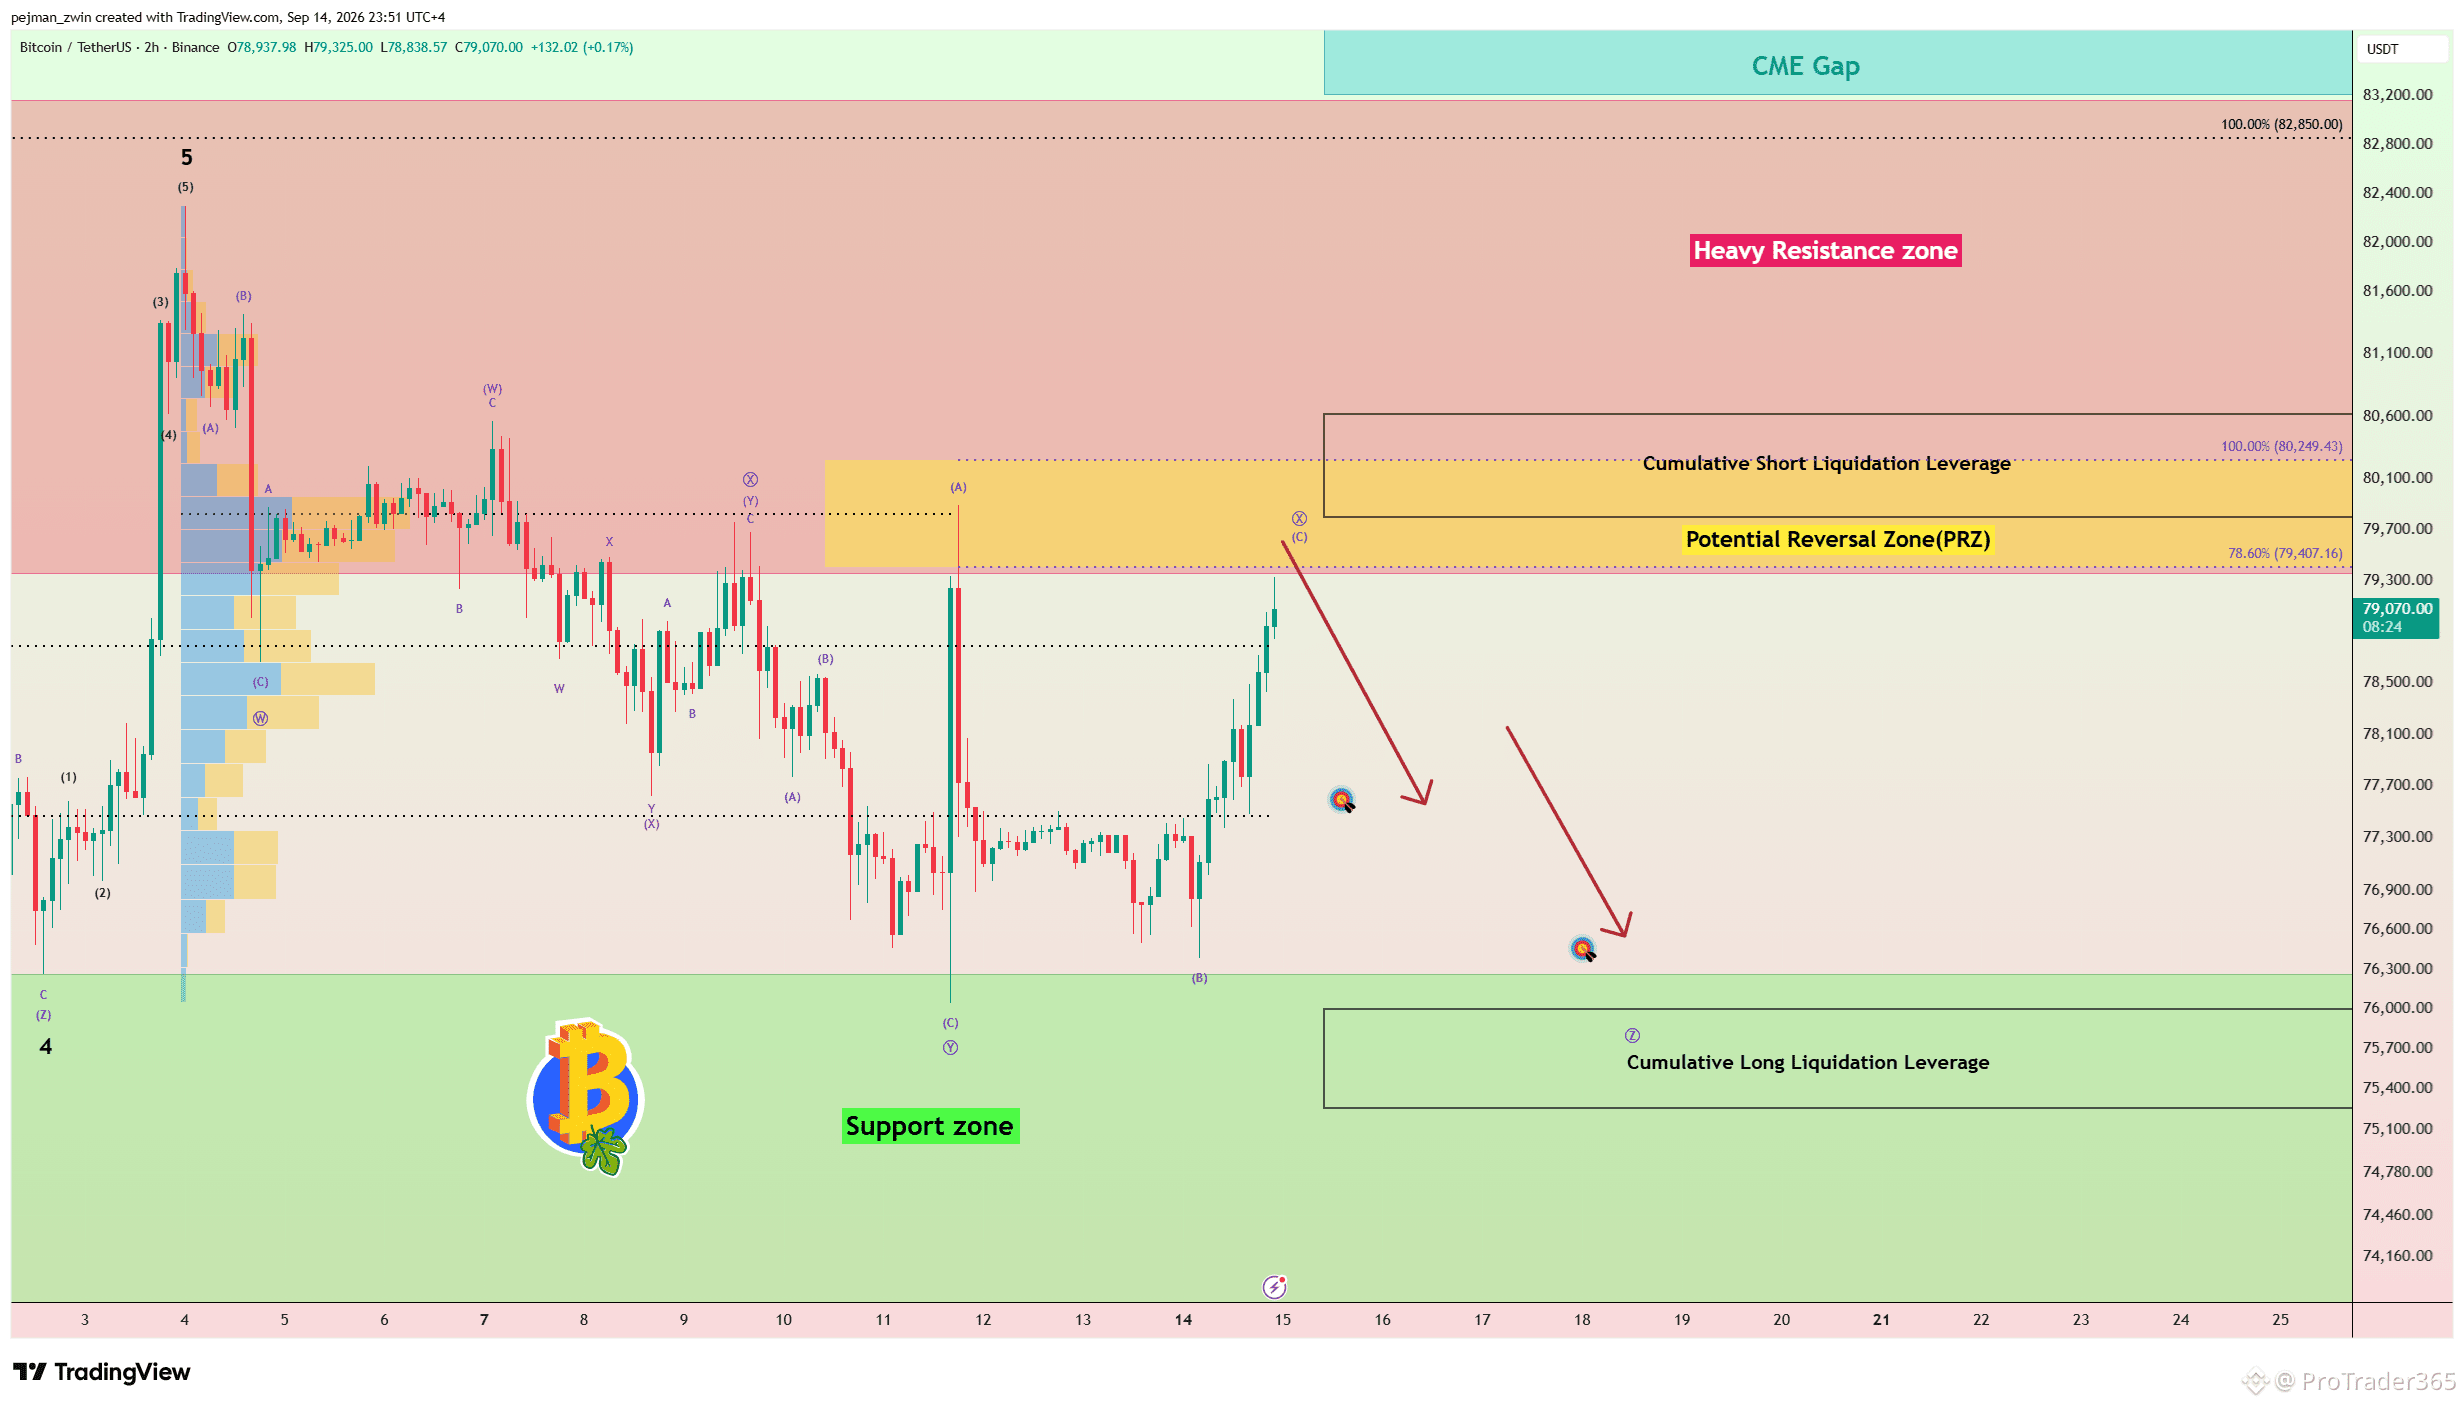
$BTC Tests a Major Liquidity Confluence — Is Another Correction Starting? Bitcoin moved higher after Trump’s tweet supported a recovery in U.S. equities, but the rally has not been accompanied by particularly strong trading volume. BTC is now trading near the Potential Reversal Zone(PRZ)[$80,250-$79,400], the Cumulative Short Liquidation Leverage($80,620-$79,800), and the key $79,800 trading level. From an Elliott Wave perspective, Bitcoin could still be developing a Triple Three Correction(W-X-Y-X-Z). I expect Bitcoin to start declining from this technical confluence toward $77,800. If bearish momentum increases, the correction could extend toward $76,600. Liquidation data also shows around $909M in shorts at risk above $80,600, making this area especially important. Stop Loss(SL): $80,890 Can Bitcoin break above $80,000, or will the PRZ trigger another correction first?
$BTC Tests a Major Liquidity Confluence — Is Another Correction Starting? Bitcoin moved higher after Trump’s tweet supported a recovery in U.S. equities, but the rally has not been accompanied by particularly strong trading volume. BTC is now trading near the Potential Reversal Zone(PRZ)[$80,250-$79,400], the Cumulative Short Liquidation Leverage($80,620-$79,800), and the key $79,800 trading level. From an Elliott Wave perspective, Bitcoin could still be developing a Triple Three Correction(W-X-Y-X-Z). I expect Bitcoin to start declining from this technical confluence toward $77,800. If bearish momentum increases, the correction could extend toward $76,600. Liquidation data also shows around $909M in shorts at risk above $80,600, making this area especially important. Stop Loss(SL): $80,890 Can Bitcoin break above $80,000, or will the PRZ trigger another correction first?
69
·
--
$XAUt Triple-Drei-Korrektur steht kurz vor dem Abschluss — Kann Gold gegen $4.400 zurückkehren? Gold befindet sich seit den letzten sieben Tagen in einem bärischen Trend, aber solange der Kurs über $4.280 bleibt, scheinen Käufer kurzfristig stärker als Verkäufer zu sein. Technische Analyse Gold handelt nahe der möglichen Umkehrzone (Potential Reversal Zone, PRZ)[$4,313-$4,282] sowie nahe der potenziell unteren Trendlinie eines absteigenden Kanals. Aus Sicht der Elliott-Wellen-Perspektive scheint Gold eine Triple-Drei-Korrektur (W-X-Y-X-Z) gebildet zu haben, die Primary Wave B abschließen könnte. Ich erwarte, dass Gold von der aktuellen PRZ aus eine bullische Bewegung einleitet und sich in Richtung $4,366 bewegt. Wenn der bullische Impuls zunimmt, könnte die Erholung sich bis zu $4,395 und in die obere mögliche Umkehrzone (Potential Reversal Zone, PRZ)[$4,401-$4,373] erstrecken. Stop-Loss (SL): $4,281 Kann Gold die aktuelle PRZ halten und mit seiner nächsten bullischen Bewegung Richtung $4,400 beginnen? #Gold
$XAUt Triple-Drei-Korrektur steht kurz vor dem Abschluss — Kann Gold gegen $4.400 zurückkehren? Gold befindet sich seit den letzten sieben Tagen in einem bärischen Trend, aber solange der Kurs über $4.280 bleibt, scheinen Käufer kurzfristig stärker als Verkäufer zu sein. Technische Analyse Gold handelt nahe der möglichen Umkehrzone (Potential Reversal Zone, PRZ)[$4,313-$4,282] sowie nahe der potenziell unteren Trendlinie eines absteigenden Kanals. Aus Sicht der Elliott-Wellen-Perspektive scheint Gold eine Triple-Drei-Korrektur (W-X-Y-X-Z) gebildet zu haben, die Primary Wave B abschließen könnte. Ich erwarte, dass Gold von der aktuellen PRZ aus eine bullische Bewegung einleitet und sich in Richtung $4,366 bewegt. Wenn der bullische Impuls zunimmt, könnte die Erholung sich bis zu $4,395 und in die obere mögliche Umkehrzone (Potential Reversal Zone, PRZ)[$4,401-$4,373] erstrecken. Stop-Loss (SL): $4,281 Kann Gold die aktuelle PRZ halten und mit seiner nächsten bullischen Bewegung Richtung $4,400 beginnen? #Gold

32
·
--
$USDT Dominanz% im Fokus: 7,40% — Noch mehr Druck für Krypto voraus? Die USDT-Dominanz%(USDT.D) versucht, über die wichtige Handelsspanne von 7,08% sowie die nahe Widerstandszone auszubrechen. Ein bestätigter Ausbruch könnte den Druck auf Bitcoin, Ethereum und Altcoins erhöhen. Höhere Renditen der US-Staatsanleihen mit 10 Jahren(US10Y) und der US-Dollar-Index(DXY) könnten ebenfalls weitere Stärke bei USDT.D% unterstützen, da die finanziellen Bedingungen straffer werden. Technische Analyse Aus der Perspektive der Elliott-Wellen zeigt USDT.D%, dass gerade ihre Hauptwelle 4 entsteht. Ich erwarte, dass diese Bewegung möglicherweise in Richtung 7,40% fortgesetzt wird, was mit dem 38,2%-Fibonacci-Level zusammenfällt. Wenn Welle 4 bei etwa 7,40% abgeschlossen ist, könnte USDT.D% anschließend eine neue bärische Bewegung beginnen und damit ein positiveres Umfeld für den breiteren Kryptowährungsmarkt schaffen. Kann USDT.D% 7,08% durchbrechen und 7,40% erreichen, bevor Krypto seinen nächsten großen Rebound startet? #Tether
$USDT Dominanz% im Fokus: 7,40% — Noch mehr Druck für Krypto voraus? Die USDT-Dominanz%(USDT.D) versucht, über die wichtige Handelsspanne von 7,08% sowie die nahe Widerstandszone auszubrechen. Ein bestätigter Ausbruch könnte den Druck auf Bitcoin, Ethereum und Altcoins erhöhen. Höhere Renditen der US-Staatsanleihen mit 10 Jahren(US10Y) und der US-Dollar-Index(DXY) könnten ebenfalls weitere Stärke bei USDT.D% unterstützen, da die finanziellen Bedingungen straffer werden. Technische Analyse Aus der Perspektive der Elliott-Wellen zeigt USDT.D%, dass gerade ihre Hauptwelle 4 entsteht. Ich erwarte, dass diese Bewegung möglicherweise in Richtung 7,40% fortgesetzt wird, was mit dem 38,2%-Fibonacci-Level zusammenfällt. Wenn Welle 4 bei etwa 7,40% abgeschlossen ist, könnte USDT.D% anschließend eine neue bärische Bewegung beginnen und damit ein positiveres Umfeld für den breiteren Kryptowährungsmarkt schaffen. Kann USDT.D% 7,08% durchbrechen und 7,40% erreichen, bevor Krypto seinen nächsten großen Rebound startet? #Tether

41
·
--
$OIL Widerstand durchbricht — Kann die Rally über $110 hinausgehen? Der Ölmarkt hat seinen bullischen Kurs erneut aufgenommen, da die geopolitischen Spannungen im Nahen Osten weiter zunehmen. Nachdem der Kurs fast zwei Wochen lang nach oben tendierte, hat er nun die nahegelegenen Widerstandslinien durchbrochen und nähert sich der wichtigen Kursmarke von $107. Technische Analyse Aus der Sicht der Elliott-Wellen könnte die aktuelle impulsive Struktur sich weiterentwickeln und sich dem Widerstandsbereich ($120-$112) annähern. Die psychologische Marke von $110 könnte als bedeutender Widerstandsbereich fungieren, bevor es zum nächsten großen Move kommt, aber ich erwarte, dass der Ölpreis weiter steigt und bei anhaltend starker bullischer Dynamik möglicherweise $112 erreicht. Geopolitische Schlagzeilen bleiben das zentrale Risiko, da entweder eine weitere Eskalation oder eine mögliche Iran-US-Vereinbarung zu einer starken Volatilität führen könnte. Take Profit (TP): $112 Stop Loss (SL): $99.70 Kann Öl über $110 ausbrechen und die Rally in Richtung $112 fortsetzen? #OIL
$OIL Widerstand durchbricht — Kann die Rally über $110 hinausgehen? Der Ölmarkt hat seinen bullischen Kurs erneut aufgenommen, da die geopolitischen Spannungen im Nahen Osten weiter zunehmen. Nachdem der Kurs fast zwei Wochen lang nach oben tendierte, hat er nun die nahegelegenen Widerstandslinien durchbrochen und nähert sich der wichtigen Kursmarke von $107. Technische Analyse Aus der Sicht der Elliott-Wellen könnte die aktuelle impulsive Struktur sich weiterentwickeln und sich dem Widerstandsbereich ($120-$112) annähern. Die psychologische Marke von $110 könnte als bedeutender Widerstandsbereich fungieren, bevor es zum nächsten großen Move kommt, aber ich erwarte, dass der Ölpreis weiter steigt und bei anhaltend starker bullischer Dynamik möglicherweise $112 erreicht. Geopolitische Schlagzeilen bleiben das zentrale Risiko, da entweder eine weitere Eskalation oder eine mögliche Iran-US-Vereinbarung zu einer starken Volatilität führen könnte. Take Profit (TP): $112 Stop Loss (SL): $99.70 Kann Öl über $110 ausbrechen und die Rally in Richtung $112 fortsetzen? #OIL

46
·
--
$BTC Steht unter makrodynamischem Druck, während die US10Y auf 5,1% zielt Die Rendite der US-10-jährigen Staatsanleihe (US10Y) nähert sich nach rund 190 Tagen, in denen sie sich innerhalb eines aufsteigenden Kanals bewegt hat, einer wichtigen Widerstandszone. Ein anhaltender Anstieg könnte zusätzlichen Druck auf Bitcoin, Krypto, US-Aktien, Gold und Silber ausüben. Höhere Renditen für Staatsanleihen ziehen die finanziellen Bedingungen enger, erhöhen die Kreditkosten, stützen den U.S. Dollar Index (DXY) und verringern generell die Nachfrage nach riskanten Assets sowie nach nicht renditebringenden Edelmetallen. Technische Analyse Im täglichen Zeitrahmen scheint US10Y aus Sicht der Elliott-Wave-Analyse dabei zu sein, die Hauptwelle X innerhalb des aufsteigenden Kanals abzuschließen. Unter Berücksichtigung der jüngsten US-Wirtschaftsdaten, anhaltender inflationärer Tendenzen und geopolitischer Risiken im Nahen Osten erwarte ich, dass US10Y weiter steigt und Richtung 5,1% läuft. Wenn US10Y 5,1% erreicht, erwartest du dann einen weiteren großen Ausverkauf bei Bitcoin und US-Aktien? #Wie lautet deine Bitcoin-Preisprognose?#
$BTC Steht unter makrodynamischem Druck, während die US10Y auf 5,1% zielt Die Rendite der US-10-jährigen Staatsanleihe (US10Y) nähert sich nach rund 190 Tagen, in denen sie sich innerhalb eines aufsteigenden Kanals bewegt hat, einer wichtigen Widerstandszone. Ein anhaltender Anstieg könnte zusätzlichen Druck auf Bitcoin, Krypto, US-Aktien, Gold und Silber ausüben. Höhere Renditen für Staatsanleihen ziehen die finanziellen Bedingungen enger, erhöhen die Kreditkosten, stützen den U.S. Dollar Index (DXY) und verringern generell die Nachfrage nach riskanten Assets sowie nach nicht renditebringenden Edelmetallen. Technische Analyse Im täglichen Zeitrahmen scheint US10Y aus Sicht der Elliott-Wave-Analyse dabei zu sein, die Hauptwelle X innerhalb des aufsteigenden Kanals abzuschließen. Unter Berücksichtigung der jüngsten US-Wirtschaftsdaten, anhaltender inflationärer Tendenzen und geopolitischer Risiken im Nahen Osten erwarte ich, dass US10Y weiter steigt und Richtung 5,1% läuft. Wenn US10Y 5,1% erreicht, erwartest du dann einen weiteren großen Ausverkauf bei Bitcoin und US-Aktien? #Wie lautet deine Bitcoin-Preisprognose?#

38
·
--
$BTC Triple-Drei-Korrektur steht kurz vor dem Abschluss — Kann Bitcoin $80.000 zurückerobern? Bitcoin fiel zusammen mit der Schwäche der US-Aktienindizes, darunter der S&P 500, und verlor die wichtige Handelsspanne von $78.800. Technische Analyse Aus der Perspektive der Elliott-Wave-Theorie scheint Bitcoin in der vergangenen Woche eine Triple-Drei-Korrektur (W-X-Y-X-Z) gebildet zu haben. Welle Z könnte sich möglicherweise innerhalb der kumulierten Long-Liquidationsleverage ($77,620-$76,960) nahe der Unterstützungs-Linie vervollständigen und so die Wahrscheinlichkeit einer bullischen Reaktion erhöhen. Ich erwarte, dass Bitcoin in diesem Bereich nach oben zu steigen beginnt, in Richtung $78.700. Wenn der bullische Impuls zunimmt, könnte der Preis über die Widerstands-Linie ausbrechen und sich bis in Richtung $79,570 ausdehnen. Stop Loss (SL): $76,917 CME-Gap: $76,810-$76,255 Kann Bitcoin hier Welle Z abschließen und $80.000 zurückerobern?
$BTC Triple-Drei-Korrektur steht kurz vor dem Abschluss — Kann Bitcoin $80.000 zurückerobern? Bitcoin fiel zusammen mit der Schwäche der US-Aktienindizes, darunter der S&P 500, und verlor die wichtige Handelsspanne von $78.800. Technische Analyse Aus der Perspektive der Elliott-Wave-Theorie scheint Bitcoin in der vergangenen Woche eine Triple-Drei-Korrektur (W-X-Y-X-Z) gebildet zu haben. Welle Z könnte sich möglicherweise innerhalb der kumulierten Long-Liquidationsleverage ($77,620-$76,960) nahe der Unterstützungs-Linie vervollständigen und so die Wahrscheinlichkeit einer bullischen Reaktion erhöhen. Ich erwarte, dass Bitcoin in diesem Bereich nach oben zu steigen beginnt, in Richtung $78.700. Wenn der bullische Impuls zunimmt, könnte der Preis über die Widerstands-Linie ausbrechen und sich bis in Richtung $79,570 ausdehnen. Stop Loss (SL): $76,917 CME-Gap: $76,810-$76,255 Kann Bitcoin hier Welle Z abschließen und $80.000 zurückerobern?

48
·
--
$XAUt Durchbricht die fallende Wellenkeile — Kann Gold $4.470 erreichen? Gold wird derzeit nahe den wichtigen Kursniveaus von $4.400 und $4.370 gehandelt, nachdem es über die obere Trendlinie eines Falling Wedge-Patterns ausgebrochen ist. Dies stützt eine mögliche bullische Trendwende. Technische Analyse Aus der Perspektive der Elliott-Wave-Analyse scheint Gold eine Double Three Correction (W-X-Y) innerhalb des Falling Wedge-Patterns abgeschlossen zu haben. Der Ausbruch über die obere Trendlinie deutet weiter darauf hin, dass die Korrekturstruktur möglicherweise beendet ist. Ich erwarte, dass Gold in den kommenden Stunden seinen bullischen Aufwärtsbewegung wiederaufnimmt und mindestens in Richtung $4.437 steigt. Wenn der bullische Impuls zunimmt, könnte die Bewegung sich bis zu $4.461 und schließlich bis zur entscheidenden Handelsspanne von $4.470 erstrecken. Stop Loss (SL): $4.360 Kann Gold den Ausbruch aus dem Falling Wedge bestätigen und $4.470 erreichen? #Gold
$XAUt Durchbricht die fallende Wellenkeile — Kann Gold $4.470 erreichen? Gold wird derzeit nahe den wichtigen Kursniveaus von $4.400 und $4.370 gehandelt, nachdem es über die obere Trendlinie eines Falling Wedge-Patterns ausgebrochen ist. Dies stützt eine mögliche bullische Trendwende. Technische Analyse Aus der Perspektive der Elliott-Wave-Analyse scheint Gold eine Double Three Correction (W-X-Y) innerhalb des Falling Wedge-Patterns abgeschlossen zu haben. Der Ausbruch über die obere Trendlinie deutet weiter darauf hin, dass die Korrekturstruktur möglicherweise beendet ist. Ich erwarte, dass Gold in den kommenden Stunden seinen bullischen Aufwärtsbewegung wiederaufnimmt und mindestens in Richtung $4.437 steigt. Wenn der bullische Impuls zunimmt, könnte die Bewegung sich bis zu $4.461 und schließlich bis zur entscheidenden Handelsspanne von $4.470 erstrecken. Stop Loss (SL): $4.360 Kann Gold den Ausbruch aus dem Falling Wedge bestätigen und $4.470 erreichen? #Gold

72
·
--
$XAUt Tests a Key PRZ — Kann Gold Richtung $4.500 zurückkehren? Gold wird derzeit nahe der wichtigen $4,370-Chartmarke gehandelt und befindet sich innerhalb der Potential Reversal Zone(PRZ)[$4,400-$4,364], einem Bereich, der den Ausgangspunkt für die nächste richtungsweisende Bewegung bilden könnte. Technische Analyse Aus der Perspektive der Elliott-Wave-Analyse scheint Gold bereit zu sein, seine nächste Impulsive Welle aus der Potential Reversal Zone(PRZ) zu starten. Ich erwarte, dass Gold in den kommenden Stunden einen bullischen Move beginnt und mindestens in Richtung $4,441 steigt. Wenn der bullische Schwung zunimmt, könnte die Bewegung sich bis zu $4,461 und der wichtigen $4,470-Chartmarke ausdehnen. Erster Take Profit(TP): $4,441 Zweiter Take Profit(TP): $4,461 Stop Loss(SL): $4,360 Glaubst du, dass Gold die PRZ halten und die $4,500-Marke erneut testen kann? #Gold
$XAUt Tests a Key PRZ — Kann Gold Richtung $4.500 zurückkehren? Gold wird derzeit nahe der wichtigen $4,370-Chartmarke gehandelt und befindet sich innerhalb der Potential Reversal Zone(PRZ)[$4,400-$4,364], einem Bereich, der den Ausgangspunkt für die nächste richtungsweisende Bewegung bilden könnte. Technische Analyse Aus der Perspektive der Elliott-Wave-Analyse scheint Gold bereit zu sein, seine nächste Impulsive Welle aus der Potential Reversal Zone(PRZ) zu starten. Ich erwarte, dass Gold in den kommenden Stunden einen bullischen Move beginnt und mindestens in Richtung $4,441 steigt. Wenn der bullische Schwung zunimmt, könnte die Bewegung sich bis zu $4,461 und der wichtigen $4,470-Chartmarke ausdehnen. Erster Take Profit(TP): $4,441 Zweiter Take Profit(TP): $4,461 Stop Loss(SL): $4,360 Glaubst du, dass Gold die PRZ halten und die $4,500-Marke erneut testen kann? #Gold

57
·
--
$ZEC Rallye steht kurz vor einer kritischen Umkehrzone — Ist als Nächstes eine 20% Korrektur zu erwarten? Zcash gehört weiterhin zu den stärkst performenden großen Kryptowährungen und wird gestützt durch institutionellen Zugang, erneute Nachfrage nach Privatsphäre, Netzwerk-Updates und einen großen Short Squeeze. Technische Analyse Auf dem täglichen Zeitrahmen hat ZEC über seine wichtigen Widerstandslinien ausgebrochen, während das Cup-and-Handle-Muster die breitere bullische Struktur weiterhin unterstützt. Aus Sicht der Elliott-Wave-Analyse scheint ZEC dabei zu sein, Sub-Wave 3 der Primary Wave 5 abzuschließen — möglicherweise innerhalb der kumulativen Short-Liquidationshebel($1,210-$1,300). Ich erwarte, dass eine Korrektur entweder ab der potenziellen Umkehrzone (PRZ)[$1,530-$1,320] beginnt oder bevor ihre obere Grenze erreicht wird. Ein Rückgang von mindestens 20% könnte auf den kumulativen Long-Liquidationshebel($900-$950) abzielen. Stop Loss(SL): $1,502 Wird Zcash zuerst $1,500 erreichen oder beginnt die Korrektur in Richtung $950? #Zcash #ZEC
$ZEC Rallye steht kurz vor einer kritischen Umkehrzone — Ist als Nächstes eine 20% Korrektur zu erwarten? Zcash gehört weiterhin zu den stärkst performenden großen Kryptowährungen und wird gestützt durch institutionellen Zugang, erneute Nachfrage nach Privatsphäre, Netzwerk-Updates und einen großen Short Squeeze. Technische Analyse Auf dem täglichen Zeitrahmen hat ZEC über seine wichtigen Widerstandslinien ausgebrochen, während das Cup-and-Handle-Muster die breitere bullische Struktur weiterhin unterstützt. Aus Sicht der Elliott-Wave-Analyse scheint ZEC dabei zu sein, Sub-Wave 3 der Primary Wave 5 abzuschließen — möglicherweise innerhalb der kumulativen Short-Liquidationshebel($1,210-$1,300). Ich erwarte, dass eine Korrektur entweder ab der potenziellen Umkehrzone (PRZ)[$1,530-$1,320] beginnt oder bevor ihre obere Grenze erreicht wird. Ein Rückgang von mindestens 20% könnte auf den kumulativen Long-Liquidationshebel($900-$950) abzielen. Stop Loss(SL): $1,502 Wird Zcash zuerst $1,500 erreichen oder beginnt die Korrektur in Richtung $950? #Zcash #ZEC

73
·
--
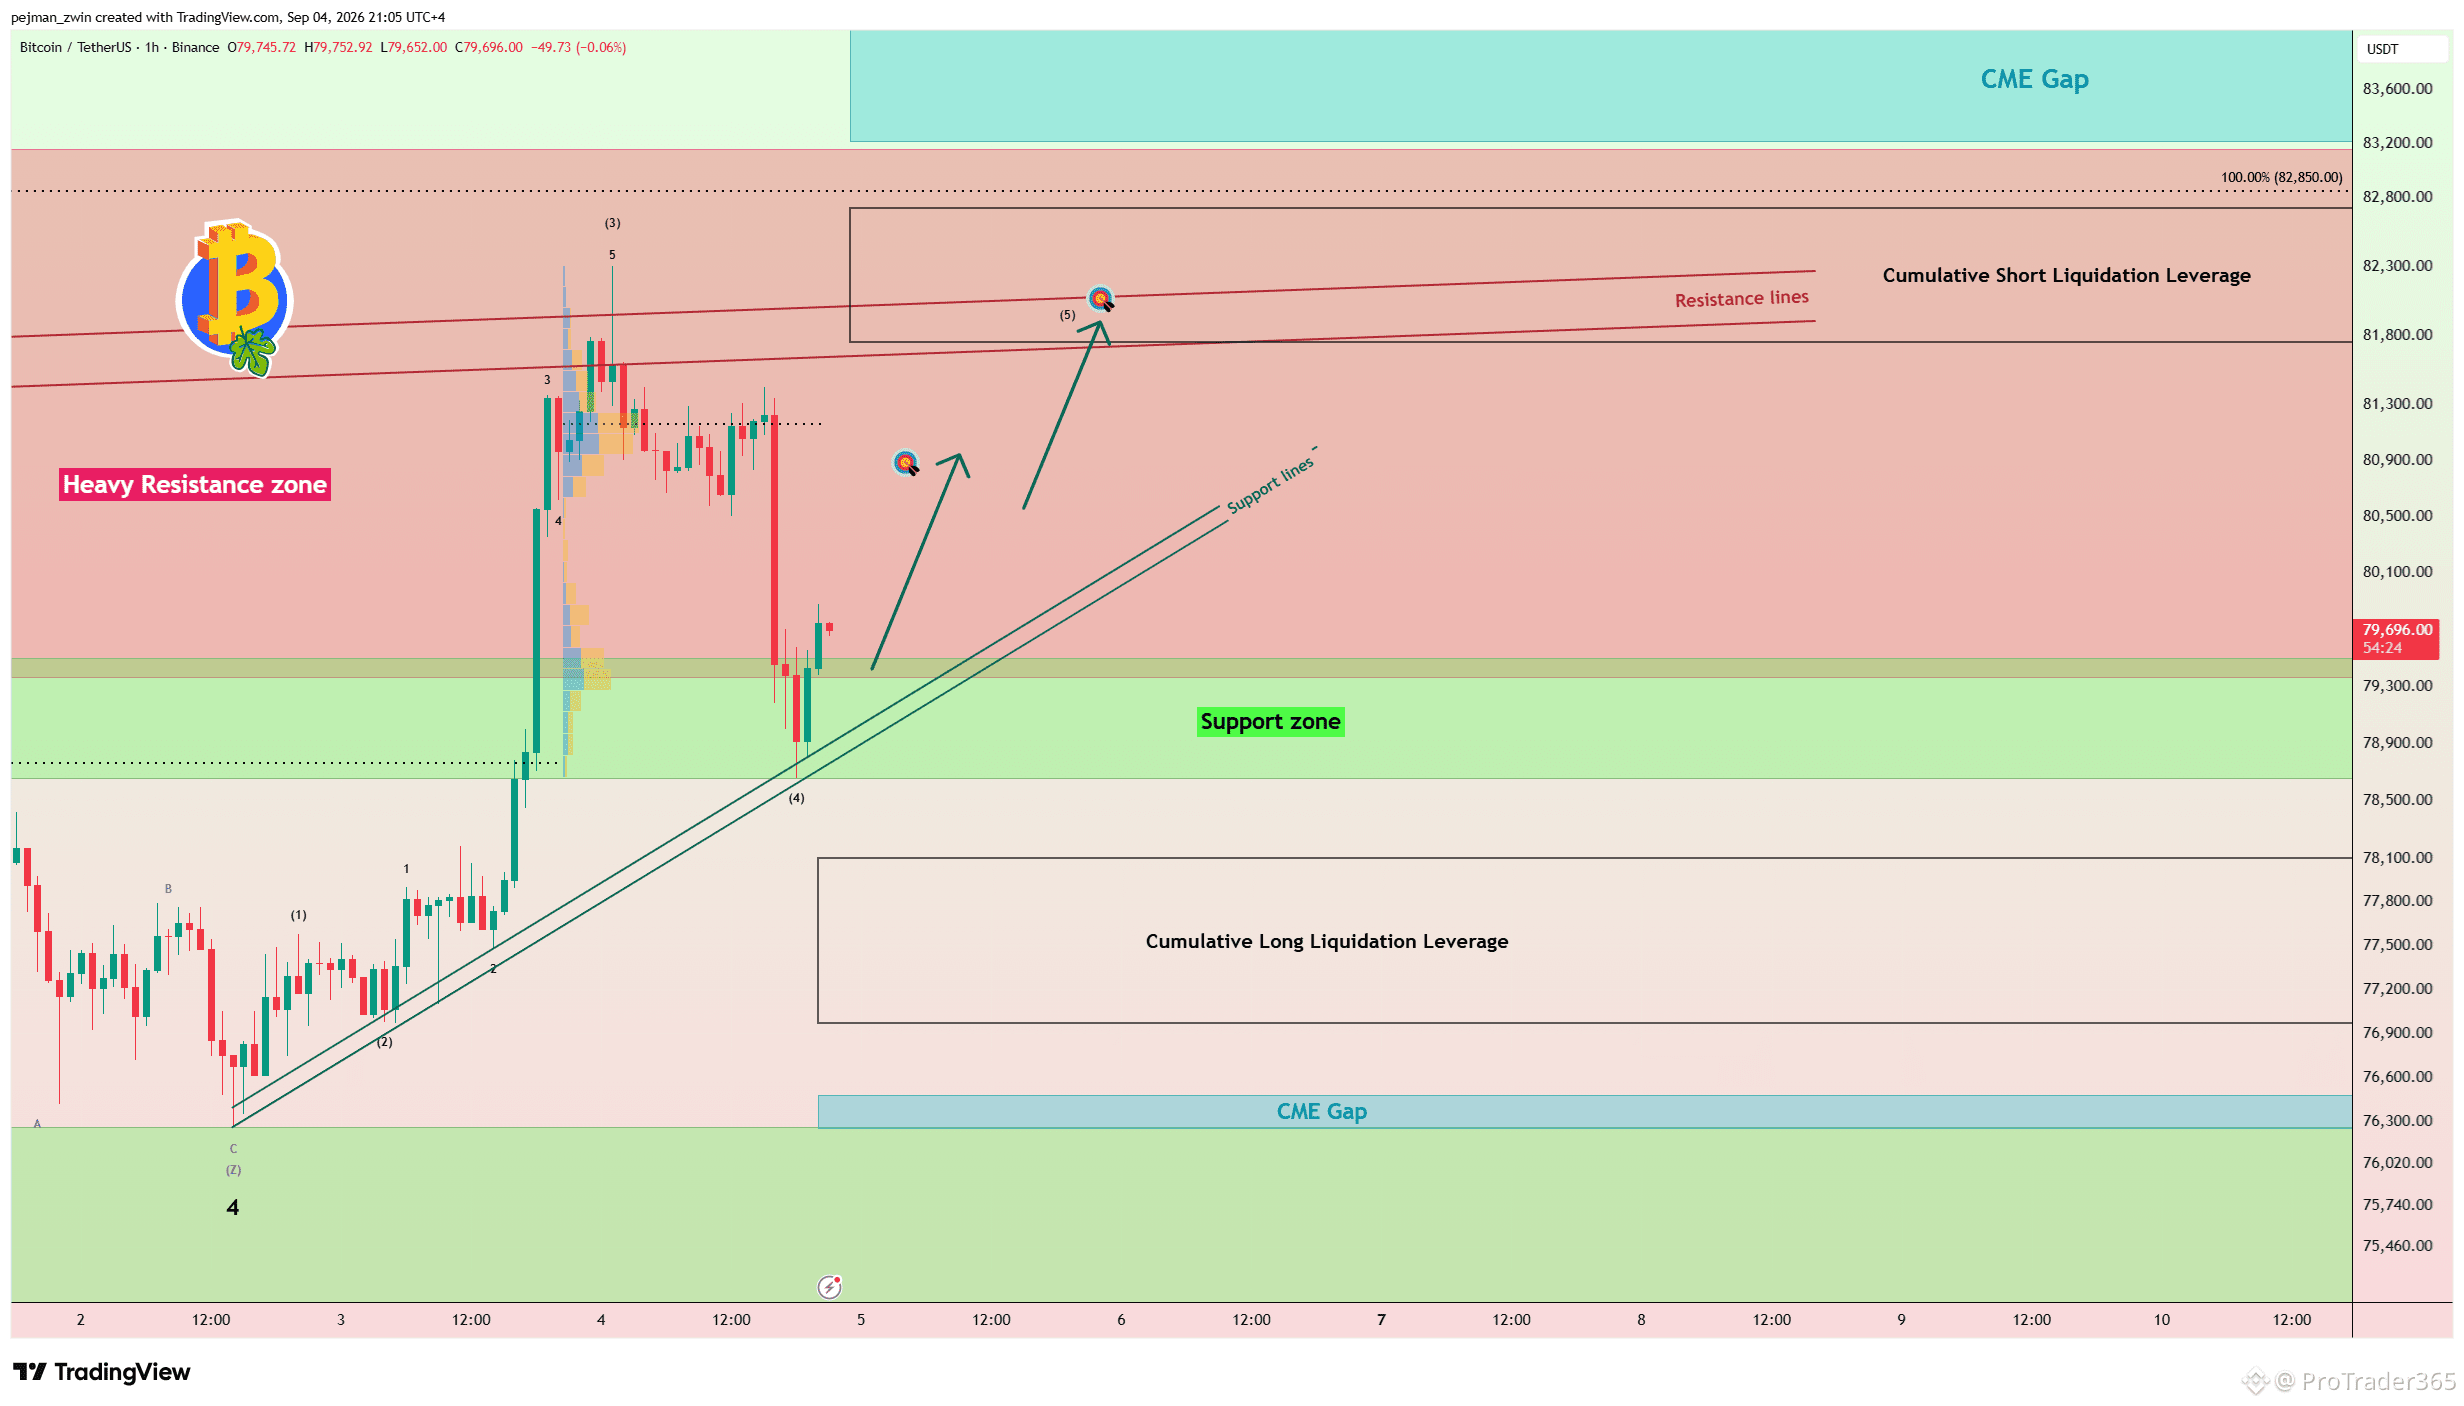
$BTC Wellen 5 Setup — Kann Bitcoin über $82.000 hinausgehen? Bitcoin reagierte sehr gut auf die Support-Zone, nahe Support-Linien und die wichtige Handelsmarke von $78.770 und hält damit das kurzfristig bullische Szenario aktiv. Technische Analyse Aus Sicht der Elliott-Wave scheint Bitcoin seine zentrale Wave 4 abgeschlossen zu haben, wodurch möglicherweise der Weg für eine impulsive Wave 5 frei wird. Allerdings könnte mit dem nahenden Wochenende bei geringeren Handelsvolumina Wave 4 in eine komplexere Korrektur übergehen, bevor die nächste große Bewegung folgt. Ich erwarte, dass Bitcoin einen weiteren Versuch in Richtung der Widerstandslinien und des kumulierten Short-Liquidation-Hebelbereichs ( $82.730–$81.750 ) startet. Stärkere bullische Dynamik könnte die Bewegung über $82.000 hinaus verlängern. Erster Take Profit (TP): $80.800 Stop Loss (SL): $78.450 Kann Bitcoin zuerst $82.000 erreichen, oder wird Wave 4 über das Wochenende hinweg komplexer?
$BTC Wellen 5 Setup — Kann Bitcoin über $82.000 hinausgehen? Bitcoin reagierte sehr gut auf die Support-Zone, nahe Support-Linien und die wichtige Handelsmarke von $78.770 und hält damit das kurzfristig bullische Szenario aktiv. Technische Analyse Aus Sicht der Elliott-Wave scheint Bitcoin seine zentrale Wave 4 abgeschlossen zu haben, wodurch möglicherweise der Weg für eine impulsive Wave 5 frei wird. Allerdings könnte mit dem nahenden Wochenende bei geringeren Handelsvolumina Wave 4 in eine komplexere Korrektur übergehen, bevor die nächste große Bewegung folgt. Ich erwarte, dass Bitcoin einen weiteren Versuch in Richtung der Widerstandslinien und des kumulierten Short-Liquidation-Hebelbereichs ( $82.730–$81.750 ) startet. Stärkere bullische Dynamik könnte die Bewegung über $82.000 hinaus verlängern. Erster Take Profit (TP): $80.800 Stop Loss (SL): $78.450 Kann Bitcoin zuerst $82.000 erreichen, oder wird Wave 4 über das Wochenende hinweg komplexer?
68
·
--
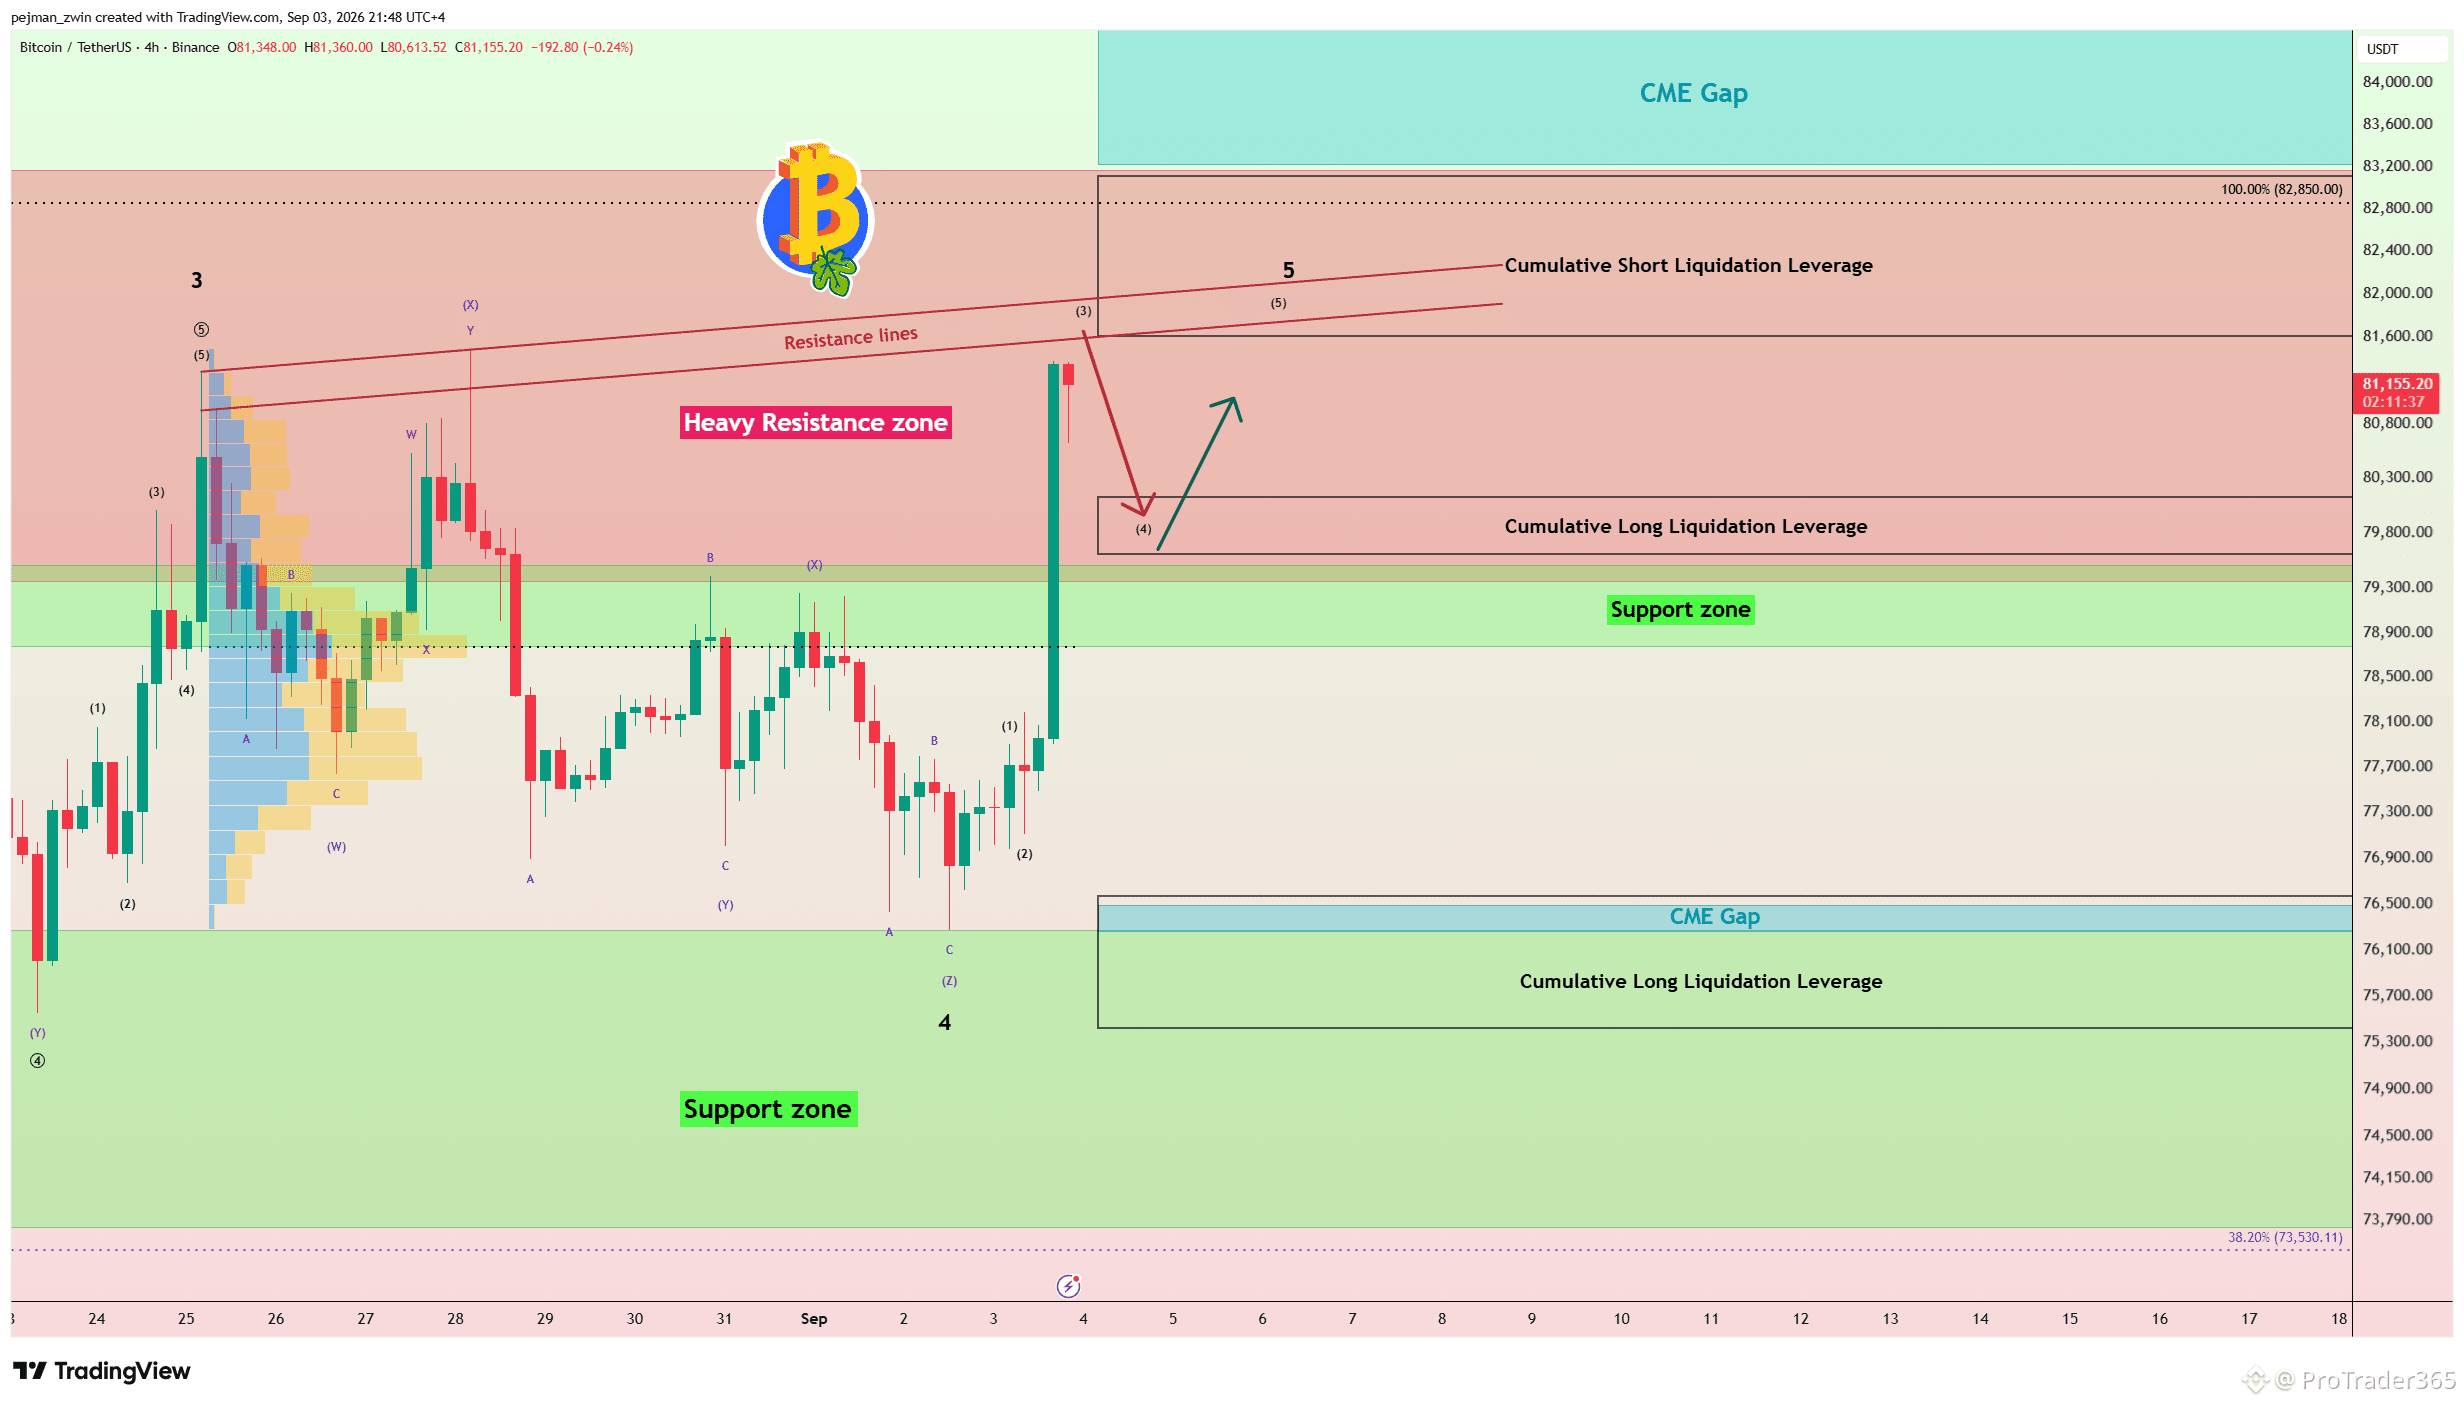
$BTC Erholt sich über $80.000 — Aber Welle 5 könnte kurz vor dem Abschluss stehen Bitcoin eroberte die $80.000-Marke zurück, nachdem Fed-Gouverneur Christopher Waller Unterstützung dafür signalisiert hatte, die Zinsen unverändert zu lassen, während gleichzeitig mehr als $415 Millionen an Krypto-Short-Liquidationen die Rally beschleunigten. Technische Analyse Im 4-Stunden-Zeitrahmen liegt Bitcoin weiterhin unter der Schweren Widerstandszone und nähert sich den Widerstandslinien sowie der kumulierten Hebelung aus Short-Liquidationen ( $83.100-$81.600). Aus Sicht der Elliott-Wellen scheint Bitcoin gerade dabei zu sein, die Impulsive Welle 5 abzuschließen. Ich erwarte eine weitere Abweisung von den Widerstandslinien und eine kurzfristige Korrektur in Richtung der kumulierten Hebelung aus Long-Liquidationen ($80.120-$79.600). Nachdem dieses Liquiditätsniveau erreicht wurde, erwarte ich eine starke bullische Reaktion und einen weiteren Spikes nach oben. Stop Loss (SL): $83.220 (Worst) Wird Bitcoin die kumulierte Hebelung aus Long-Liquidationen erreichen, bevor es die Schwere Widerstandszone durchbricht?
$BTC Erholt sich über $80.000 — Aber Welle 5 könnte kurz vor dem Abschluss stehen Bitcoin eroberte die $80.000-Marke zurück, nachdem Fed-Gouverneur Christopher Waller Unterstützung dafür signalisiert hatte, die Zinsen unverändert zu lassen, während gleichzeitig mehr als $415 Millionen an Krypto-Short-Liquidationen die Rally beschleunigten. Technische Analyse Im 4-Stunden-Zeitrahmen liegt Bitcoin weiterhin unter der Schweren Widerstandszone und nähert sich den Widerstandslinien sowie der kumulierten Hebelung aus Short-Liquidationen ( $83.100-$81.600). Aus Sicht der Elliott-Wellen scheint Bitcoin gerade dabei zu sein, die Impulsive Welle 5 abzuschließen. Ich erwarte eine weitere Abweisung von den Widerstandslinien und eine kurzfristige Korrektur in Richtung der kumulierten Hebelung aus Long-Liquidationen ($80.120-$79.600). Nachdem dieses Liquiditätsniveau erreicht wurde, erwarte ich eine starke bullische Reaktion und einen weiteren Spikes nach oben. Stop Loss (SL): $83.220 (Worst) Wird Bitcoin die kumulierte Hebelung aus Long-Liquidationen erreichen, bevor es die Schwere Widerstandszone durchbricht?
29
·
--
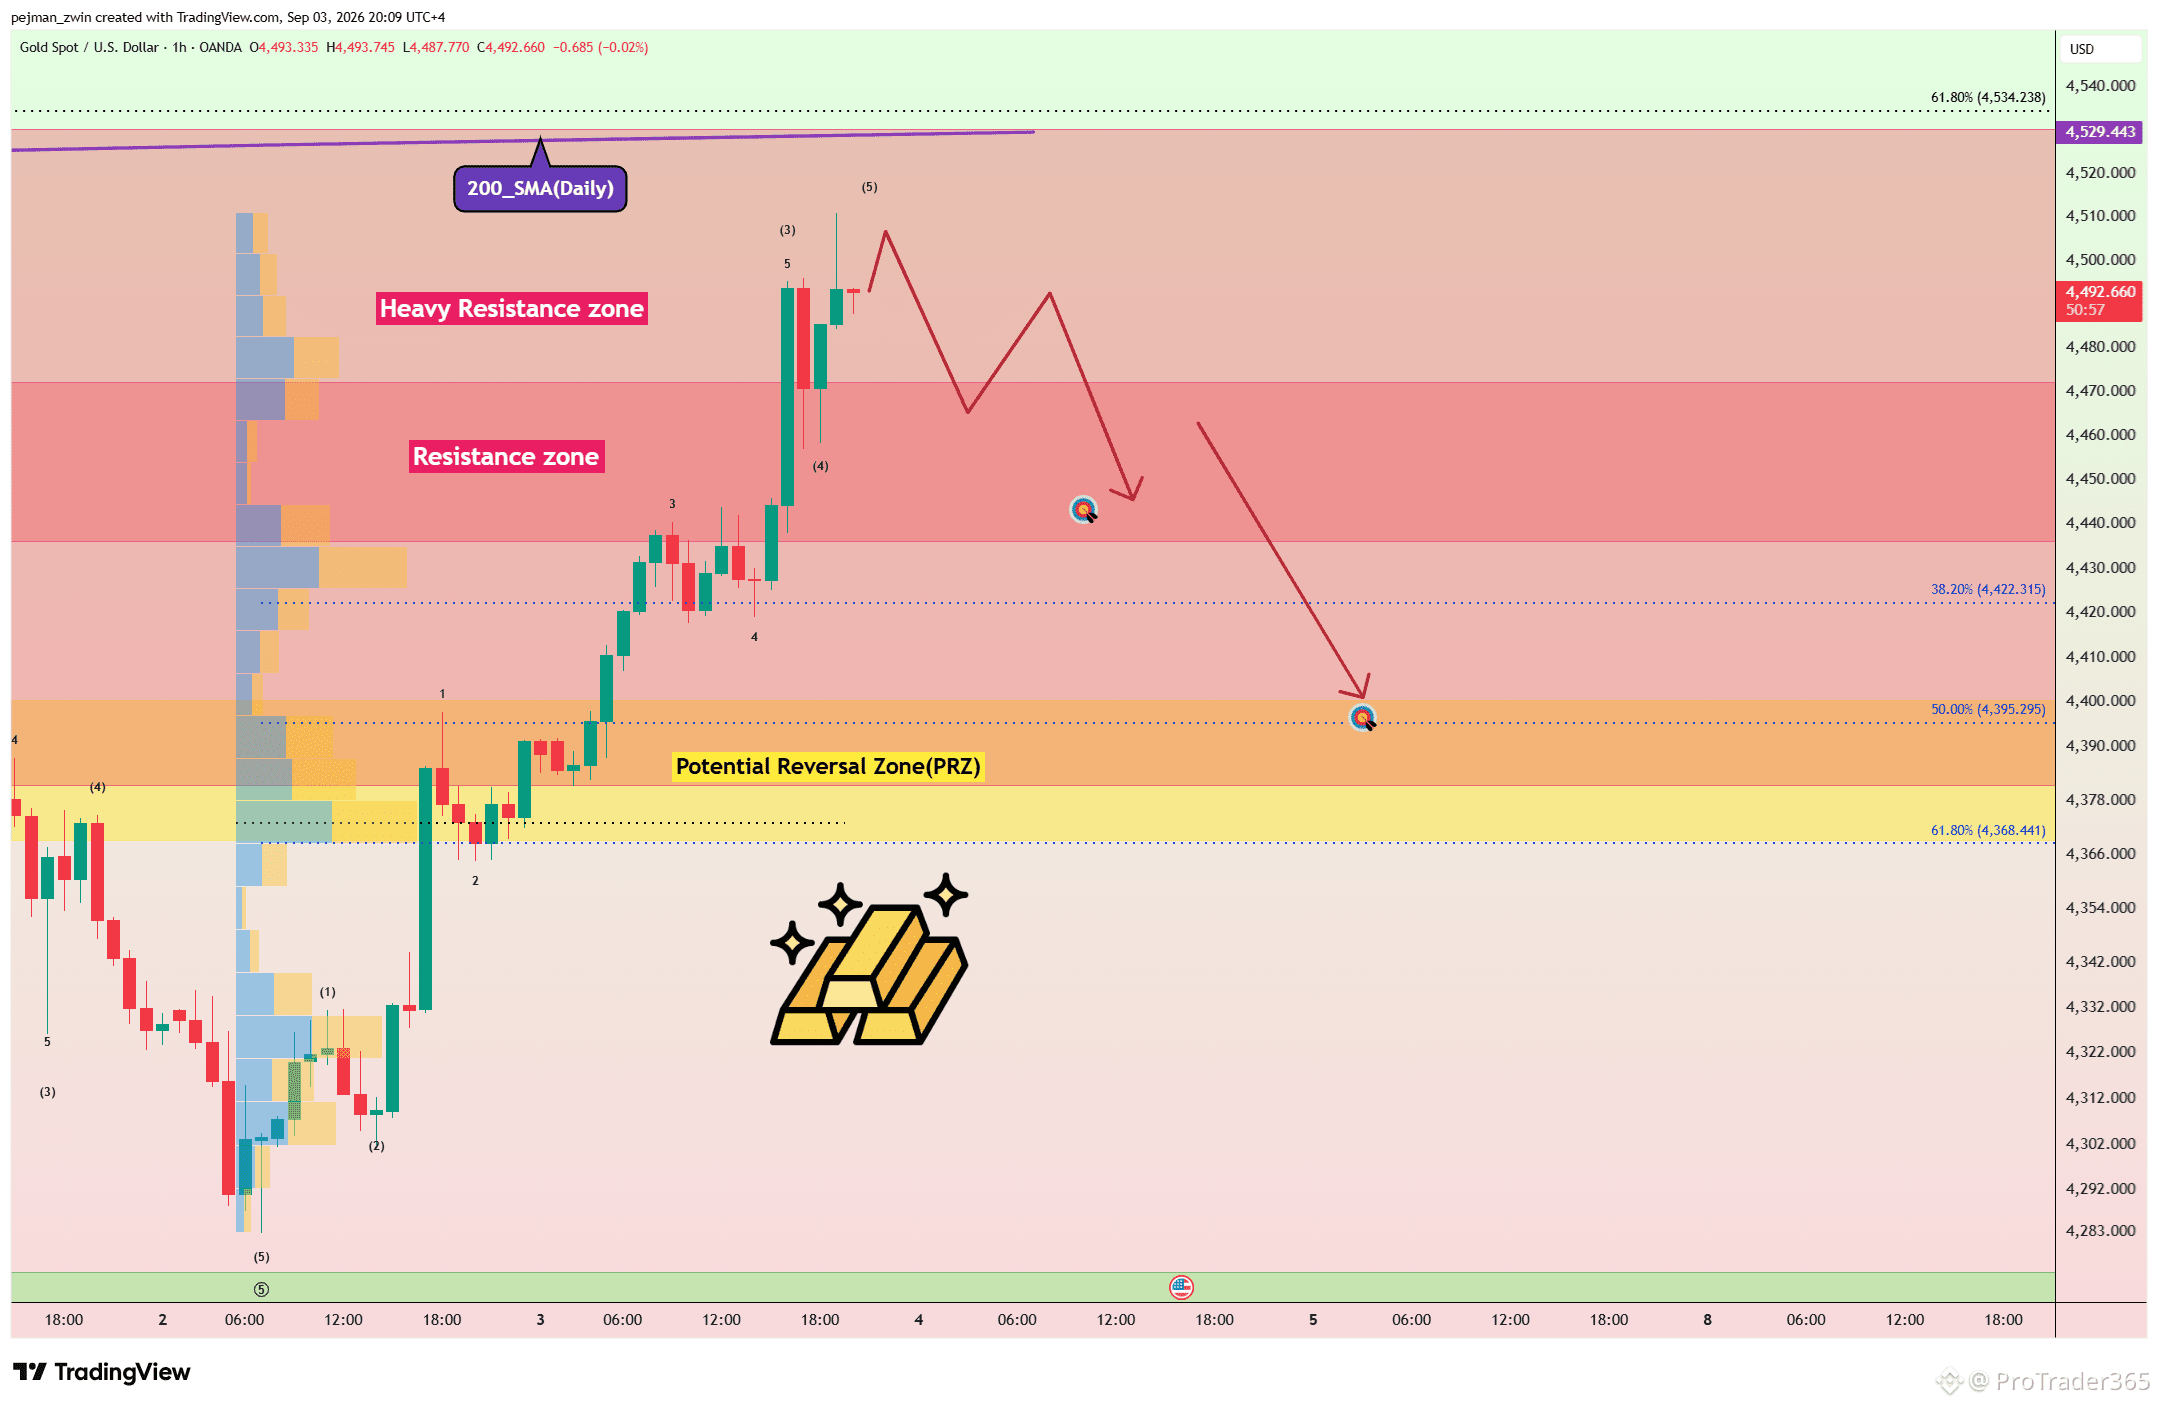
$XAUt Steht dem 200_SMA(Daily) gegenüber — Kommt als Nächstes ein weiterer bärischer Move? Gold hat seinen bullischen Trend in den vergangenen zwei Tagen wieder aufgenommen und wird nun innerhalb der Schweren Widerstandszone gehandelt, oberhalb der Widerstandszone und nahe am 200_SMA(Daily). Allerdings wurde der Ausbruch nicht durch ein starkes Handelsvolumen gestützt. Technische Analyse Ich erwarte nicht, dass Gold beim ersten Versuch den 200_SMA(Daily) zurückerobert. Aus der Perspektive der Elliott-Wellen scheint Gold dabei zu sein, Welle 5 abzuschließen. Wenn Gold wieder unter die Widerstandszone fällt, könnte die Korrektur sich in Richtung der Möglichen Umkehrzone (PRZ)[$4,400-$4,368] fortsetzen. Stop Loss (SL): $4,543 Kann Gold den 200_SMA(Daily) zurückerobern, oder beginnt die Korrektur zuerst? #Gold
$XAUt Steht dem 200_SMA(Daily) gegenüber — Kommt als Nächstes ein weiterer bärischer Move? Gold hat seinen bullischen Trend in den vergangenen zwei Tagen wieder aufgenommen und wird nun innerhalb der Schweren Widerstandszone gehandelt, oberhalb der Widerstandszone und nahe am 200_SMA(Daily). Allerdings wurde der Ausbruch nicht durch ein starkes Handelsvolumen gestützt. Technische Analyse Ich erwarte nicht, dass Gold beim ersten Versuch den 200_SMA(Daily) zurückerobert. Aus der Perspektive der Elliott-Wellen scheint Gold dabei zu sein, Welle 5 abzuschließen. Wenn Gold wieder unter die Widerstandszone fällt, könnte die Korrektur sich in Richtung der Möglichen Umkehrzone (PRZ)[$4,400-$4,368] fortsetzen. Stop Loss (SL): $4,543 Kann Gold den 200_SMA(Daily) zurückerobern, oder beginnt die Korrektur zuerst? #Gold
38
·
--
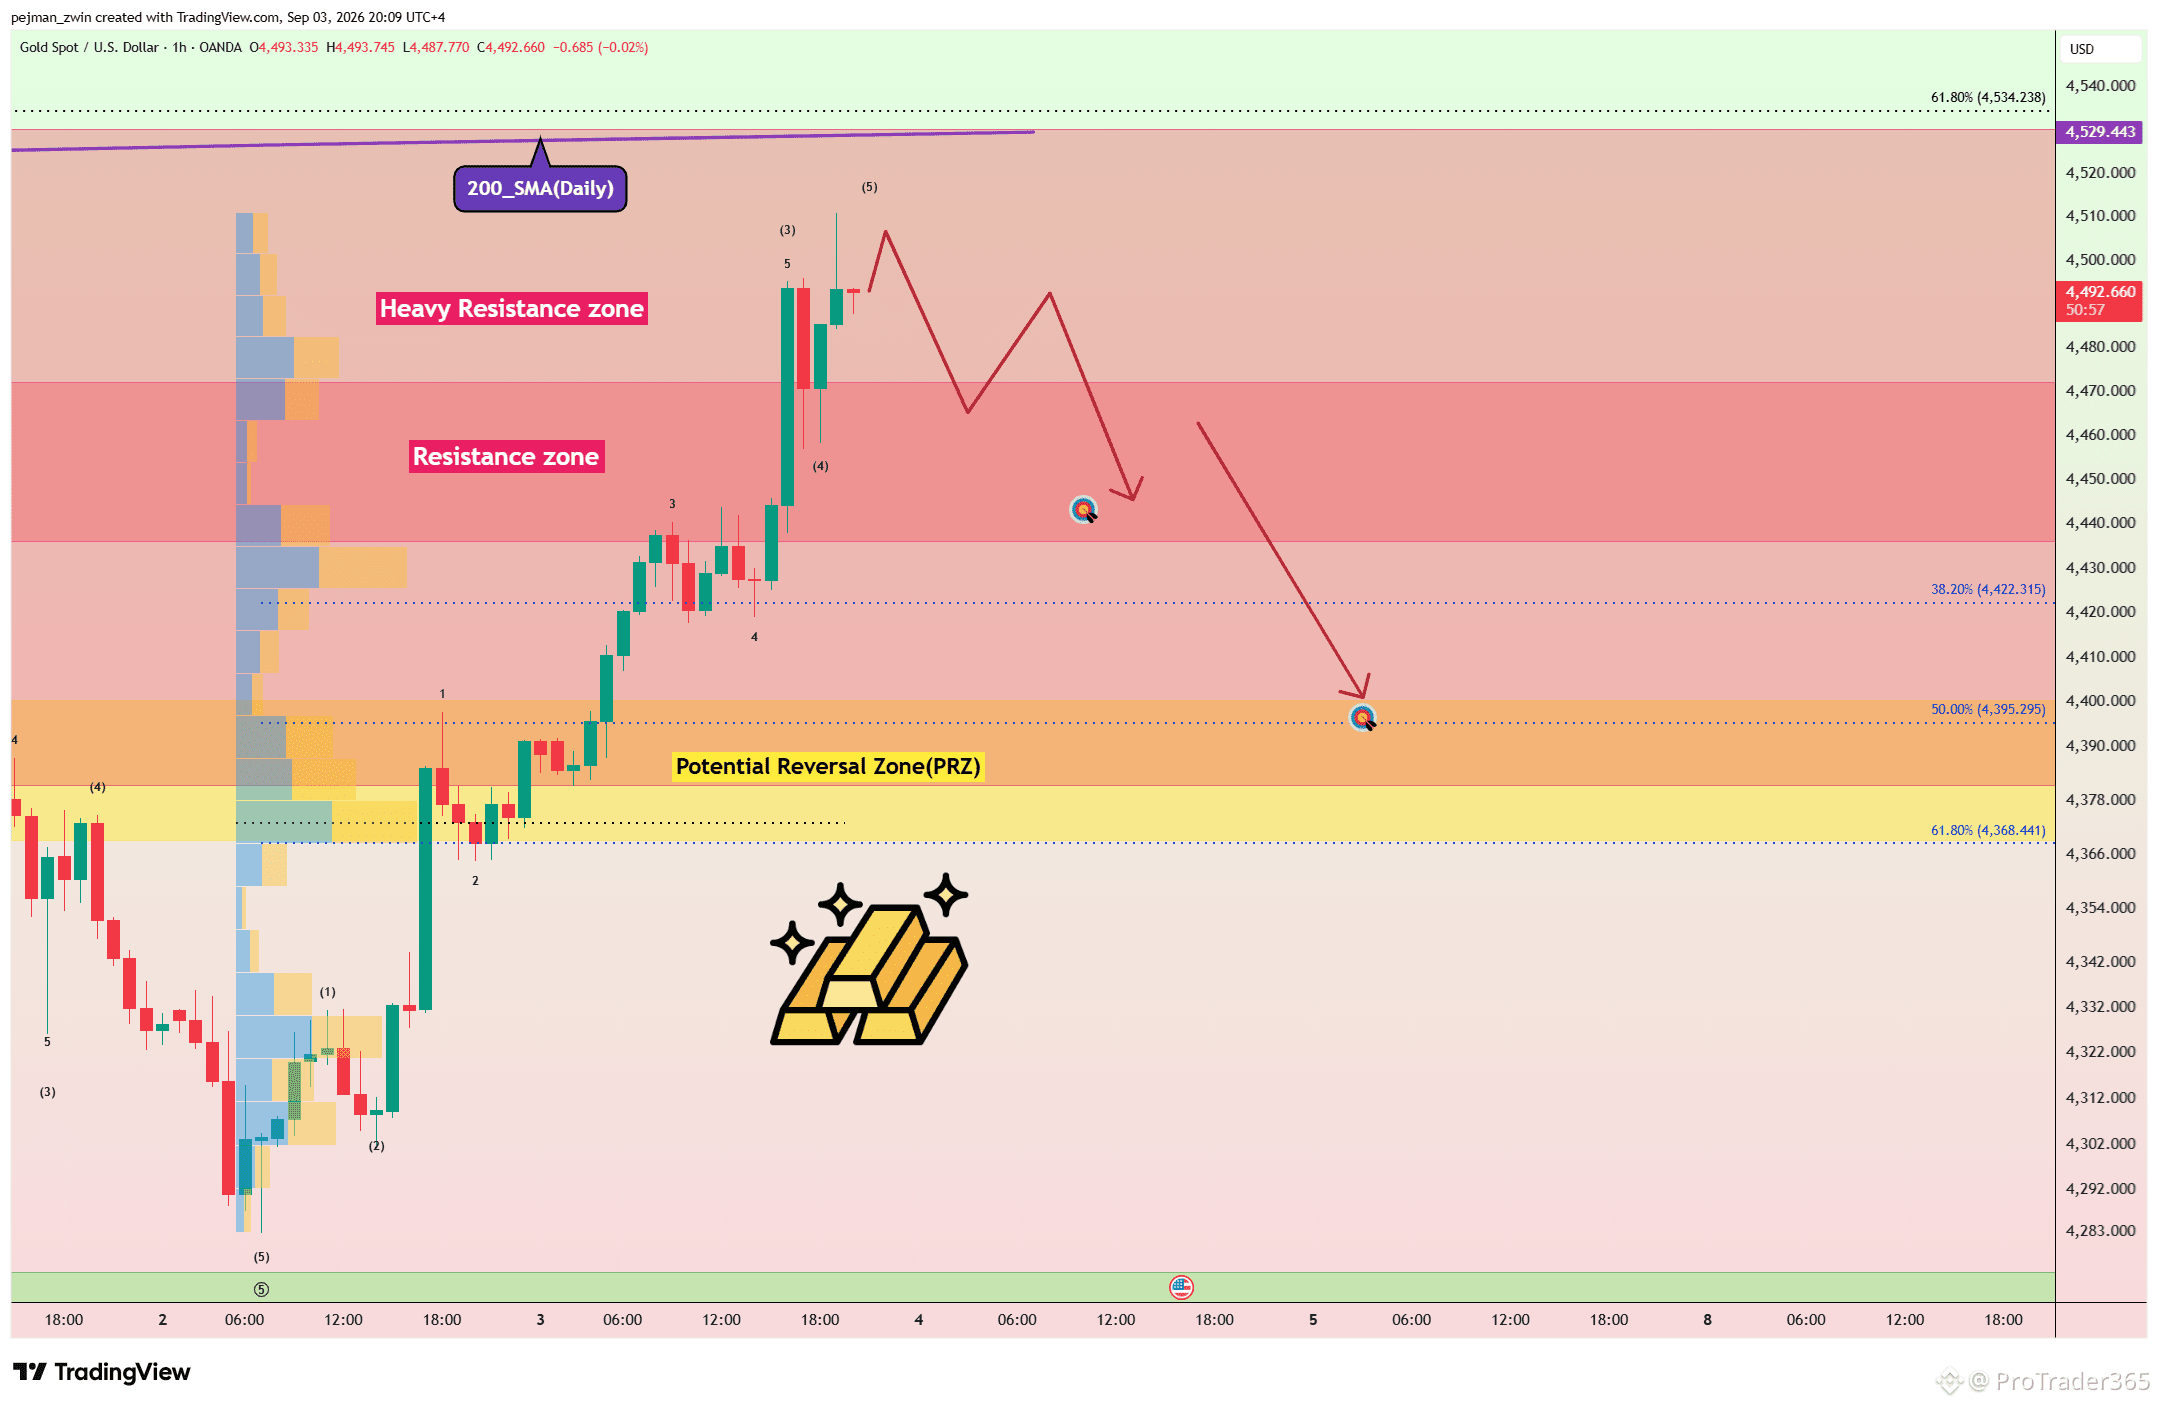
$XAUt Faceiert den 200_SMA(Daily) — Steht der nächste bärische Move bevor? Gold hat seine bullische Tendenz in den letzten zwei Tagen wieder aufgenommen und wird nun innerhalb der Schweren Widerstandszone gehandelt, oberhalb der Widerstandszone und nahe der 200_SMA(Daily). Allerdings wurde der Ausbruch nicht von starkem Handelsvolumen unterstützt. Technische Analyse Ich erwarte nicht, dass Gold beim ersten Versuch die 200_SMA(Daily) zurückerobert. Aus Sicht der Elliott-Wellen scheint Gold dabei zu sein, Welle 3 von Welle C in einer Flat-Korrektur abzuschließen, wobei sich Welle 3 als eine Extended Wave entwickelt. Außerdem ist eine Positive Regular Divergence (RD+) zwischen zwei aufeinanderfolgenden Tiefs zu erkennen. Nach Abschluss von Welle 3 erwarte ich einen weiteren bärischen Move in Richtung $4,443. Wenn Gold wieder unter die Widerstandszone fällt, könnte sich die Korrektur in Richtung der Potenziellen Umkehrzone (PRZ) [$4,400-$4,368] ausdehnen. Stop Loss (SL): $4,543 Kann Gold die 200_SMA(Daily) zurückerobern, oder beginnt die Korrektur zuerst? #Gold
$XAUt Faceiert den 200_SMA(Daily) — Steht der nächste bärische Move bevor? Gold hat seine bullische Tendenz in den letzten zwei Tagen wieder aufgenommen und wird nun innerhalb der Schweren Widerstandszone gehandelt, oberhalb der Widerstandszone und nahe der 200_SMA(Daily). Allerdings wurde der Ausbruch nicht von starkem Handelsvolumen unterstützt. Technische Analyse Ich erwarte nicht, dass Gold beim ersten Versuch die 200_SMA(Daily) zurückerobert. Aus Sicht der Elliott-Wellen scheint Gold dabei zu sein, Welle 3 von Welle C in einer Flat-Korrektur abzuschließen, wobei sich Welle 3 als eine Extended Wave entwickelt. Außerdem ist eine Positive Regular Divergence (RD+) zwischen zwei aufeinanderfolgenden Tiefs zu erkennen. Nach Abschluss von Welle 3 erwarte ich einen weiteren bärischen Move in Richtung $4,443. Wenn Gold wieder unter die Widerstandszone fällt, könnte sich die Korrektur in Richtung der Potenziellen Umkehrzone (PRZ) [$4,400-$4,368] ausdehnen. Stop Loss (SL): $4,543 Kann Gold die 200_SMA(Daily) zurückerobern, oder beginnt die Korrektur zuerst? #Gold
58
·
--
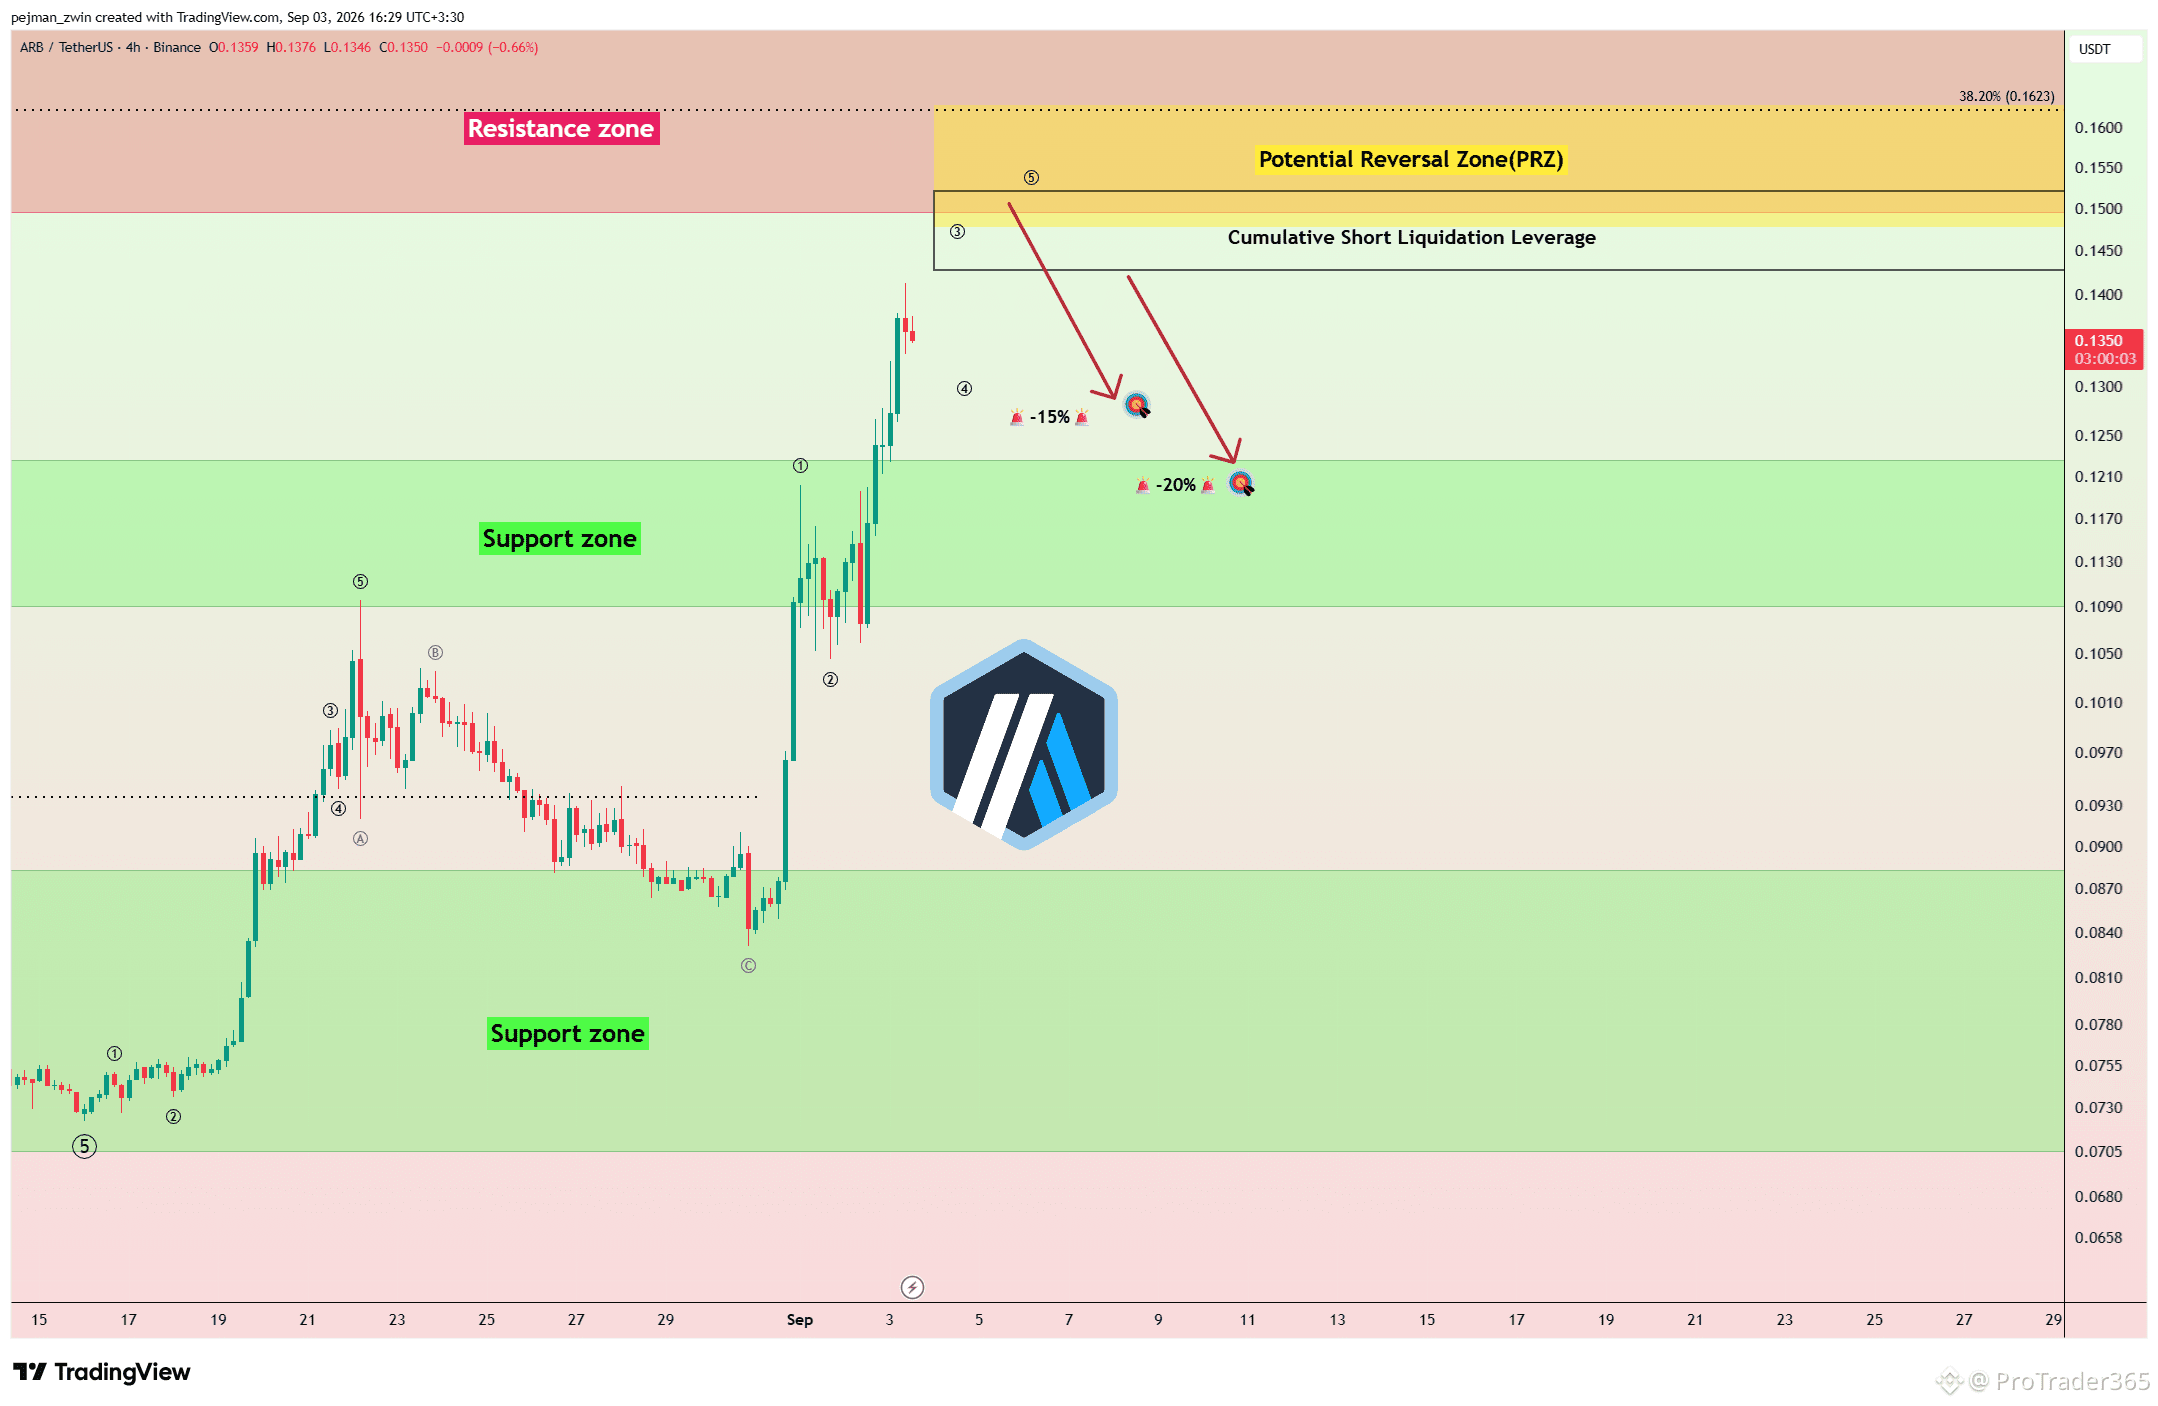
$ARB Rally trifft auf eine große PRZ — steht eine Korrektur als Nächstes an? ARB ist deutlich nach oben gelaufen, da die Robinhood Chain die grundlegenden Aussichten für Arbitrum stärkt: durch steigende DEX-Aktivität, Protokollumsätze und die Rückführung von 10% der Netto-Protokolleinnahmen in das Arbitrum-Ökosystem. Technische Analyse Im 4-Stunden-Zeitrahmen nähert sich ARB der Widerstandszone, der Kumulation der Short-Liquidation-Leverage ($0.142-$0.152) und der potenziellen Umkehrzone (PRZ) [$0.148-$0.163]. Allerdings nimmt das Handelsvolumen ab, während der Kurs weiter steigt—das erzeugt eine negative Divergenz zwischen Preis und Volumen. Aus Sicht der Elliott-Wave-Analyse scheint ARB außerdem eine fünfwellige impulsive Struktur abzuschließen, wobei die letzte Welle möglicherweise innerhalb der PRZ endet. Ich erwarte eine Korrekturbewegung von diesem Bereich aus in Richtung $0.127; ein stärkerer bärischer Impuls könnte den Rückgang möglicherweise bis $0.121 verlängern. Stop Loss (SL): $0.169 Wird ARB aus der PRZ nach unten abweisen und die Korrektur starten, oder zuerst über $0.169 ausbrechen? #Arbitrum
$ARB Rally trifft auf eine große PRZ — steht eine Korrektur als Nächstes an? ARB ist deutlich nach oben gelaufen, da die Robinhood Chain die grundlegenden Aussichten für Arbitrum stärkt: durch steigende DEX-Aktivität, Protokollumsätze und die Rückführung von 10% der Netto-Protokolleinnahmen in das Arbitrum-Ökosystem. Technische Analyse Im 4-Stunden-Zeitrahmen nähert sich ARB der Widerstandszone, der Kumulation der Short-Liquidation-Leverage ($0.142-$0.152) und der potenziellen Umkehrzone (PRZ) [$0.148-$0.163]. Allerdings nimmt das Handelsvolumen ab, während der Kurs weiter steigt—das erzeugt eine negative Divergenz zwischen Preis und Volumen. Aus Sicht der Elliott-Wave-Analyse scheint ARB außerdem eine fünfwellige impulsive Struktur abzuschließen, wobei die letzte Welle möglicherweise innerhalb der PRZ endet. Ich erwarte eine Korrekturbewegung von diesem Bereich aus in Richtung $0.127; ein stärkerer bärischer Impuls könnte den Rückgang möglicherweise bis $0.121 verlängern. Stop Loss (SL): $0.169 Wird ARB aus der PRZ nach unten abweisen und die Korrektur starten, oder zuerst über $0.169 ausbrechen? #Arbitrum
62
Anmelden und weiter Inhalte entdecken
Krypto-Nutzer weltweit auf Binance Square kennenlernen
⚡️ Bleib in Sachen Krypto stets am Puls.
💬 Die weltgrößte Kryptobörse vertraut darauf.
👍 Erhalte verlässliche Einblicke von verifizierten Creators.
E-Mail-Adresse/Telefonnummer
Trendthemen
BOJRaisesRatesTo31YearHigh
10,298 Aufrufe
350 Kommentare
Bitcoin rückt wieder ins Rampenlicht, da der Makrodruck die Krypto-Nachfrage nicht durchbrechen kann
Fatima_Tariq
·5 Likes
·3.6k Aufrufe
BuffettStepsDownAsBerkshireChairman
1,377 Aufrufe
85 Kommentare
XRPExchangeReservesHitSevenYearLow
3,102 Aufrufe
135 Kommentare