
Chartora_ 观图链 _Blockchain
3.5k منشورات

Chartora_ 观图链 _Blockchain
إبلاغ
حظر المُستخدم
******ALTCOINS__TRADER*******
فتح تداول
مُتداول مُتكرر
2.2 سنوات
2 تتابع
334 المتابعون
2.2K+ إعجاب
منشورات
الحافظة الاستثمارية
الكل
اقتباسات
مقاطع فيديو
عرض الترجمة
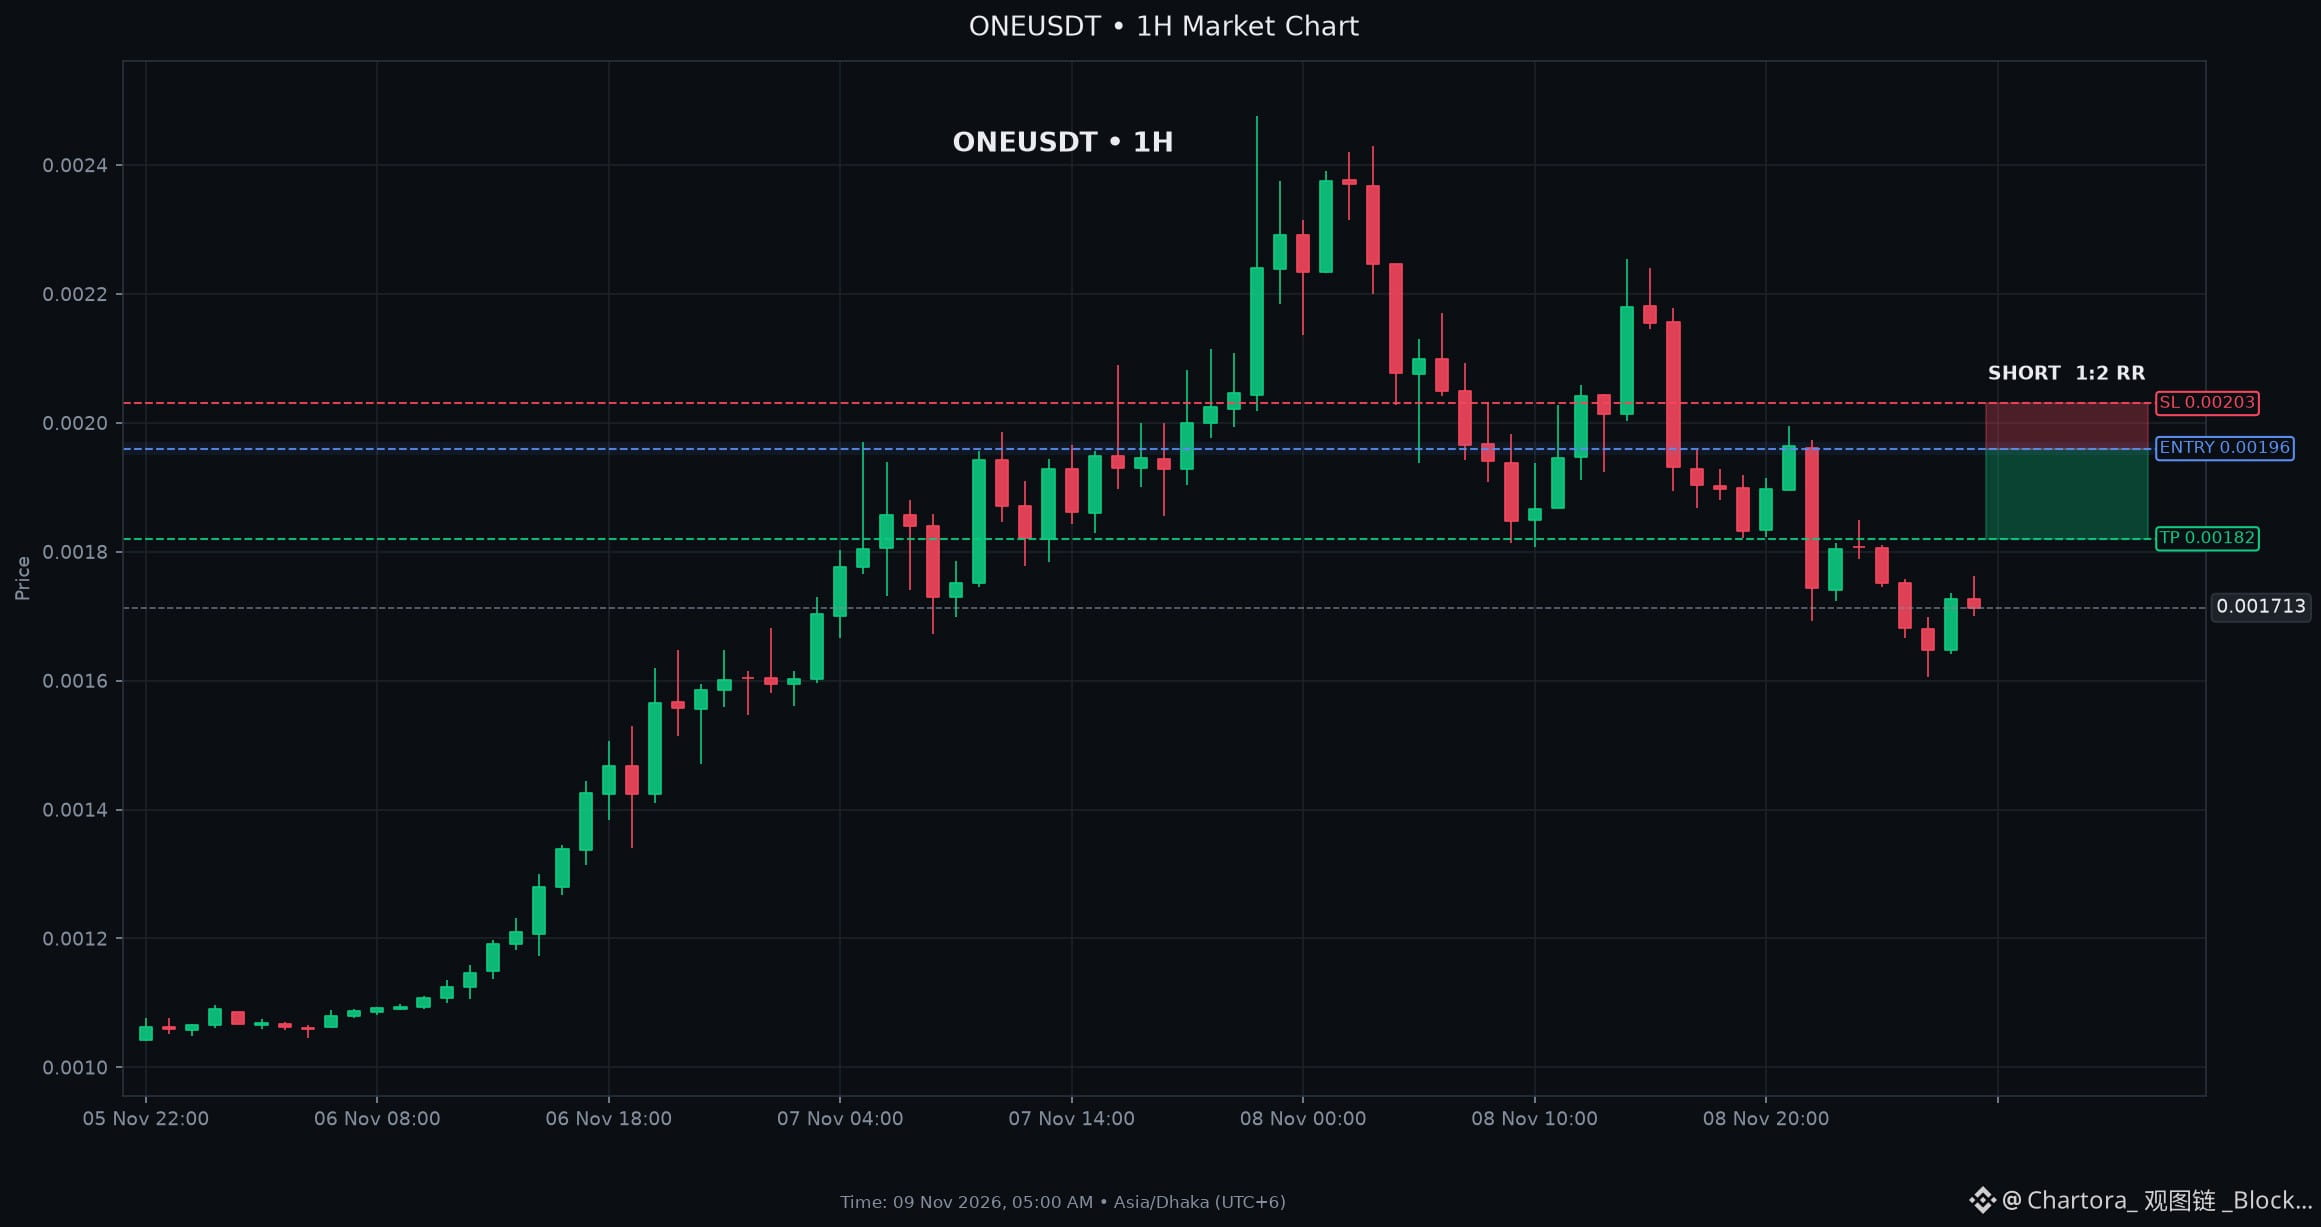
$ONE: Bearish Continuation Pattern Confirmed on $ONE Chart Structure
SHORT SETUP ONE
Entry: $0.00195 - $0.00197
Stop Loss: $0.00203
Take Profit: $0.00182 (2R)
Key Levels: Support $0.001692 | Resistance $0.00197
Technical Analysis for $ONE: The EMA9, EMA21 and EMA50 sit above the 0.001713 price, while the MACD line remains below its signal and the histogram is negative, signalling bearish momentum. With price near the 1H resistance at 0.00197, the setup favors a short move toward the 0.00169 support. Together, these indicators favor SHORT continuation toward support.
Market Context: BTC is in a bearish 4H and 1D trend, down 1.35% over 24h, and the overall market is broadly negative with 94.9%
SHORT $ONE
$ONE : Bearish Continuation Pattern Confirmed on $ONE Chart Structure
SHORT SETUP ONE
Entry: $0.00195 - $0.00197
Stop Loss: $0.00203
Take Profit: $0.00182 (2R)
Key Levels: Support $0.001692 | Resistance $0.00197
Technical Analysis for $ONE : The EMA9, EMA21 and EMA50 sit above the 0.001713 price, while the MACD line remains below its signal and the histogram is negative, signalling bearish momentum. With price near the 1H resistance at 0.00197, the setup favors a short move toward the 0.00169 support. Together, these indicators favor SHORT continuation toward support.
Market Context: BTC is in a bearish 4H and 1D trend, down 1.35% over 24h, and the overall market is broadly negative with 94.9%
SHORT $ONE
SHORT SETUP ONE
Entry: $0.00195 - $0.00197
Stop Loss: $0.00203
Take Profit: $0.00182 (2R)
Key Levels: Support $0.001692 | Resistance $0.00197
Technical Analysis for $ONE : The EMA9, EMA21 and EMA50 sit above the 0.001713 price, while the MACD line remains below its signal and the histogram is negative, signalling bearish momentum. With price near the 1H resistance at 0.00197, the setup favors a short move toward the 0.00169 support. Together, these indicators favor SHORT continuation toward support.
Market Context: BTC is in a bearish 4H and 1D trend, down 1.35% over 24h, and the overall market is broadly negative with 94.9%
SHORT $ONE
عرض الترجمة
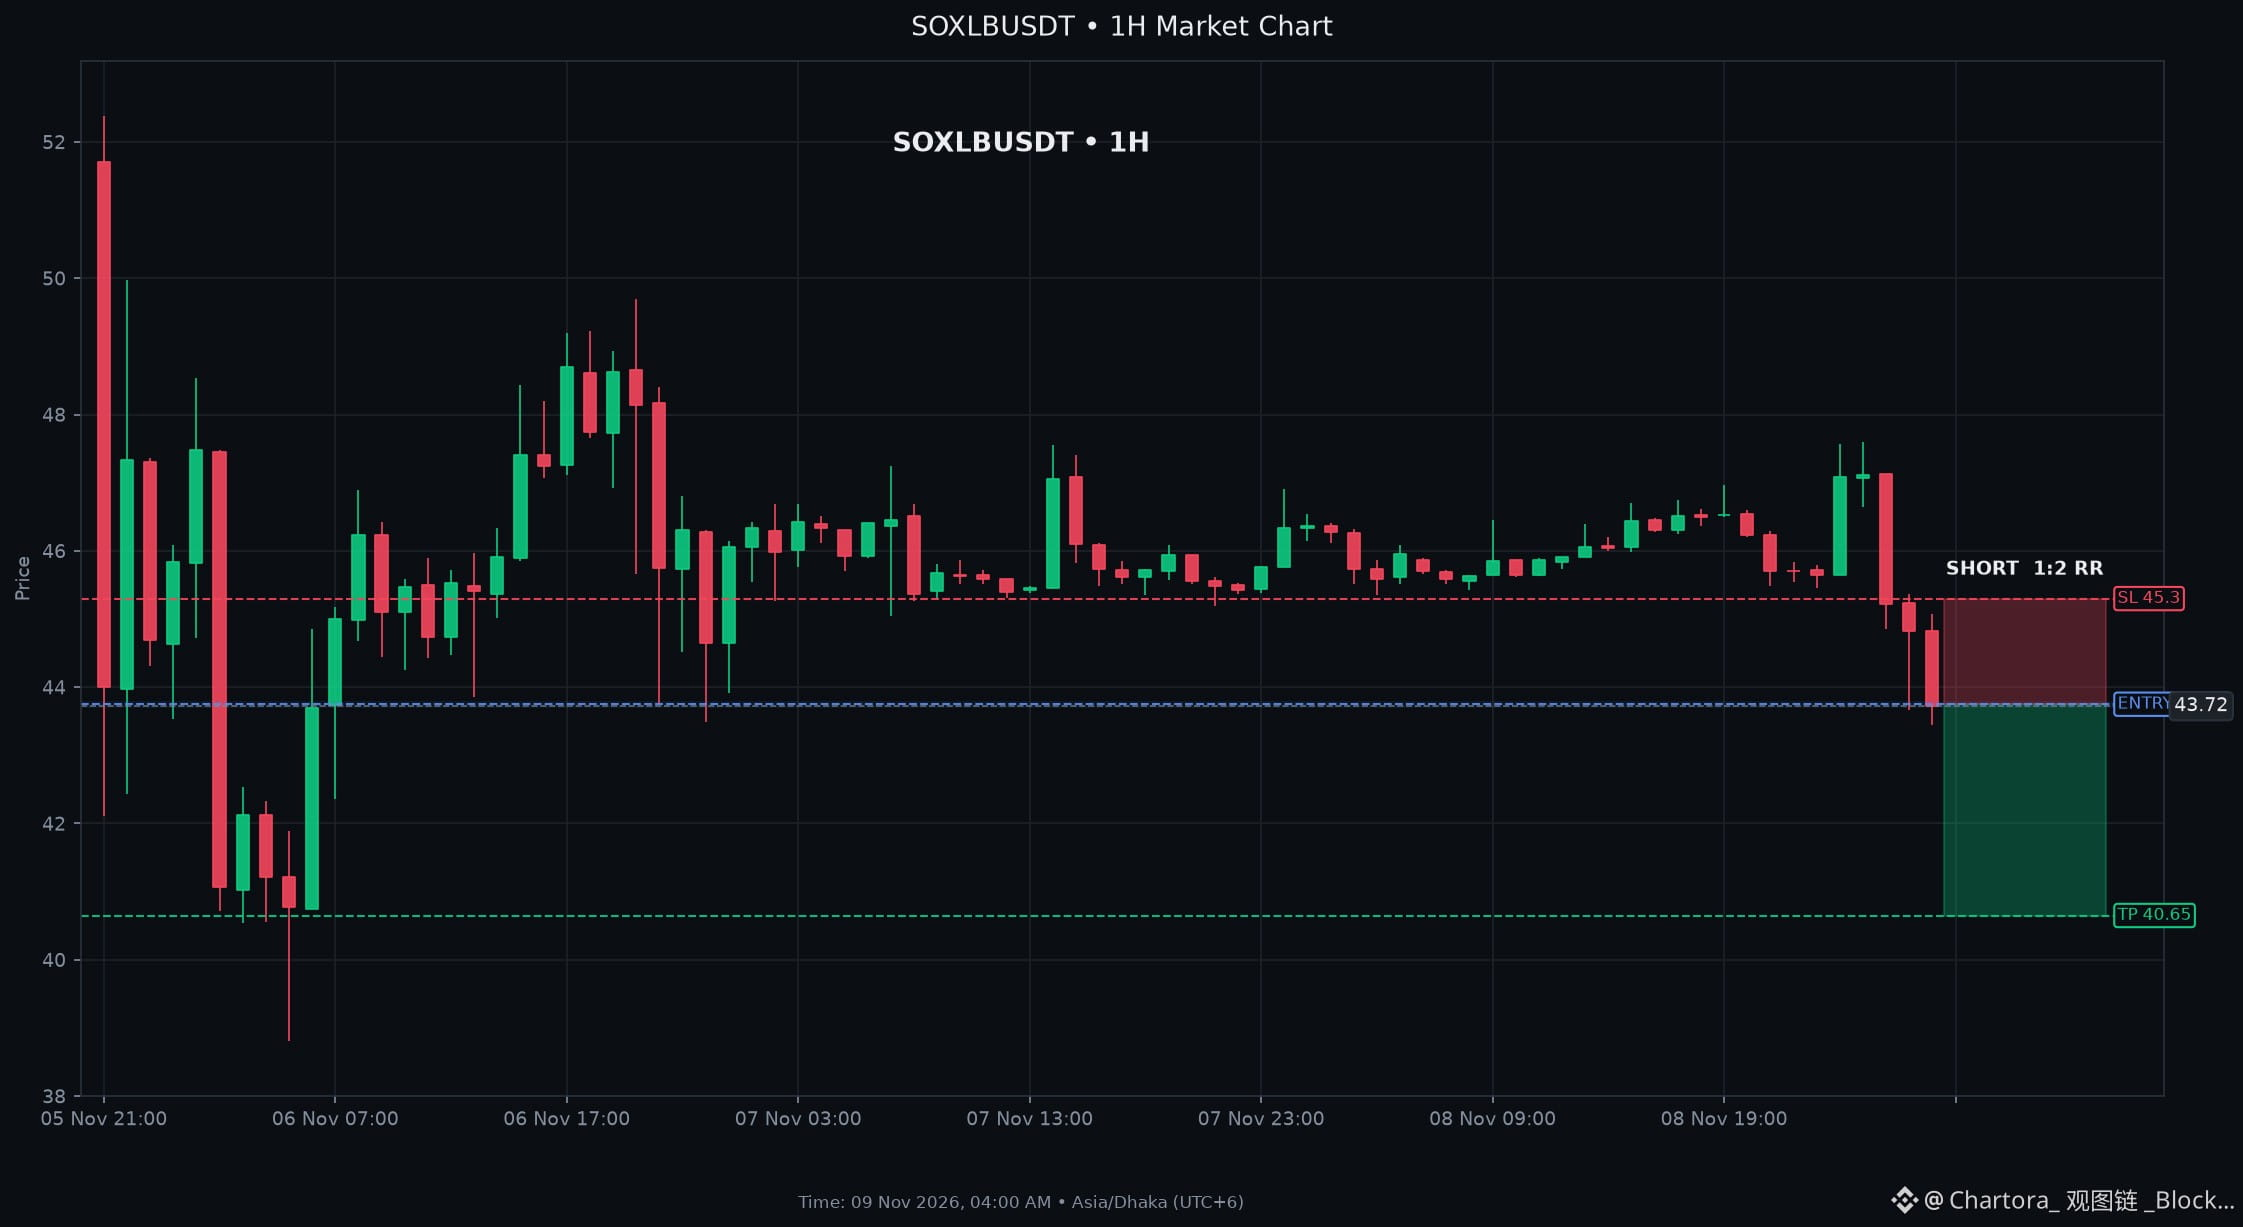
$SOXLB: Technical Signals Turn Negative as $SOXLB Selling Pressure Rises
SHORT SETUP SOXLB
Entry: $43.7000 - $43.8000
Stop Loss: $45.3000
Take Profit: $40.6500 (2R)
Key Levels: Support $43.4900 | Resistance $46.0800
Technical Analysis for $SOXLB: Price sits below EMA9, EMA21, EMA50 and EMA200, confirming bearish trend. MACD line remains under its signal with a negative histogram, adding downside pressure. RSI at 32 and Stochastic K at 6.5 signal oversold conditions but still favor a continuation. Bollinger lower band is breached, supporting a short bias near the 1hour support of 43.49.
Market Context: BTC remains in a bearish 4hour and daily trend, down 1.3% today, while overall market breadth is heavily negative (94% red). This
SHORT $SOXLB
$SOXLB : Technical Signals Turn Negative as $SOXLB Selling Pressure Rises
SHORT SETUP SOXLB
Entry: $43.7000 - $43.8000
Stop Loss: $45.3000
Take Profit: $40.6500 (2R)
Key Levels: Support $43.4900 | Resistance $46.0800
Technical Analysis for $SOXLB : Price sits below EMA9, EMA21, EMA50 and EMA200, confirming bearish trend. MACD line remains under its signal with a negative histogram, adding downside pressure. RSI at 32 and Stochastic K at 6.5 signal oversold conditions but still favor a continuation. Bollinger lower band is breached, supporting a short bias near the 1hour support of 43.49.
Market Context: BTC remains in a bearish 4hour and daily trend, down 1.3% today, while overall market breadth is heavily negative (94% red). This
SHORT $SOXLB
SHORT SETUP SOXLB
Entry: $43.7000 - $43.8000
Stop Loss: $45.3000
Take Profit: $40.6500 (2R)
Key Levels: Support $43.4900 | Resistance $46.0800
Technical Analysis for $SOXLB : Price sits below EMA9, EMA21, EMA50 and EMA200, confirming bearish trend. MACD line remains under its signal with a negative histogram, adding downside pressure. RSI at 32 and Stochastic K at 6.5 signal oversold conditions but still favor a continuation. Bollinger lower band is breached, supporting a short bias near the 1hour support of 43.49.
Market Context: BTC remains in a bearish 4hour and daily trend, down 1.3% today, while overall market breadth is heavily negative (94% red). This
SHORT $SOXLB
عرض الترجمة
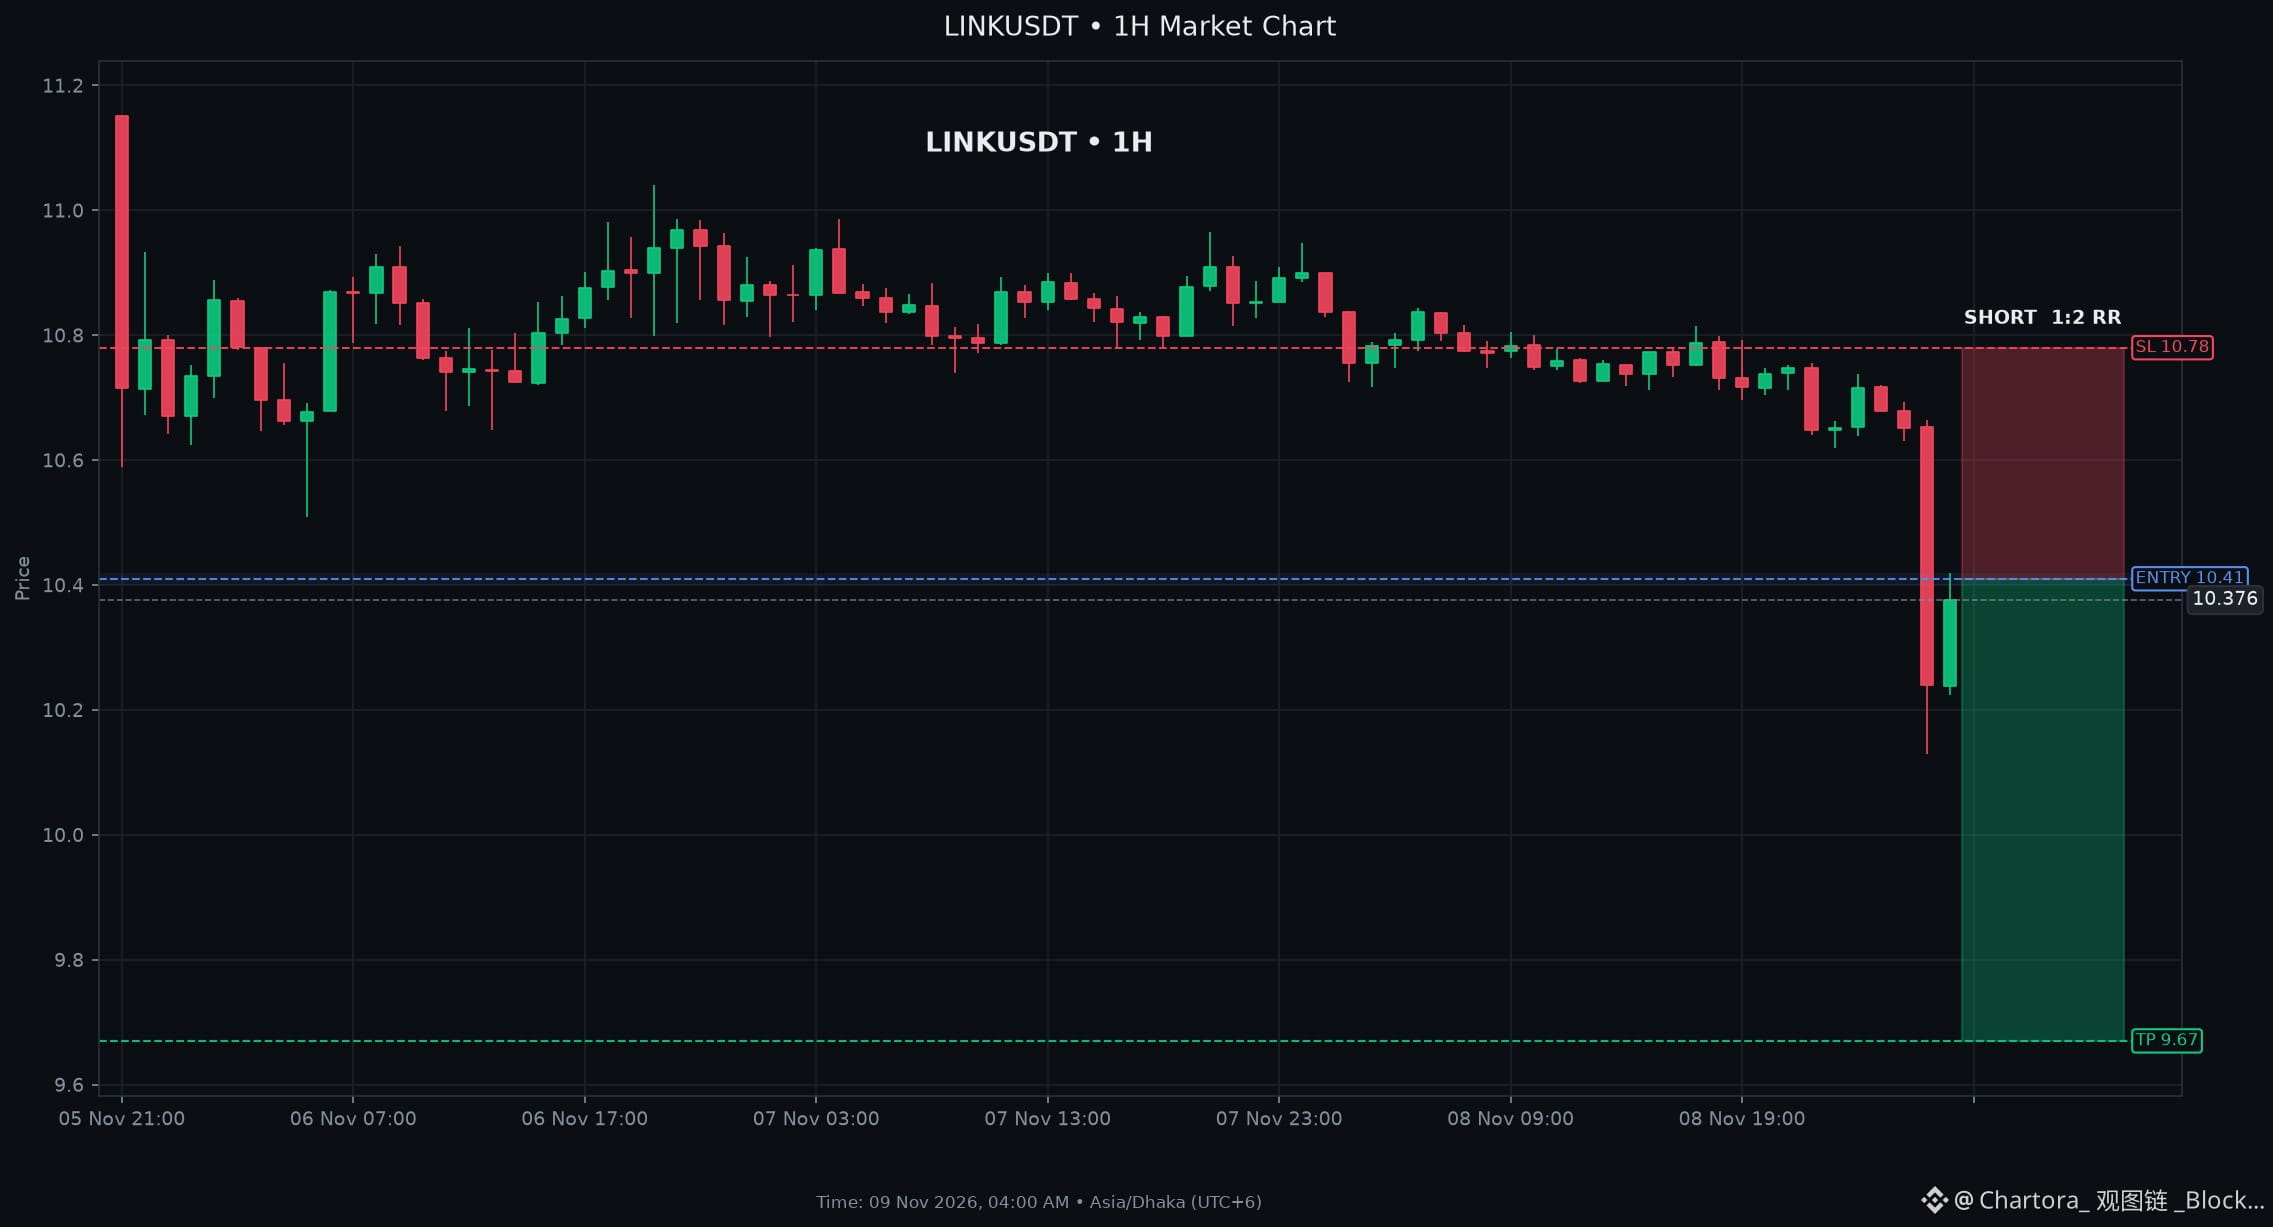
$LINK: Bearish Continuation Pattern Confirmed on $LINK Chart Structure
SHORT SETUP LINK
Entry: $10.4000 - $10.4200
Stop Loss: $10.7800
Take Profit: $9.6700 (2R)
Key Levels: Support $10.1300 | Resistance $10.7560
Technical Analysis for $LINK: The EMA hierarchy sits above price (EMA9200), MACD line remains under its signal and the histogram is negative, signaling bearish momentum. RSI at 31.7 and price just under the lower Bollinger band suggest oversold conditions, but ADX is weak. With price trapped between the 1hour support 10.13 and resistance 10.756, the indicators favor a short bias.
Market Context: BTC remains in a broader bearish trend on both 4hour and daily charts, with price below its 20 and 50EMA, reinforcing negative
SHORT $LINK
$LINK : Bearish Continuation Pattern Confirmed on $LINK Chart Structure
SHORT SETUP LINK
Entry: $10.4000 - $10.4200
Stop Loss: $10.7800
Take Profit: $9.6700 (2R)
Key Levels: Support $10.1300 | Resistance $10.7560
Technical Analysis for $LINK : The EMA hierarchy sits above price (EMA9200), MACD line remains under its signal and the histogram is negative, signaling bearish momentum. RSI at 31.7 and price just under the lower Bollinger band suggest oversold conditions, but ADX is weak. With price trapped between the 1hour support 10.13 and resistance 10.756, the indicators favor a short bias.
Market Context: BTC remains in a broader bearish trend on both 4hour and daily charts, with price below its 20 and 50EMA, reinforcing negative
SHORT $LINK
SHORT SETUP LINK
Entry: $10.4000 - $10.4200
Stop Loss: $10.7800
Take Profit: $9.6700 (2R)
Key Levels: Support $10.1300 | Resistance $10.7560
Technical Analysis for $LINK : The EMA hierarchy sits above price (EMA9200), MACD line remains under its signal and the histogram is negative, signaling bearish momentum. RSI at 31.7 and price just under the lower Bollinger band suggest oversold conditions, but ADX is weak. With price trapped between the 1hour support 10.13 and resistance 10.756, the indicators favor a short bias.
Market Context: BTC remains in a broader bearish trend on both 4hour and daily charts, with price below its 20 and 50EMA, reinforcing negative
SHORT $LINK
عرض الترجمة
Ethereum ($ETH): Vitalik pivots ETH to store of value, crypto suffers after US midterms
Vitalik Buterin wants Ethereum to embrace a store of value narrative, a stance that has upset Bitcoin maximalists.
The broader crypto industry is confronting an uncertain future after the recent U.S. midterm elections.
This pivot underscores a potential re‑positioning of Ethereum’s role in the market and may shape sentiment as the sector adjusts to post‑election dynamics.
**$ETH**
Ethereum ($ETH ): Vitalik pivots ETH to store of value, crypto suffers after US midterms
Vitalik Buterin wants Ethereum to embrace a store of value narrative, a stance that has upset Bitcoin maximalists.
The broader crypto industry is confronting an uncertain future after the recent U.S. midterm elections.
This pivot underscores a potential re‑positioning of Ethereum’s role in the market and may shape sentiment as the sector adjusts to post‑election dynamics.
**$ETH **
Vitalik Buterin wants Ethereum to embrace a store of value narrative, a stance that has upset Bitcoin maximalists.
The broader crypto industry is confronting an uncertain future after the recent U.S. midterm elections.
This pivot underscores a potential re‑positioning of Ethereum’s role in the market and may shape sentiment as the sector adjusts to post‑election dynamics.
**$ETH **

عرض الترجمة
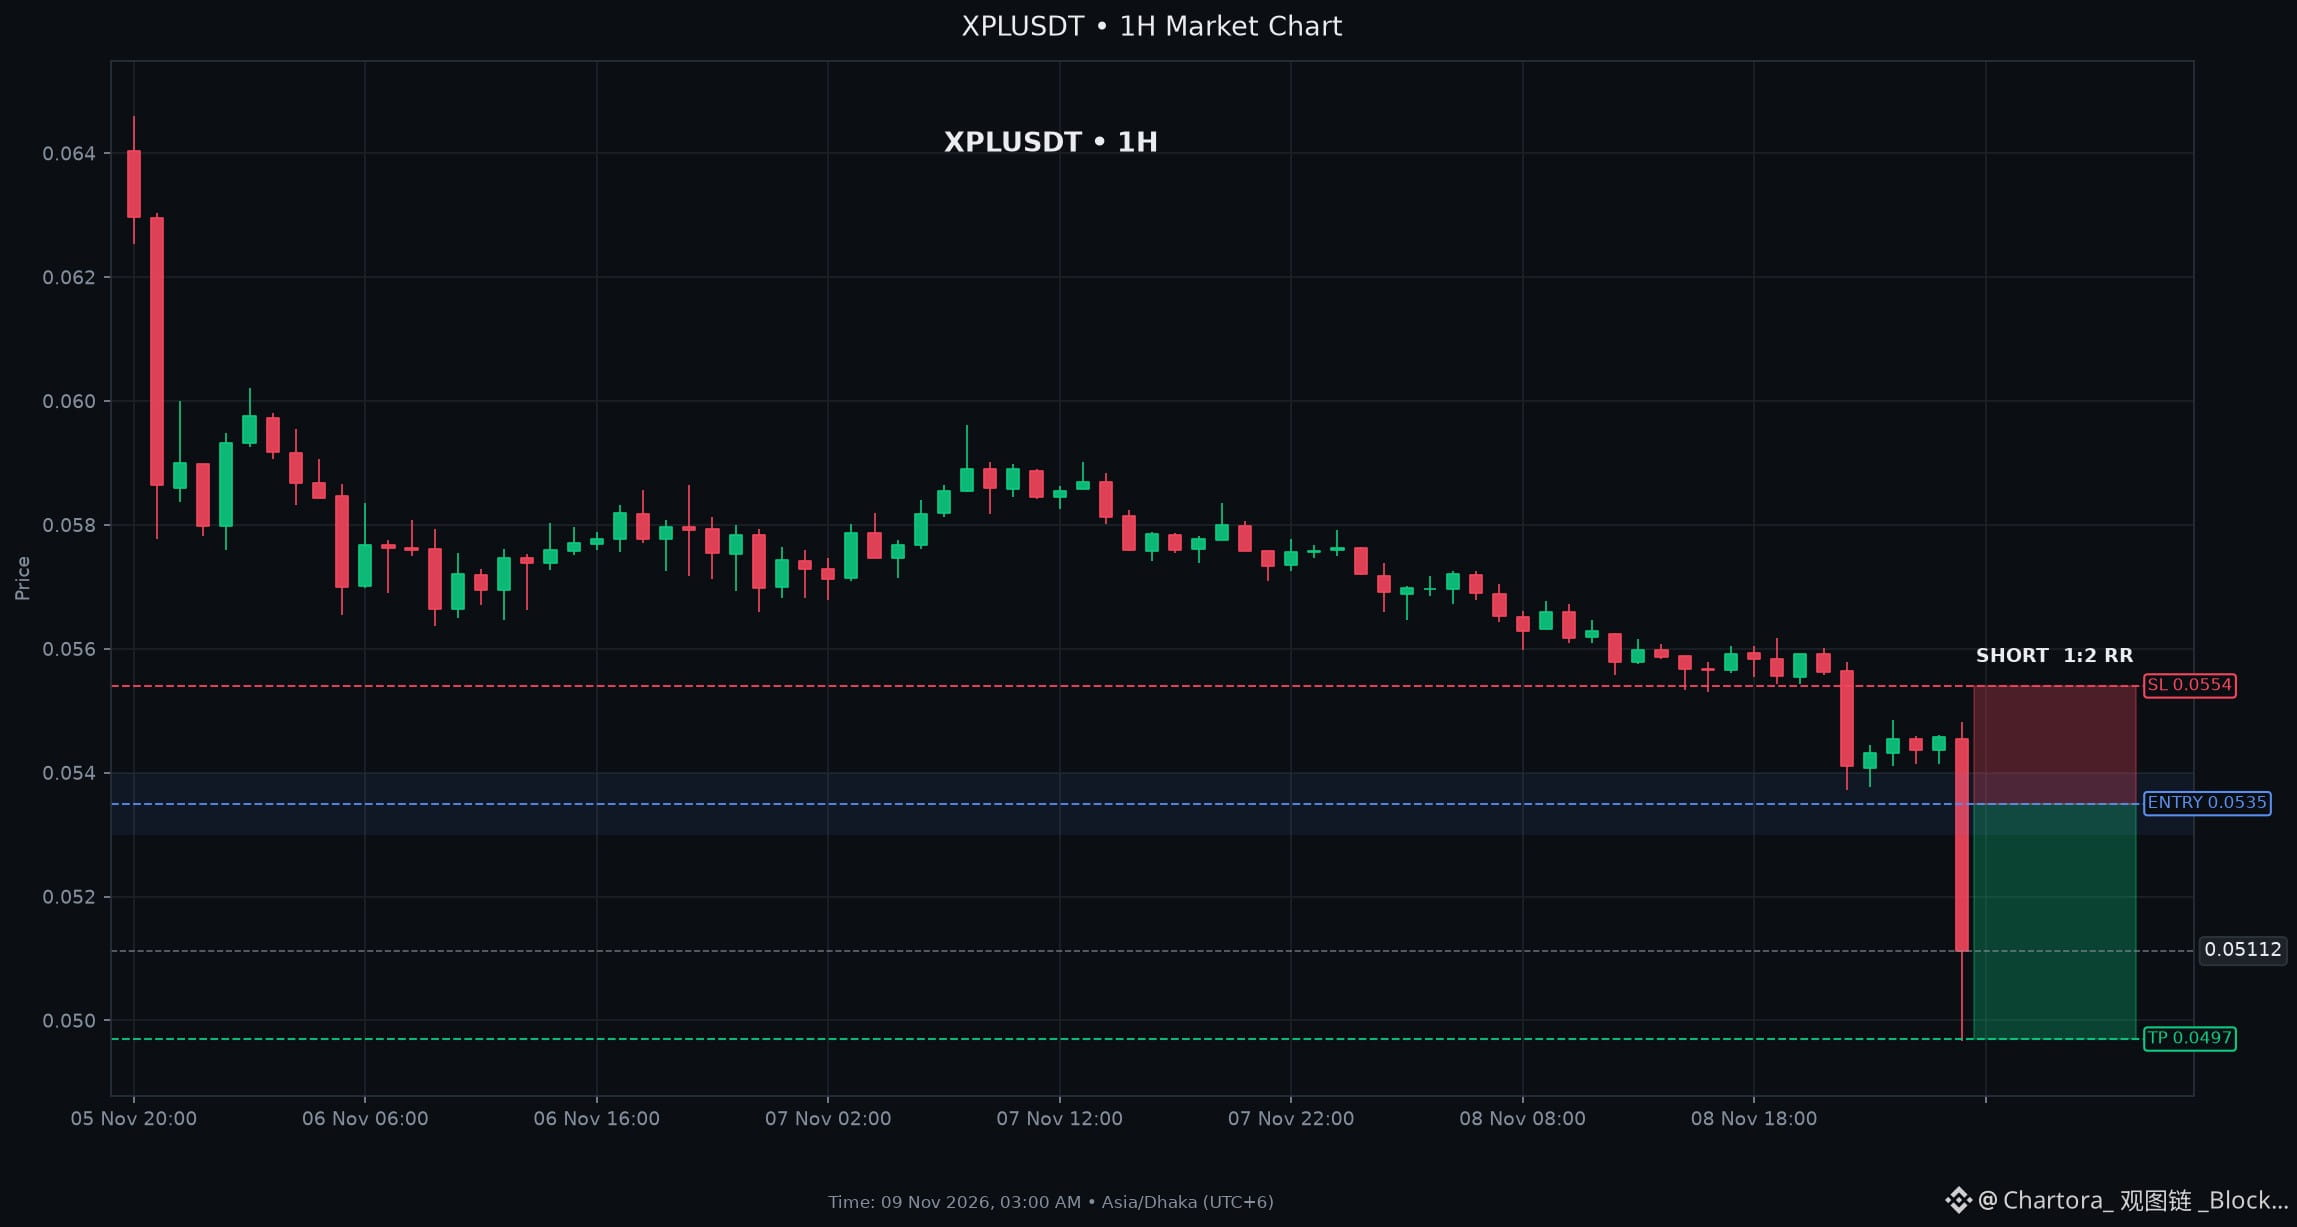
$XPL: Bearish Divergence Spotted on Downside Targets Ahead
SHORT SETUP XPL
Entry: $0.05300 - $0.05400
Stop Loss: $0.05540
Take Profit: $0.04970 (2R)
Key Levels: Support $0.04967 | Resistance $0.05617
Technical Analysis for $XPL: RSI at 18.4 and Stochastic K around 22 signal deep oversold conditions, while price sits below the lower Bollinger Band and all EMA levels, confirming bearish pressure. ADX above 40 shows a strong trend. The indicators collectively favor a short bias toward the nearby support. Together, these indicators favor SHORT continuation toward support.
Market Context: BTC is in a bearish stance on both 4hour and daily frames, and the broader market is broadly negative with over 90%
SHORT $XPL
$XPL : Bearish Divergence Spotted on Downside Targets Ahead
SHORT SETUP XPL
Entry: $0.05300 - $0.05400
Stop Loss: $0.05540
Take Profit: $0.04970 (2R)
Key Levels: Support $0.04967 | Resistance $0.05617
Technical Analysis for $XPL : RSI at 18.4 and Stochastic K around 22 signal deep oversold conditions, while price sits below the lower Bollinger Band and all EMA levels, confirming bearish pressure. ADX above 40 shows a strong trend. The indicators collectively favor a short bias toward the nearby support. Together, these indicators favor SHORT continuation toward support.
Market Context: BTC is in a bearish stance on both 4hour and daily frames, and the broader market is broadly negative with over 90%
SHORT $XPL
SHORT SETUP XPL
Entry: $0.05300 - $0.05400
Stop Loss: $0.05540
Take Profit: $0.04970 (2R)
Key Levels: Support $0.04967 | Resistance $0.05617
Technical Analysis for $XPL : RSI at 18.4 and Stochastic K around 22 signal deep oversold conditions, while price sits below the lower Bollinger Band and all EMA levels, confirming bearish pressure. ADX above 40 shows a strong trend. The indicators collectively favor a short bias toward the nearby support. Together, these indicators favor SHORT continuation toward support.
Market Context: BTC is in a bearish stance on both 4hour and daily frames, and the broader market is broadly negative with over 90%
SHORT $XPL
عرض الترجمة
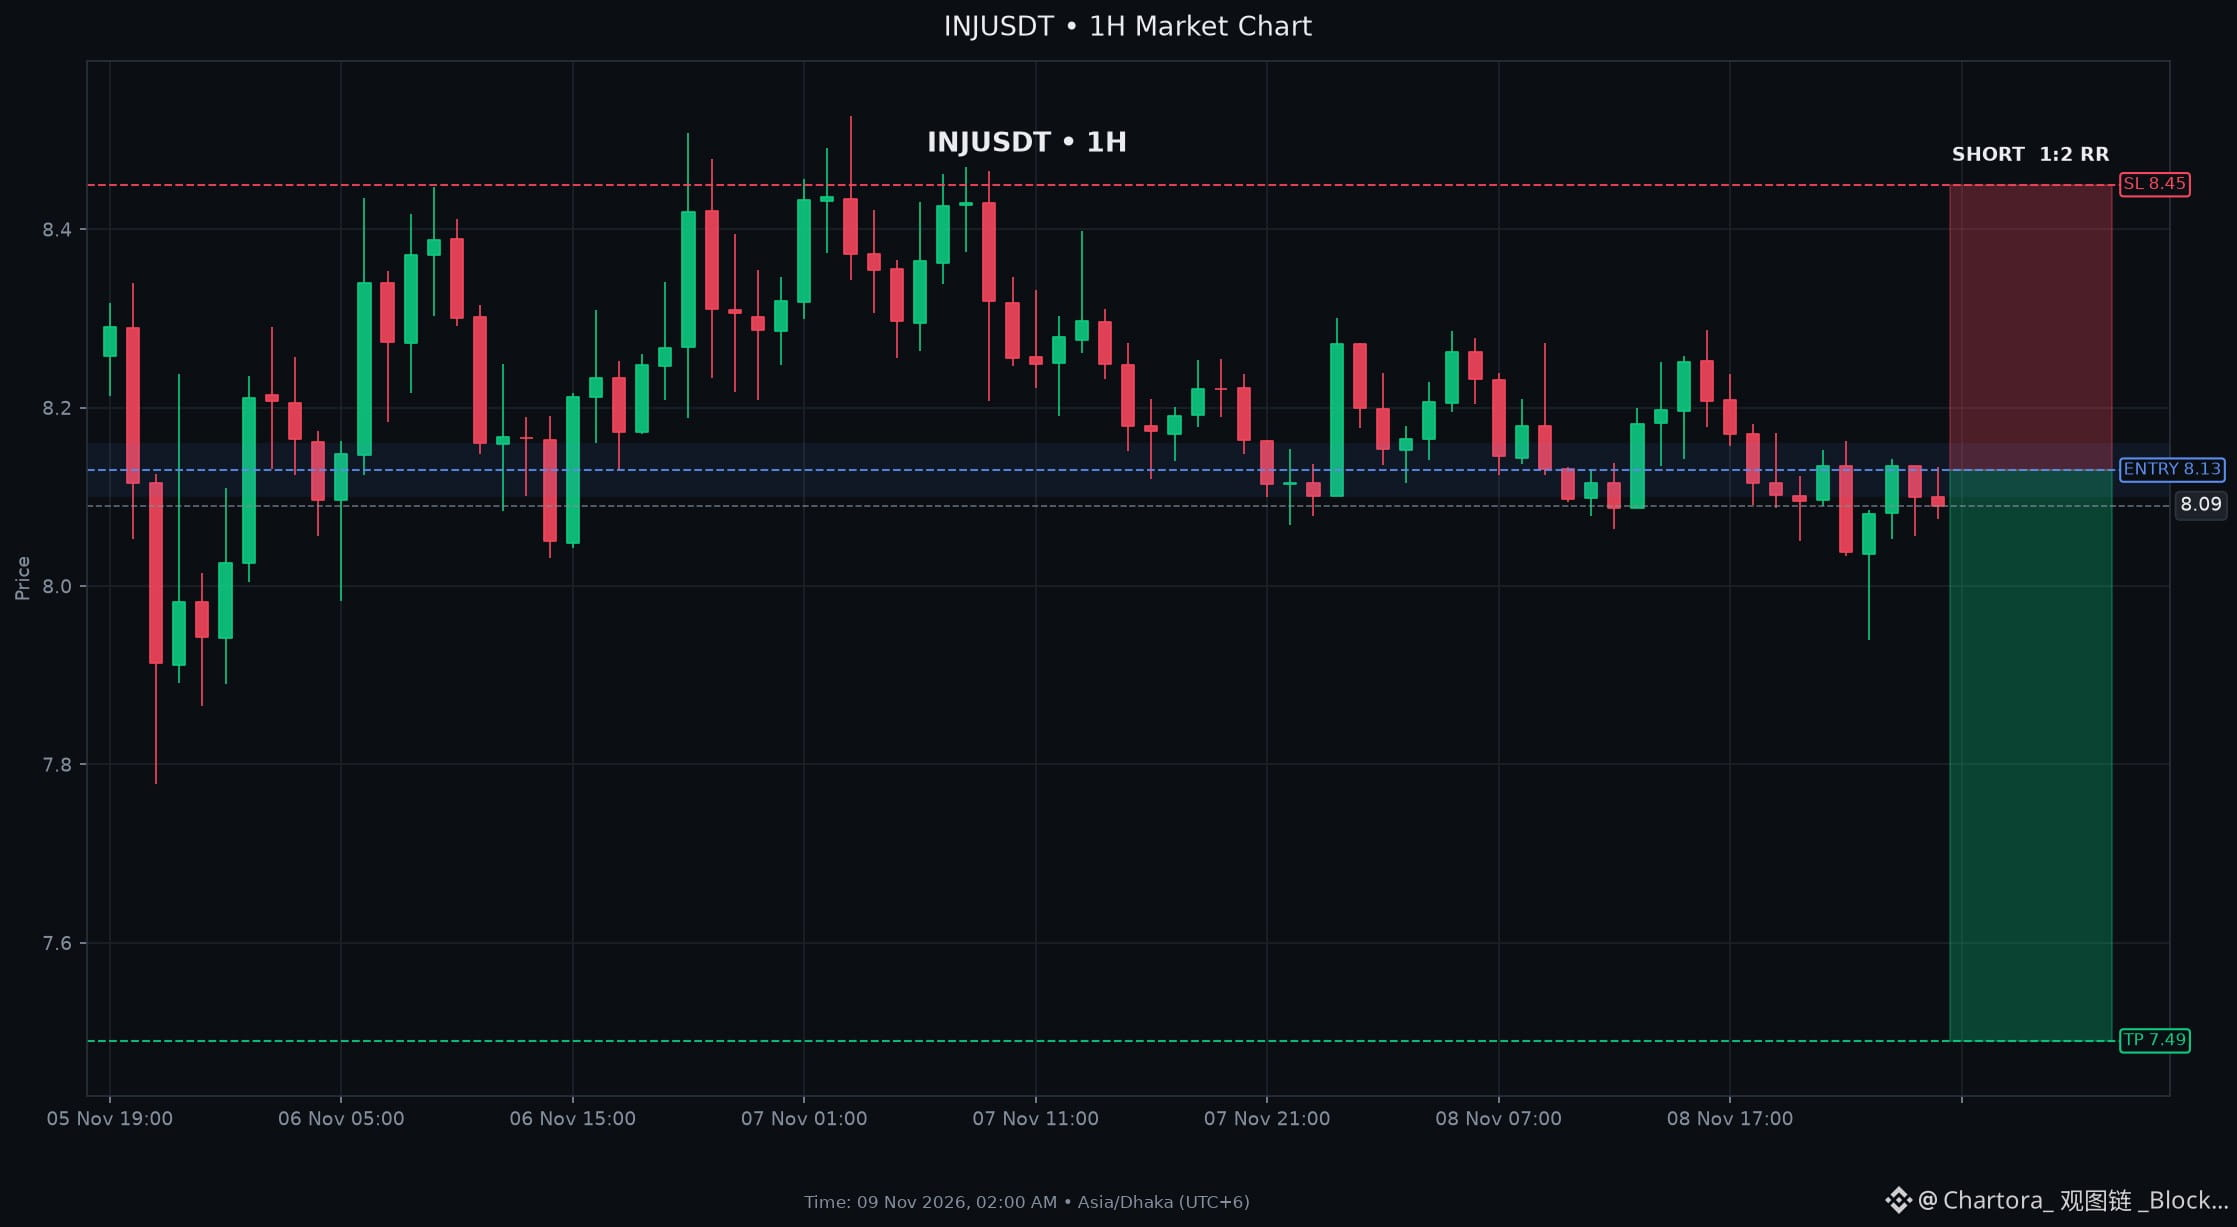
$INJ: Moving Average Death Cross Signals Downward Trend for $INJ
SHORT SETUP INJ
Entry: $8.1000 - $8.1600
Stop Loss: $8.4500
Take Profit: $7.4900 (2R)
Key Levels: Support $7.9400 | Resistance $8.1630
Technical Analysis for $INJ: MACD sits below its signal with a negative histogram, and price is under the 9, 21 and 50EMA, indicating bearish momentum. RSI at 44.9 and Stochastic around 43 further suggest downside pressure. With ADX low, the trend lacks strength, but the pair respects the 8.163 resistance as a swing high level.
Market Context: Bitcoin is in a bearish 4hour and daily trend, with price around $75,349 and EMAs sloping lower. Overall market breadth is broadly
SHORT $INJ
$INJ : Moving Average Death Cross Signals Downward Trend for $INJ
SHORT SETUP INJ
Entry: $8.1000 - $8.1600
Stop Loss: $8.4500
Take Profit: $7.4900 (2R)
Key Levels: Support $7.9400 | Resistance $8.1630
Technical Analysis for $INJ : MACD sits below its signal with a negative histogram, and price is under the 9, 21 and 50EMA, indicating bearish momentum. RSI at 44.9 and Stochastic around 43 further suggest downside pressure. With ADX low, the trend lacks strength, but the pair respects the 8.163 resistance as a swing high level.
Market Context: Bitcoin is in a bearish 4hour and daily trend, with price around $75,349 and EMAs sloping lower. Overall market breadth is broadly
SHORT $INJ
SHORT SETUP INJ
Entry: $8.1000 - $8.1600
Stop Loss: $8.4500
Take Profit: $7.4900 (2R)
Key Levels: Support $7.9400 | Resistance $8.1630
Technical Analysis for $INJ : MACD sits below its signal with a negative histogram, and price is under the 9, 21 and 50EMA, indicating bearish momentum. RSI at 44.9 and Stochastic around 43 further suggest downside pressure. With ADX low, the trend lacks strength, but the pair respects the 8.163 resistance as a swing high level.
Market Context: Bitcoin is in a bearish 4hour and daily trend, with price around $75,349 and EMAs sloping lower. Overall market breadth is broadly
SHORT $INJ
عرض الترجمة
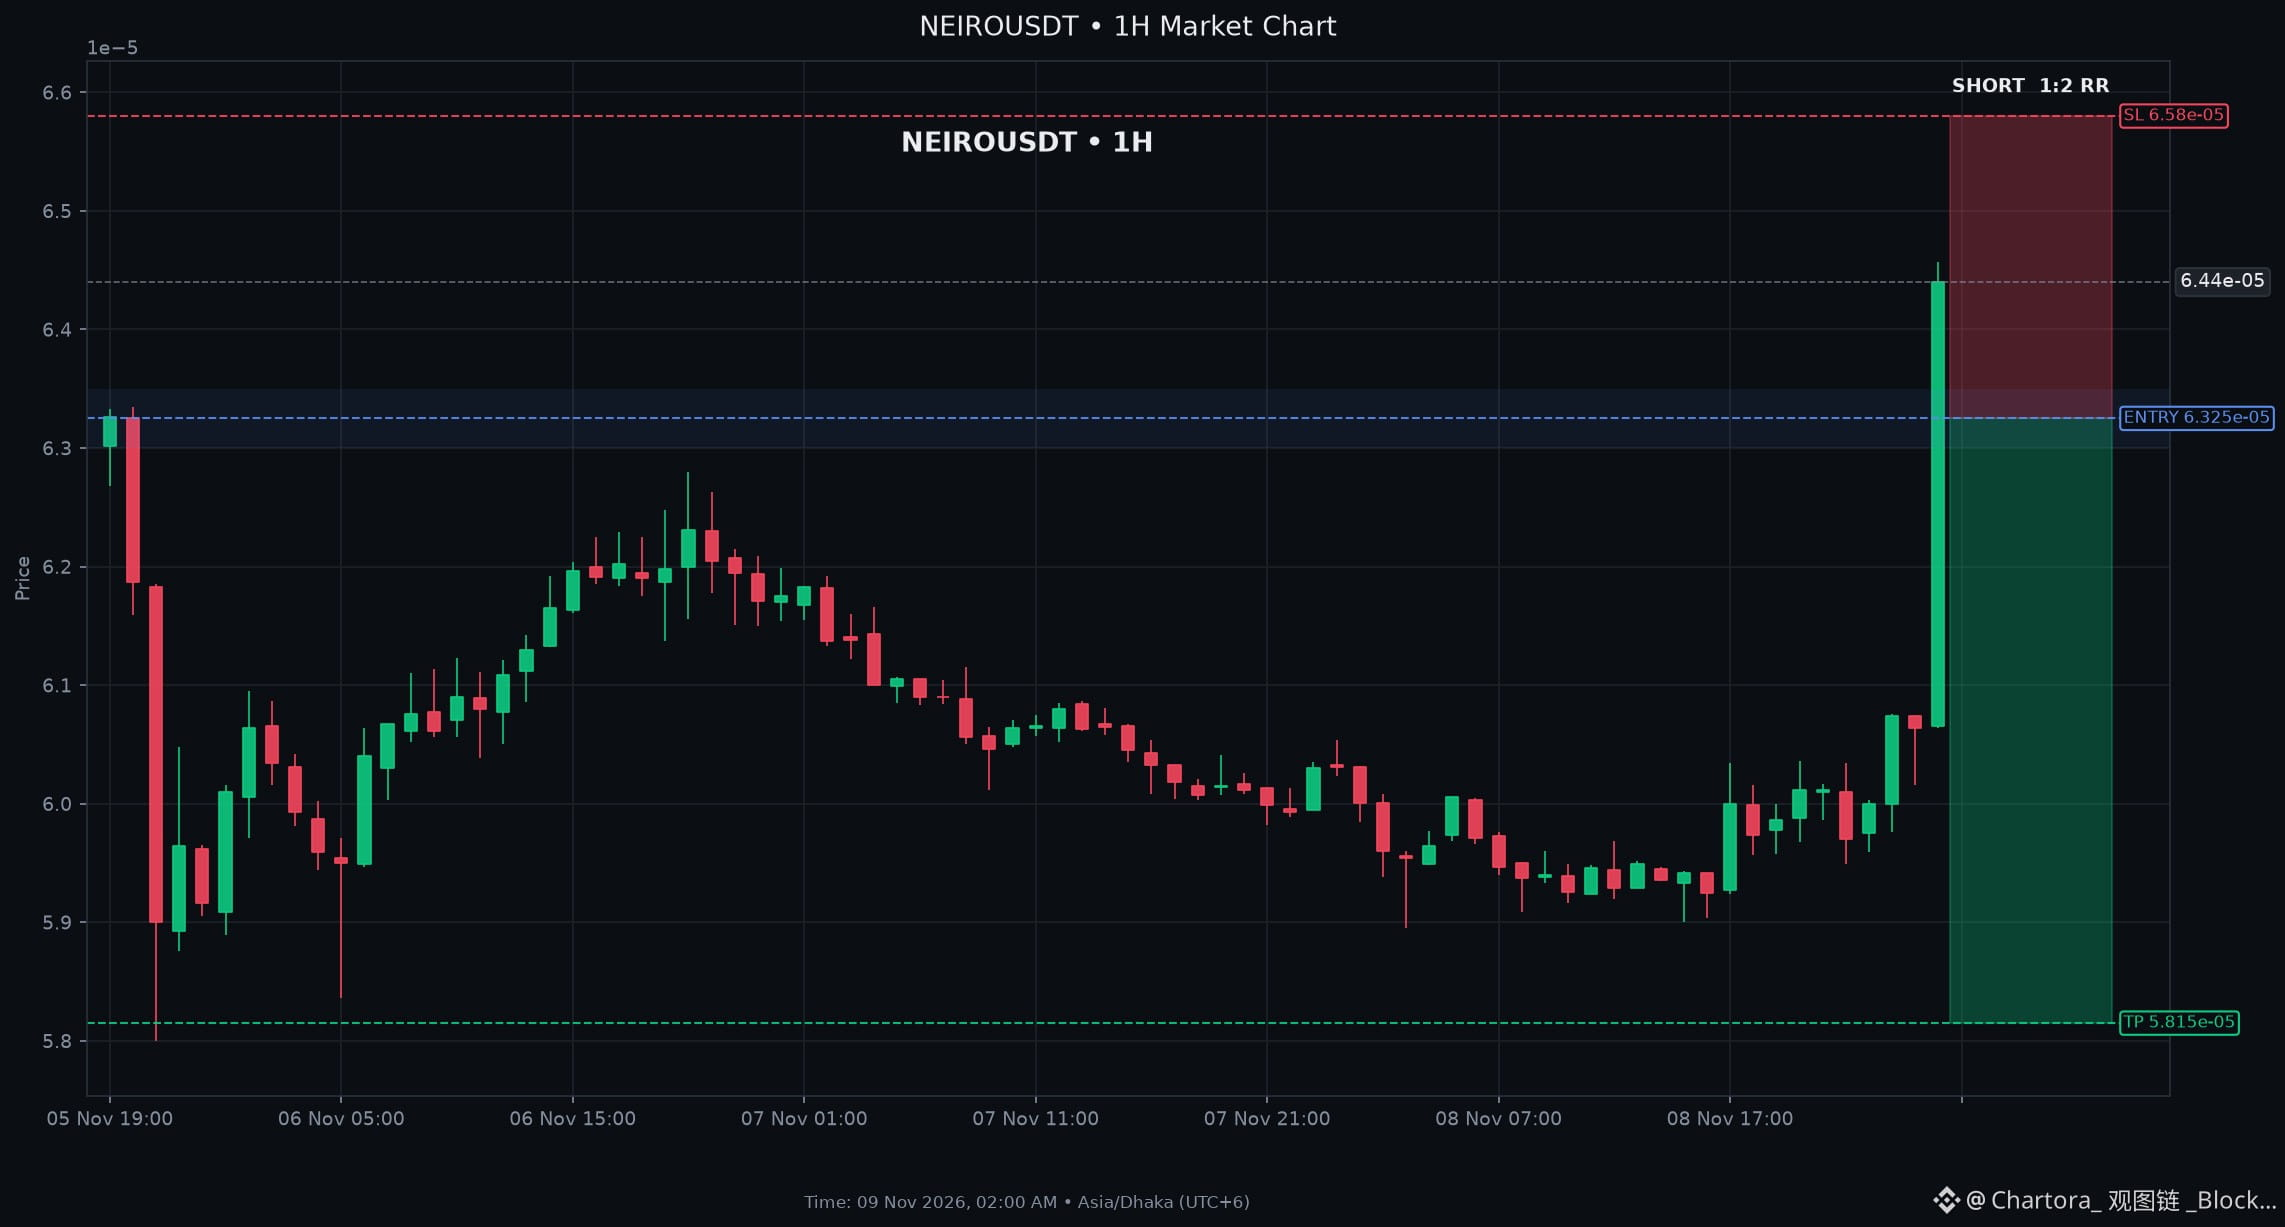
$NEIRO: Prepares for Breakdown: Downside Risk Escalates
SHORT SETUP NEIRO
Entry: $0.000063 - $0.0000635
Stop Loss: $0.0000658
Take Profit: $0.00005815 (2R)
Key Levels: Support $0.0000615 | Resistance $0.0000628
Technical Analysis for $NEIRO: A 30 % bidside orderbook imbalance adds shortterm downside pressure. Together, these indicators favor SHORT continuation toward support. Negative momentum and trend readings give this setup a clear bearish structure. The nearby resistance and support levels frame the current market structure. Together, these indicators favor SHORT continuation toward support. Negative momentum and trend readings give this setup a clear bearish
Market Context: BTC is in a shortterm bearish trend on both 4hour and daily charts, even though the 24hour change is modestly positive, reflecting
SHORT $NEIRO
$NEIRO : Prepares for Breakdown: Downside Risk Escalates
SHORT SETUP NEIRO
Entry: $0.000063 - $0.0000635
Stop Loss: $0.0000658
Take Profit: $0.00005815 (2R)
Key Levels: Support $0.0000615 | Resistance $0.0000628
Technical Analysis for $NEIRO : A 30 % bidside orderbook imbalance adds shortterm downside pressure. Together, these indicators favor SHORT continuation toward support. Negative momentum and trend readings give this setup a clear bearish structure. The nearby resistance and support levels frame the current market structure. Together, these indicators favor SHORT continuation toward support. Negative momentum and trend readings give this setup a clear bearish
Market Context: BTC is in a shortterm bearish trend on both 4hour and daily charts, even though the 24hour change is modestly positive, reflecting
SHORT $NEIRO
SHORT SETUP NEIRO
Entry: $0.000063 - $0.0000635
Stop Loss: $0.0000658
Take Profit: $0.00005815 (2R)
Key Levels: Support $0.0000615 | Resistance $0.0000628
Technical Analysis for $NEIRO : A 30 % bidside orderbook imbalance adds shortterm downside pressure. Together, these indicators favor SHORT continuation toward support. Negative momentum and trend readings give this setup a clear bearish structure. The nearby resistance and support levels frame the current market structure. Together, these indicators favor SHORT continuation toward support. Negative momentum and trend readings give this setup a clear bearish
Market Context: BTC is in a shortterm bearish trend on both 4hour and daily charts, even though the 24hour change is modestly positive, reflecting
SHORT $NEIRO
عرض الترجمة
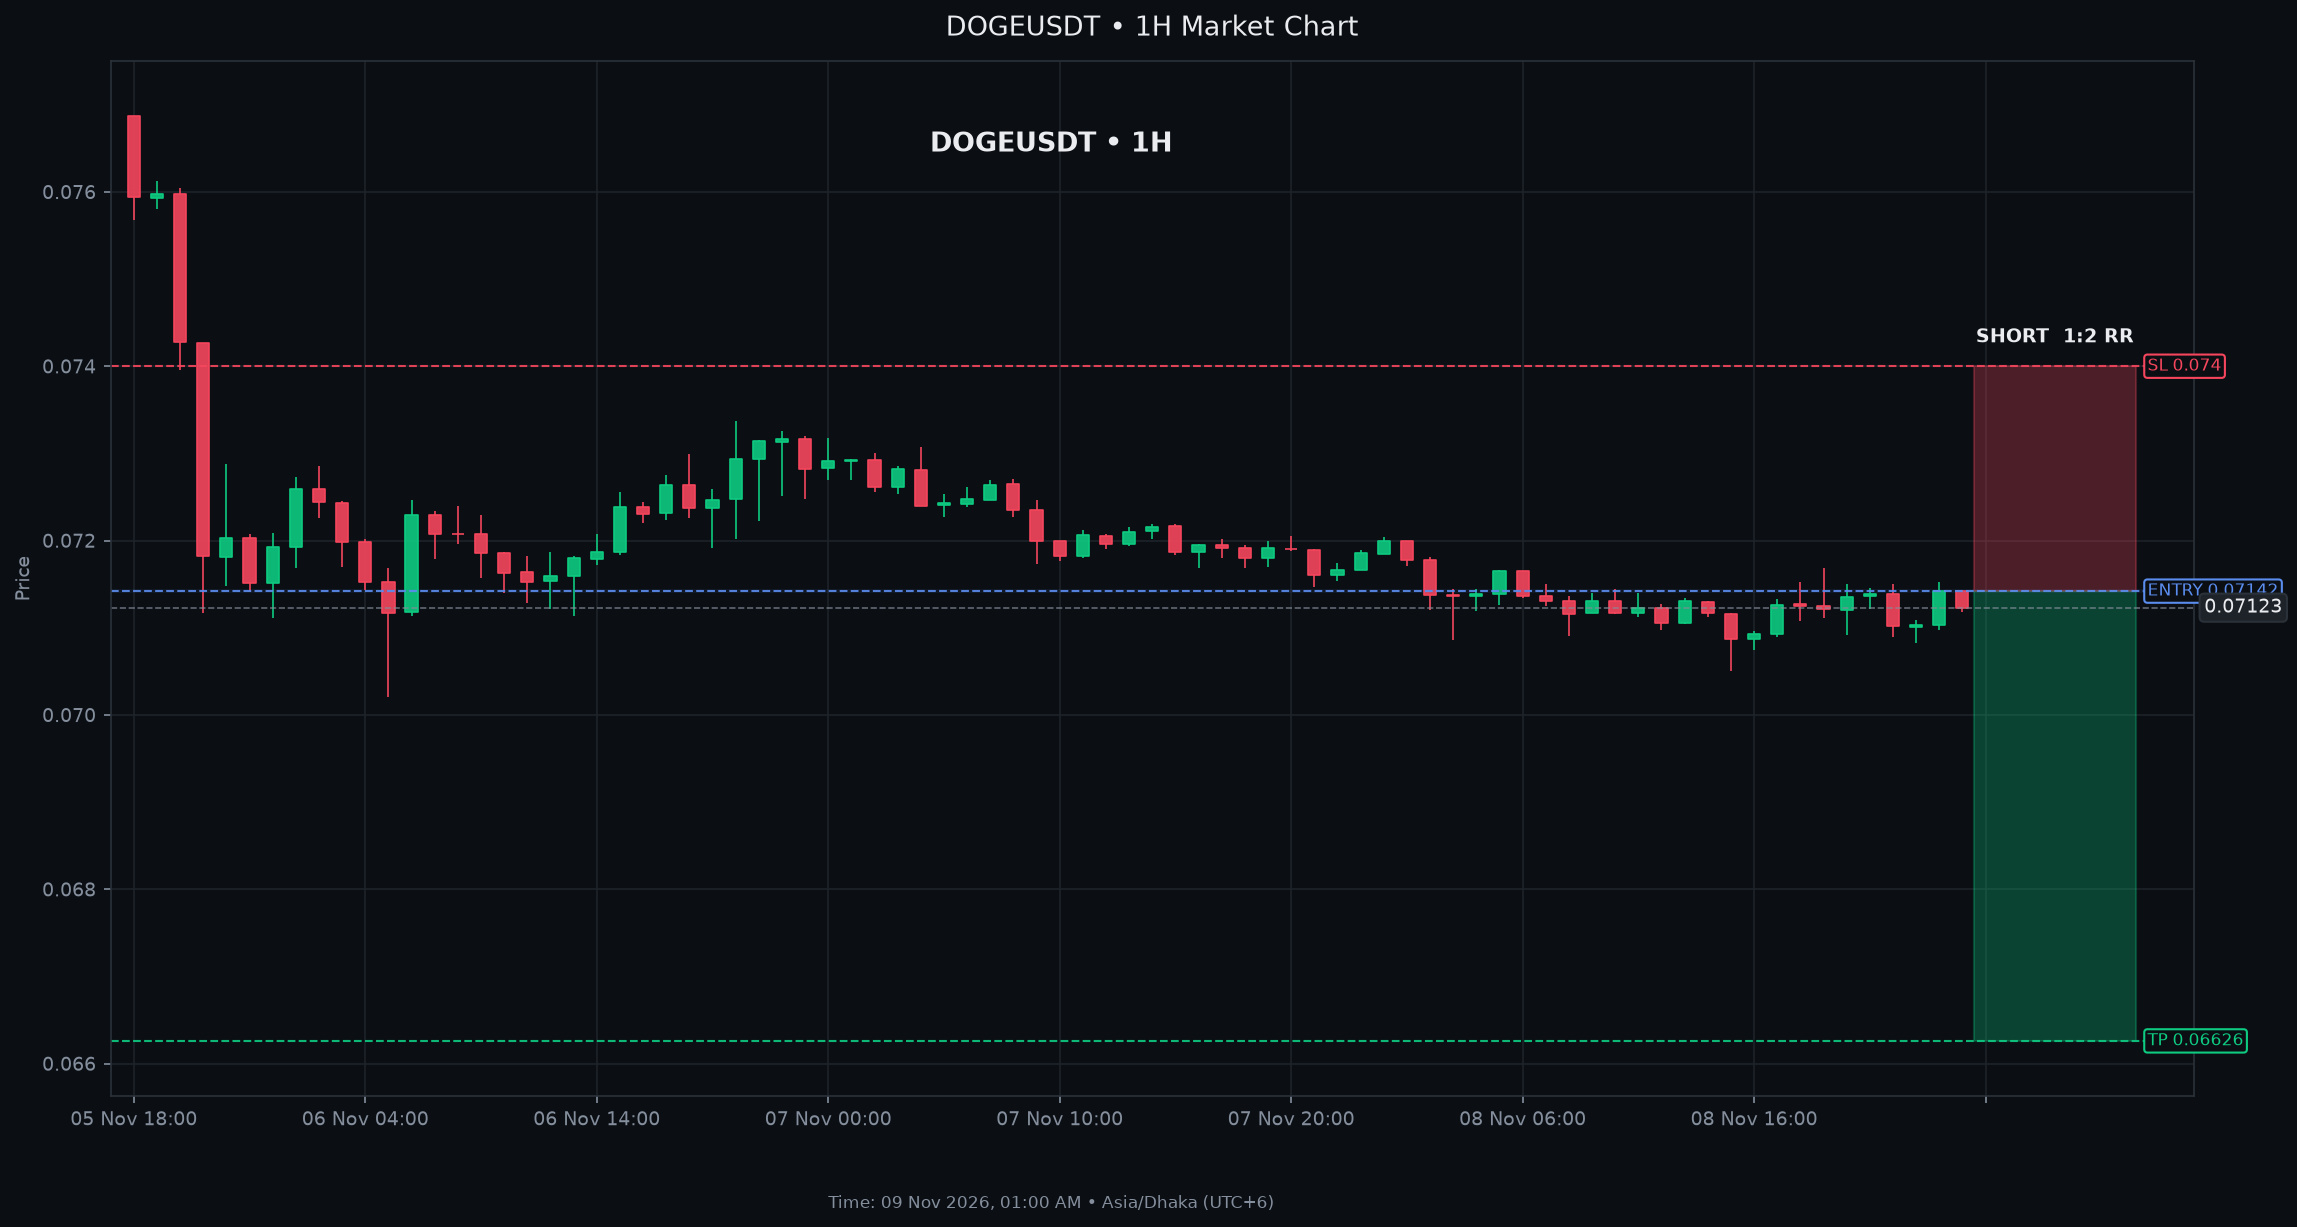
$DOGE: Fails Resistance Retest: Bearish Extension Imminent
SHORT SETUP DOGE
Entry: $0.07140 - $0.07144
Stop Loss: $0.07400
Take Profit: $0.06626 (2R)
Key Levels: Support $0.07097 | Resistance $0.07144
Technical Analysis for $DOGE: With ADX around 28 confirming a moderate trend, the structure leans toward a short bias near the 1H resistance. Together, these indicators favor SHORT continuation toward support. Negative momentum and trend readings give this setup a clear bearish structure. The nearby resistance and support levels frame the current market structure.
Market Context: BTC is in a bearish trend on both 4H and 1D charts, and overall market breadth is broadly negative, adding downside bias
SHORT $DOGE
$DOGE : Fails Resistance Retest: Bearish Extension Imminent
SHORT SETUP DOGE
Entry: $0.07140 - $0.07144
Stop Loss: $0.07400
Take Profit: $0.06626 (2R)
Key Levels: Support $0.07097 | Resistance $0.07144
Technical Analysis for $DOGE : With ADX around 28 confirming a moderate trend, the structure leans toward a short bias near the 1H resistance. Together, these indicators favor SHORT continuation toward support. Negative momentum and trend readings give this setup a clear bearish structure. The nearby resistance and support levels frame the current market structure.
Market Context: BTC is in a bearish trend on both 4H and 1D charts, and overall market breadth is broadly negative, adding downside bias
SHORT $DOGE
SHORT SETUP DOGE
Entry: $0.07140 - $0.07144
Stop Loss: $0.07400
Take Profit: $0.06626 (2R)
Key Levels: Support $0.07097 | Resistance $0.07144
Technical Analysis for $DOGE : With ADX around 28 confirming a moderate trend, the structure leans toward a short bias near the 1H resistance. Together, these indicators favor SHORT continuation toward support. Negative momentum and trend readings give this setup a clear bearish structure. The nearby resistance and support levels frame the current market structure.
Market Context: BTC is in a bearish trend on both 4H and 1D charts, and overall market breadth is broadly negative, adding downside bias
SHORT $DOGE
عرض الترجمة
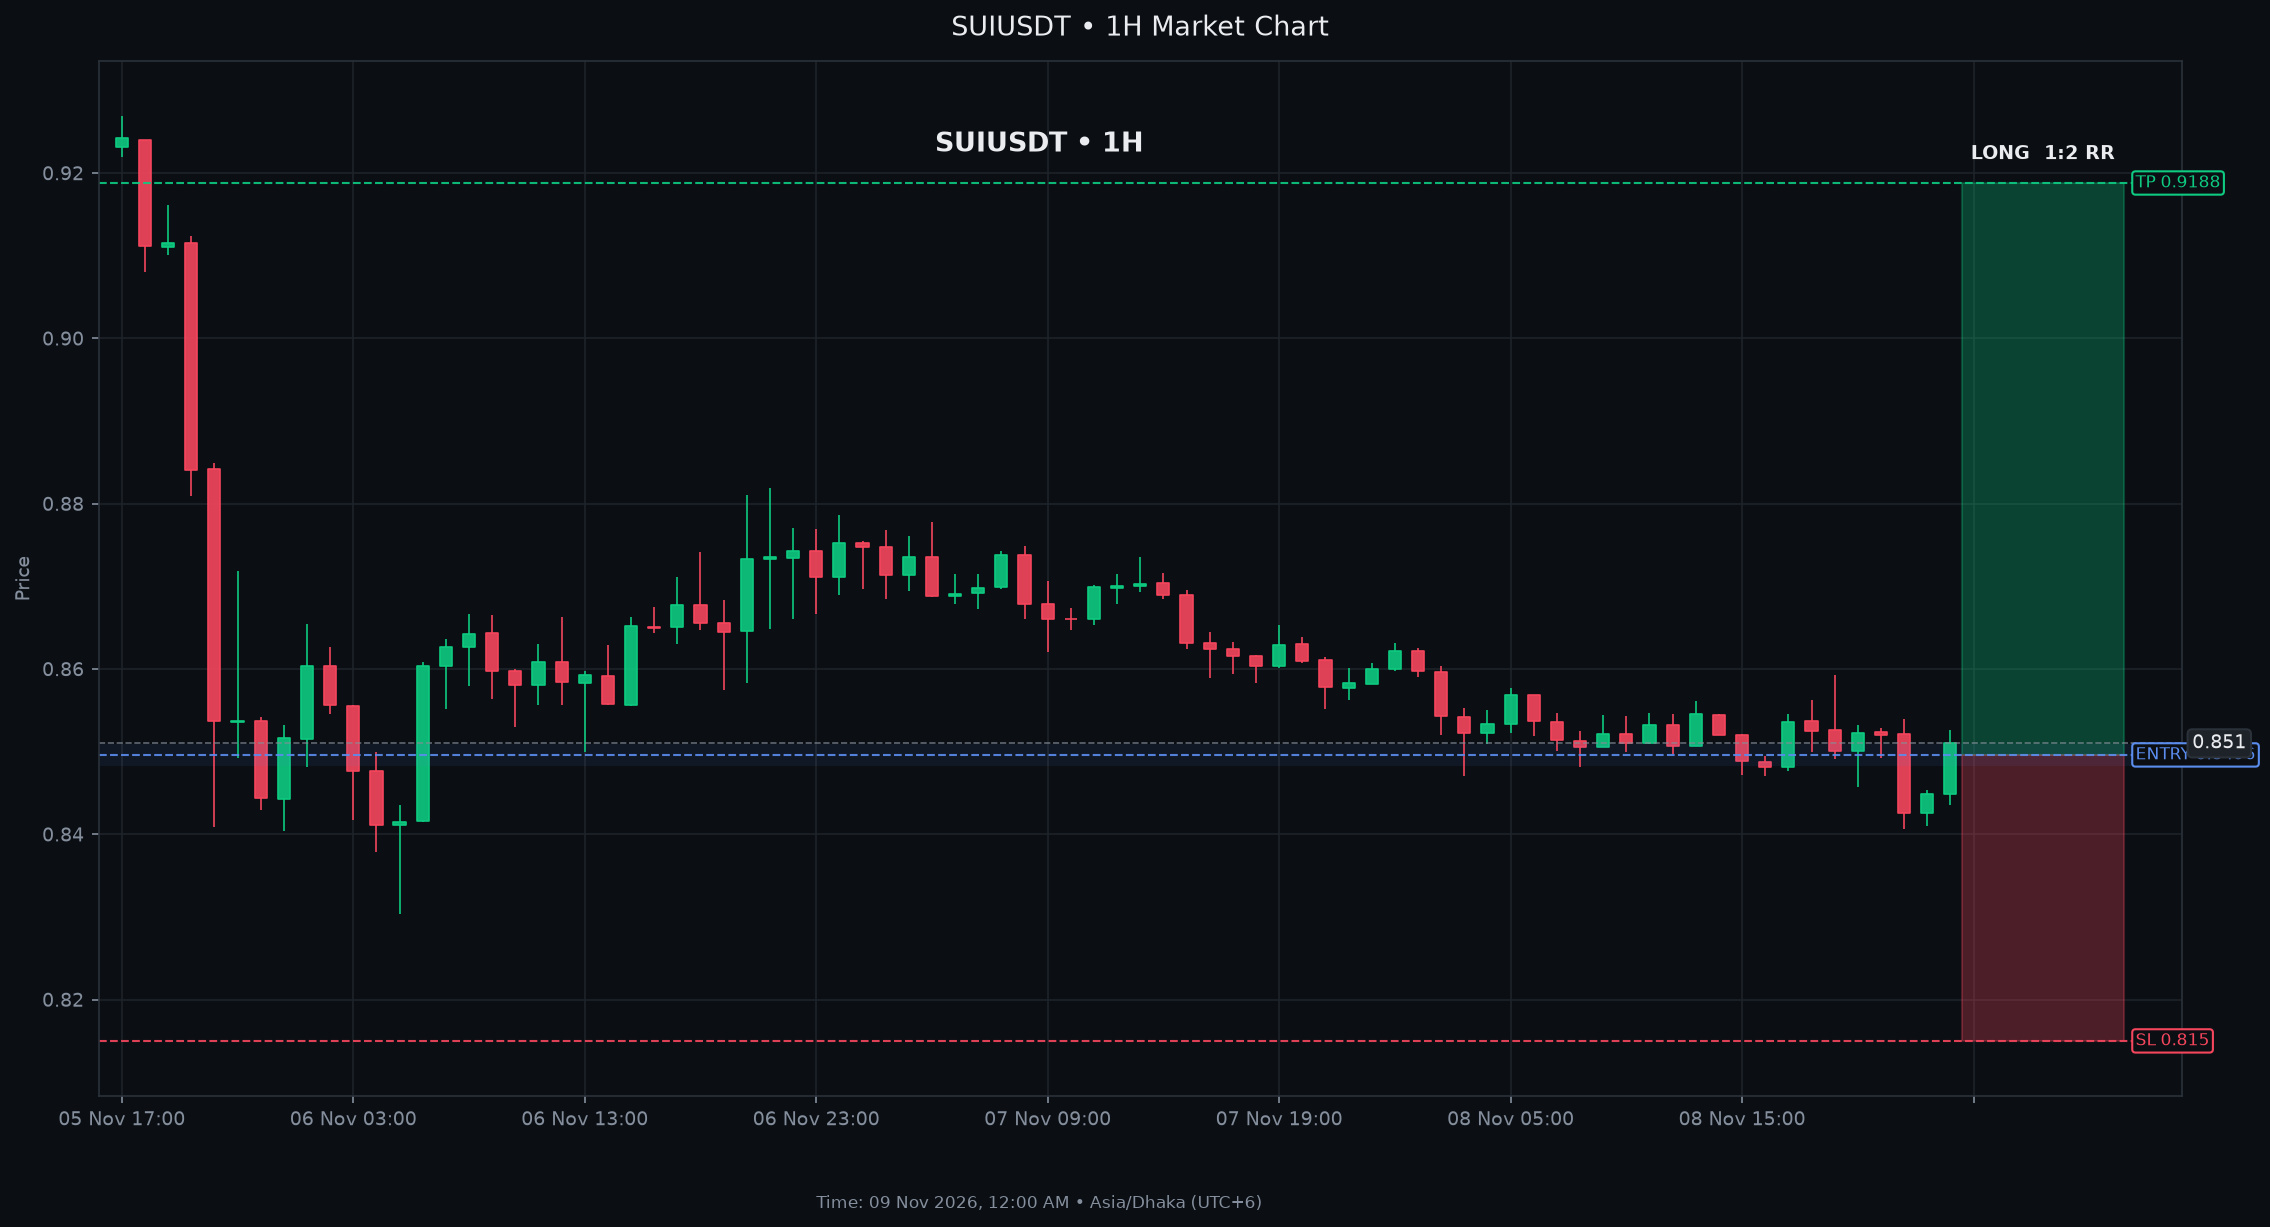
$SUI: Major Breakout Signals Emerge on $SUI Higher Timeframes
LONG SETUP SUI
Entry: $0.84830 - $0.85090
Stop Loss: $0.81500
Take Profit: $0.91880 (2R)
Key Levels: Support $0.84820 | Resistance $0.85400
Technical Analysis for $SUI: MACD line sits just above its signal, giving a modest bullish histogram. Stochastic K is above D, indicating upward momentum, while RSI hovers near neutral. Together, these indicators favor LONG continuation toward resistance. Positive momentum and trend readings give this setup a clear bullish structure. The nearby support and resistance levels frame the current market structure.
Market Context: BTC shows a bullish 24h move, yet overall market breadth is broadly negative, providing a cautious backdrop for SUIUSDT.
LONG $SUI
$SUI : Major Breakout Signals Emerge on $SUI Higher Timeframes
LONG SETUP SUI
Entry: $0.84830 - $0.85090
Stop Loss: $0.81500
Take Profit: $0.91880 (2R)
Key Levels: Support $0.84820 | Resistance $0.85400
Technical Analysis for $SUI : MACD line sits just above its signal, giving a modest bullish histogram. Stochastic K is above D, indicating upward momentum, while RSI hovers near neutral. Together, these indicators favor LONG continuation toward resistance. Positive momentum and trend readings give this setup a clear bullish structure. The nearby support and resistance levels frame the current market structure.
Market Context: BTC shows a bullish 24h move, yet overall market breadth is broadly negative, providing a cautious backdrop for SUIUSDT.
LONG $SUI
LONG SETUP SUI
Entry: $0.84830 - $0.85090
Stop Loss: $0.81500
Take Profit: $0.91880 (2R)
Key Levels: Support $0.84820 | Resistance $0.85400
Technical Analysis for $SUI : MACD line sits just above its signal, giving a modest bullish histogram. Stochastic K is above D, indicating upward momentum, while RSI hovers near neutral. Together, these indicators favor LONG continuation toward resistance. Positive momentum and trend readings give this setup a clear bullish structure. The nearby support and resistance levels frame the current market structure.
Market Context: BTC shows a bullish 24h move, yet overall market breadth is broadly negative, providing a cautious backdrop for SUIUSDT.
LONG $SUI
عرض الترجمة
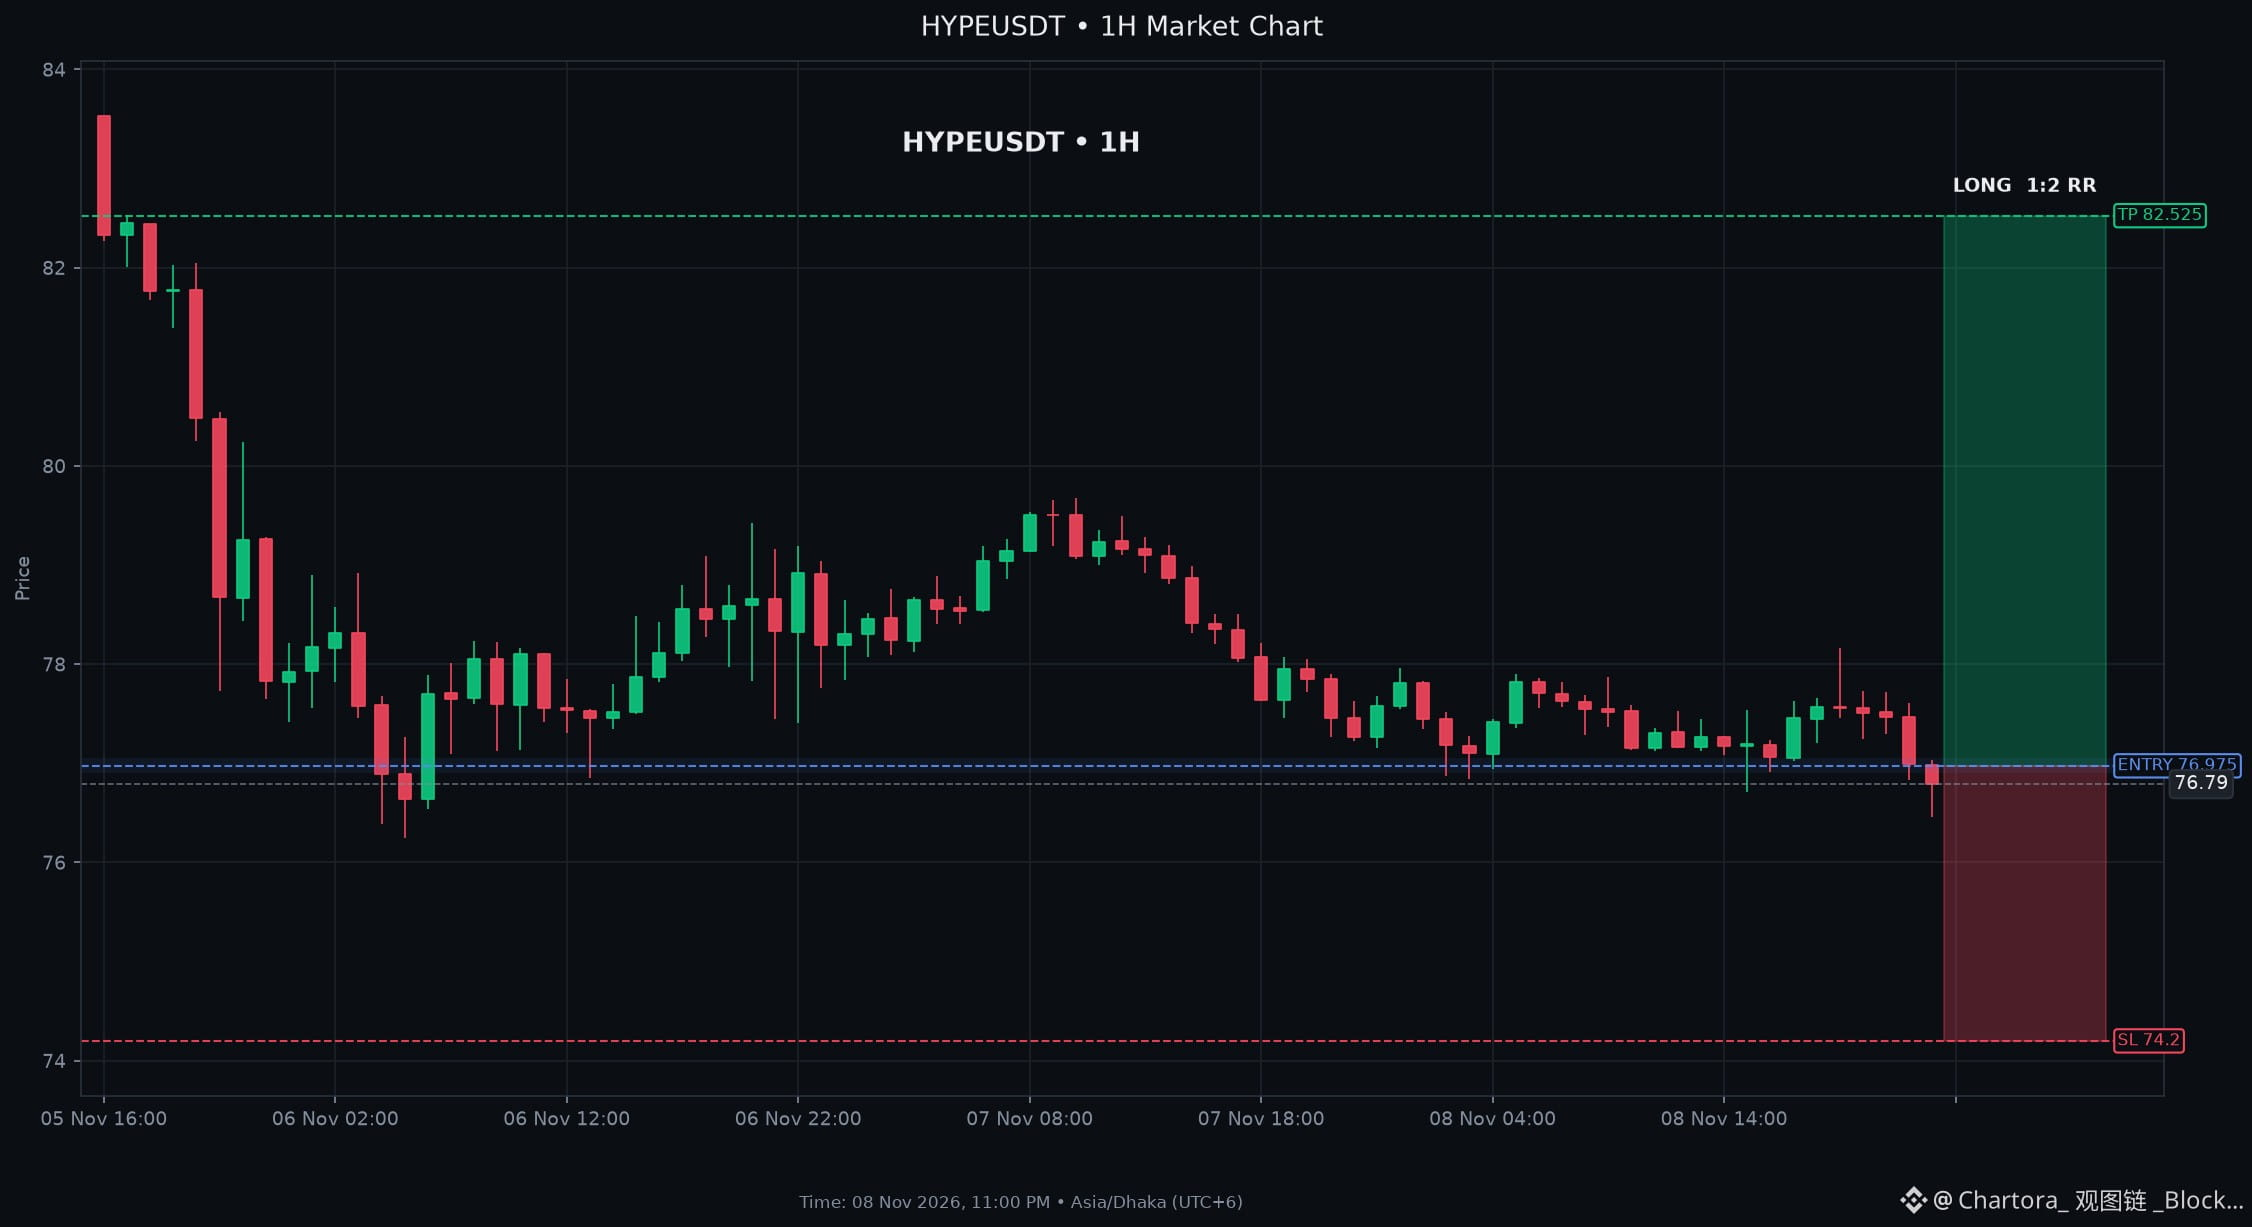
$HYPE: Spot Inflows Surge for $HYPE as Futures Open Interest Rises
LONG SETUP HYPE
Entry: $76.9000 - $77.0500
Stop Loss: $74.2000
Take Profit: $82.5250 (2R)
Key Levels: Support $77.1500 | Resistance $77.8700
Technical Analysis for $HYPE: MACD shows a bullish crossover (line above signal) while RSI at 35 and Stochastic K at 19 indicate oversold conditions. Price sits just below the lower Bollinger Band, and the orderbook shows a 29% bid imbalance, suggesting buying pressure. These factors point to upward momentum toward the 1hour resistance. Together, these indicators favor LONG continuation toward resistance.
Market Context: BTC is in a bearish 4hour trend, but the broader market is broadly negative with 74% red assets. Despite the cryptowide downside
LONG $HYPE
$HYPE : Spot Inflows Surge for $HYPE as Futures Open Interest Rises
LONG SETUP HYPE
Entry: $76.9000 - $77.0500
Stop Loss: $74.2000
Take Profit: $82.5250 (2R)
Key Levels: Support $77.1500 | Resistance $77.8700
Technical Analysis for $HYPE : MACD shows a bullish crossover (line above signal) while RSI at 35 and Stochastic K at 19 indicate oversold conditions. Price sits just below the lower Bollinger Band, and the orderbook shows a 29% bid imbalance, suggesting buying pressure. These factors point to upward momentum toward the 1hour resistance. Together, these indicators favor LONG continuation toward resistance.
Market Context: BTC is in a bearish 4hour trend, but the broader market is broadly negative with 74% red assets. Despite the cryptowide downside
LONG $HYPE
LONG SETUP HYPE
Entry: $76.9000 - $77.0500
Stop Loss: $74.2000
Take Profit: $82.5250 (2R)
Key Levels: Support $77.1500 | Resistance $77.8700
Technical Analysis for $HYPE : MACD shows a bullish crossover (line above signal) while RSI at 35 and Stochastic K at 19 indicate oversold conditions. Price sits just below the lower Bollinger Band, and the orderbook shows a 29% bid imbalance, suggesting buying pressure. These factors point to upward momentum toward the 1hour resistance. Together, these indicators favor LONG continuation toward resistance.
Market Context: BTC is in a bearish 4hour trend, but the broader market is broadly negative with 74% red assets. Despite the cryptowide downside
LONG $HYPE
عرض الترجمة
Zcash ($ZEC): Upgrade Could Lock $16 Million in Crypto Forever
Zcash has rolled out its latest network upgrade, which is designed to deliver faster transaction processing for users. The update also marks the beginning of the phase‑out of an older privacy system that currently holds thousands of ZEC coins. Because the legacy system will soon stop accepting withdrawals, those remaining coins could become inaccessible, potentially locking up about $16 million in value for their owners.
**$ZEC**
Zcash ($ZEC ): Upgrade Could Lock $16 Million in Crypto Forever
Zcash has rolled out its latest network upgrade, which is designed to deliver faster transaction processing for users. The update also marks the beginning of the phase‑out of an older privacy system that currently holds thousands of ZEC coins. Because the legacy system will soon stop accepting withdrawals, those remaining coins could become inaccessible, potentially locking up about $16 million in value for their owners.
**$ZEC **
Zcash has rolled out its latest network upgrade, which is designed to deliver faster transaction processing for users. The update also marks the beginning of the phase‑out of an older privacy system that currently holds thousands of ZEC coins. Because the legacy system will soon stop accepting withdrawals, those remaining coins could become inaccessible, potentially locking up about $16 million in value for their owners.
**$ZEC **

عرض الترجمة
Bitcoin ($BTC): ETF outflows hit $530M as price slips below $76,000
US spot Bitcoin and Ether exchange‑traded funds recorded a combined net outflow of $530 million on Thursday, as the price of Bitcoin slipped below the $76,000 level, marking its first breach of that threshold in recent weeks.
The outflows coincided with a broader tumble in US stocks, where equity markets fell on Thursday after earlier election‑related optimism evaporated, reinforcing the link between political sentiment and crypto fund flows.
The episode underscores how quickly capital can move out of crypto‑focused products when overall market sentiment turns, potentially reducing liquidity for spot Bitcoin ETFs, signaling heightened risk aversion among investors, and could affect pricing dynamics for the underlying Bitcoin holdings.
**$BTC**
Bitcoin ($BTC ): ETF outflows hit $530M as price slips below $76,000
US spot Bitcoin and Ether exchange‑traded funds recorded a combined net outflow of $530 million on Thursday, as the price of Bitcoin slipped below the $76,000 level, marking its first breach of that threshold in recent weeks.
The outflows coincided with a broader tumble in US stocks, where equity markets fell on Thursday after earlier election‑related optimism evaporated, reinforcing the link between political sentiment and crypto fund flows.
The episode underscores how quickly capital can move out of crypto‑focused products when overall market sentiment turns, potentially reducing liquidity for spot Bitcoin ETFs, signaling heightened risk aversion among investors, and could affect pricing dynamics for the underlying Bitcoin holdings.
**$BTC **
US spot Bitcoin and Ether exchange‑traded funds recorded a combined net outflow of $530 million on Thursday, as the price of Bitcoin slipped below the $76,000 level, marking its first breach of that threshold in recent weeks.
The outflows coincided with a broader tumble in US stocks, where equity markets fell on Thursday after earlier election‑related optimism evaporated, reinforcing the link between political sentiment and crypto fund flows.
The episode underscores how quickly capital can move out of crypto‑focused products when overall market sentiment turns, potentially reducing liquidity for spot Bitcoin ETFs, signaling heightened risk aversion among investors, and could affect pricing dynamics for the underlying Bitcoin holdings.
**$BTC **

عرض الترجمة
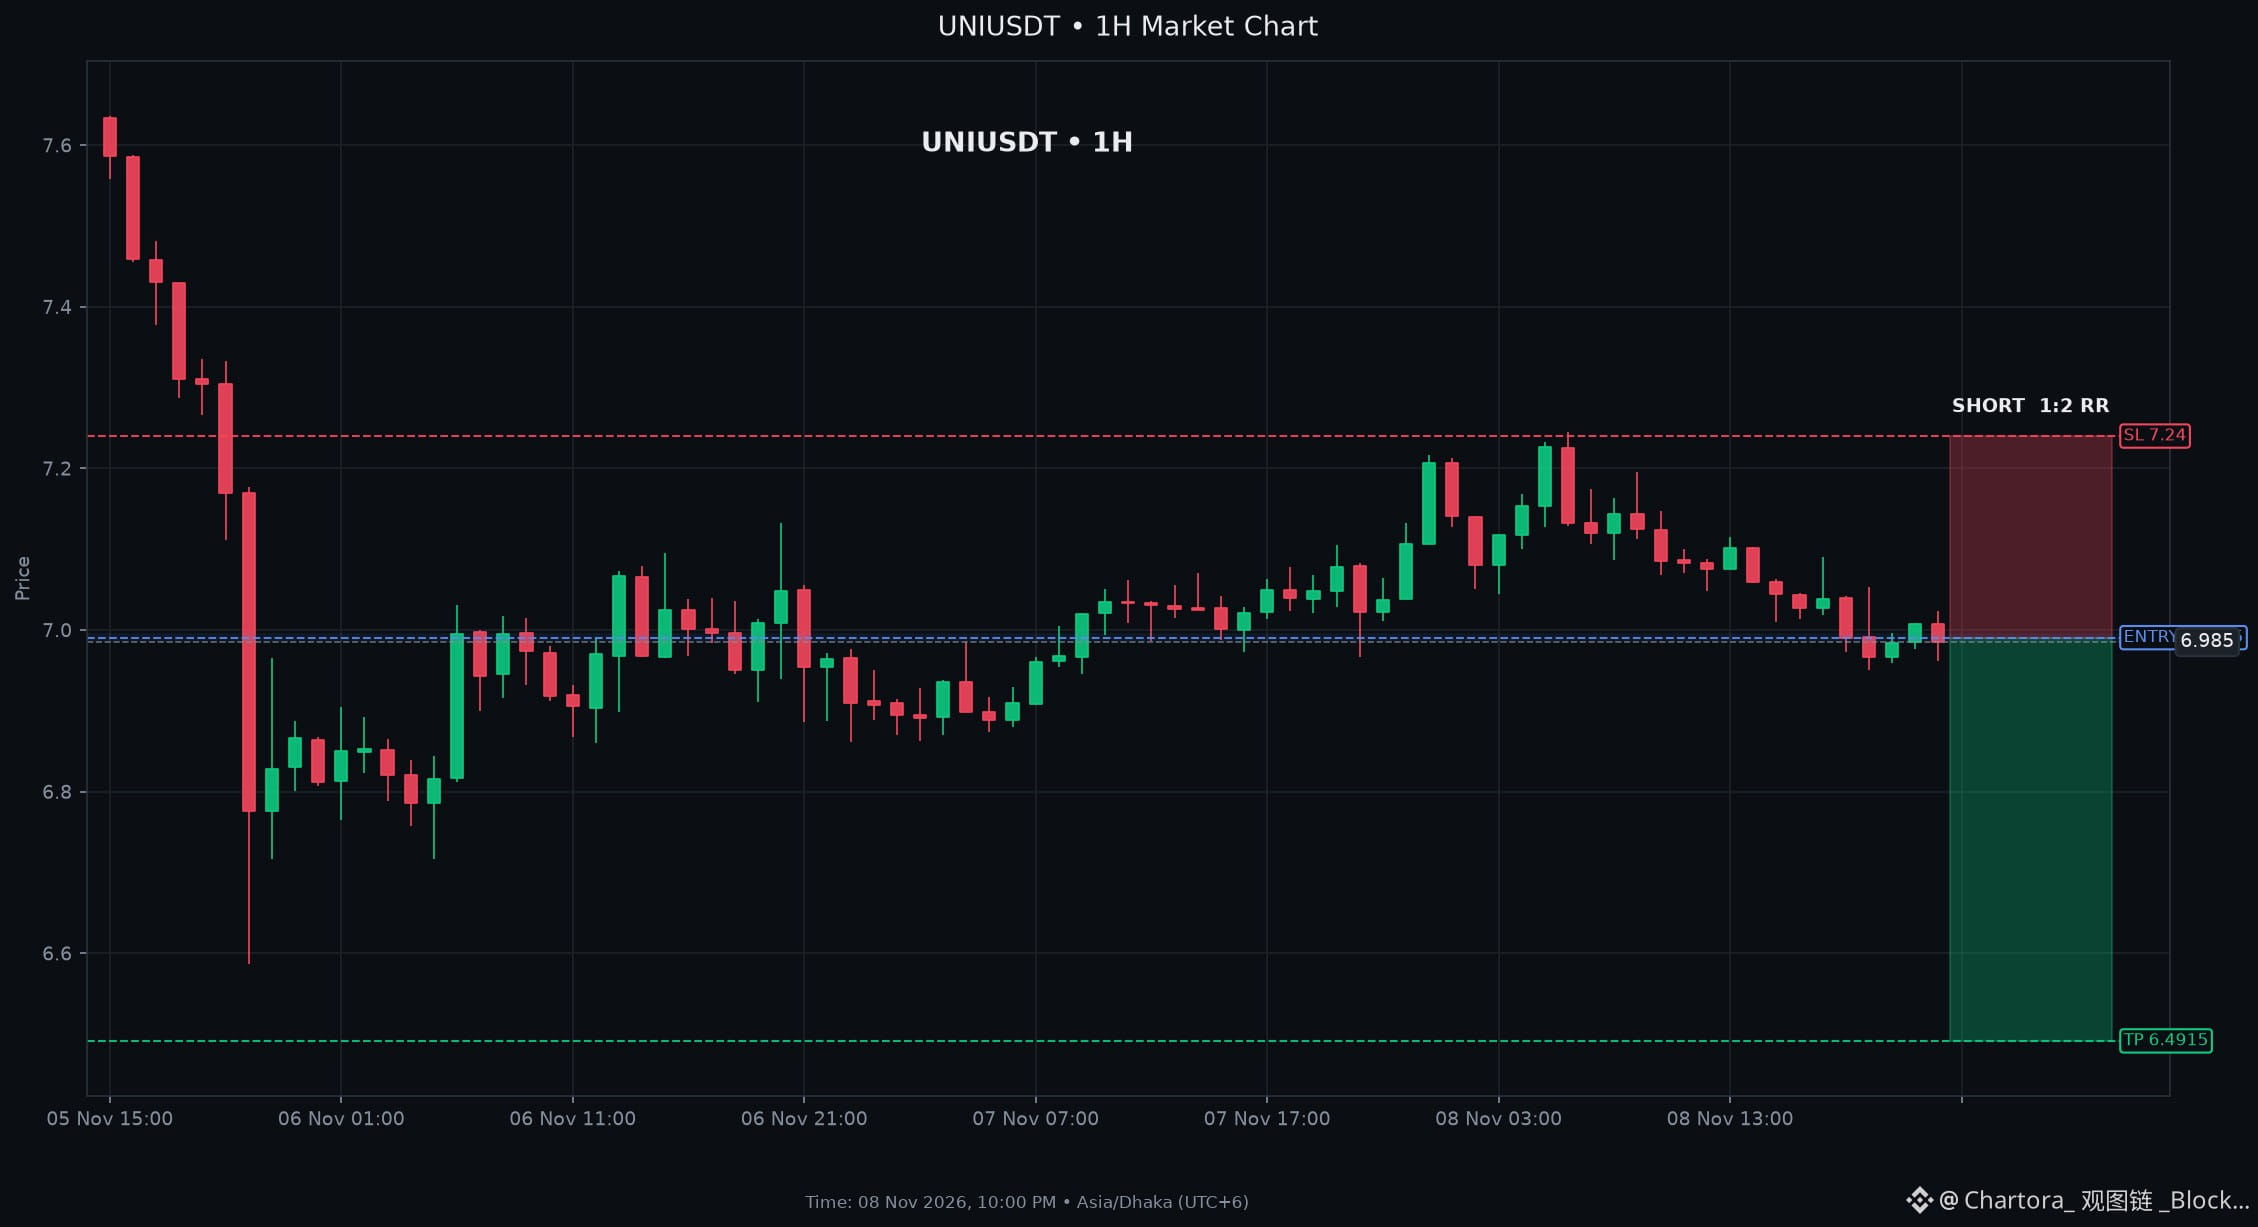
$UNI: High Conviction Short Opportunity as $UNI Tests Supply Wall
SHORT SETUP UNI
Entry: $6.9850 - $6.9960
Stop Loss: $7.2400
Take Profit: $6.4915 (2R)
Key Levels: Support $6.9510 | Resistance $6.9850
Technical Analysis for $UNI: MACD is negative and below its signal, and price sits under the 9, 21, 50 and 200 EMA series, indicating bearish momentum. ADX is low, confirming a weak trend. The 1hour resistance sits at 6.985, supporting a short bias. Together, these indicators favor SHORT continuation toward support. Negative momentum and trend readings give this setup a clear bearish structure.
Market Context: BTC is in a bearish 4hour and daily trend, down 0.15 % over 24 h, and the overall crypto market is broadly
SHORT $UNI
$UNI : High Conviction Short Opportunity as $UNI Tests Supply Wall
SHORT SETUP UNI
Entry: $6.9850 - $6.9960
Stop Loss: $7.2400
Take Profit: $6.4915 (2R)
Key Levels: Support $6.9510 | Resistance $6.9850
Technical Analysis for $UNI : MACD is negative and below its signal, and price sits under the 9, 21, 50 and 200 EMA series, indicating bearish momentum. ADX is low, confirming a weak trend. The 1hour resistance sits at 6.985, supporting a short bias. Together, these indicators favor SHORT continuation toward support. Negative momentum and trend readings give this setup a clear bearish structure.
Market Context: BTC is in a bearish 4hour and daily trend, down 0.15 % over 24 h, and the overall crypto market is broadly
SHORT $UNI
SHORT SETUP UNI
Entry: $6.9850 - $6.9960
Stop Loss: $7.2400
Take Profit: $6.4915 (2R)
Key Levels: Support $6.9510 | Resistance $6.9850
Technical Analysis for $UNI : MACD is negative and below its signal, and price sits under the 9, 21, 50 and 200 EMA series, indicating bearish momentum. ADX is low, confirming a weak trend. The 1hour resistance sits at 6.985, supporting a short bias. Together, these indicators favor SHORT continuation toward support. Negative momentum and trend readings give this setup a clear bearish structure.
Market Context: BTC is in a bearish 4hour and daily trend, down 0.15 % over 24 h, and the overall crypto market is broadly
SHORT $UNI
عرض الترجمة
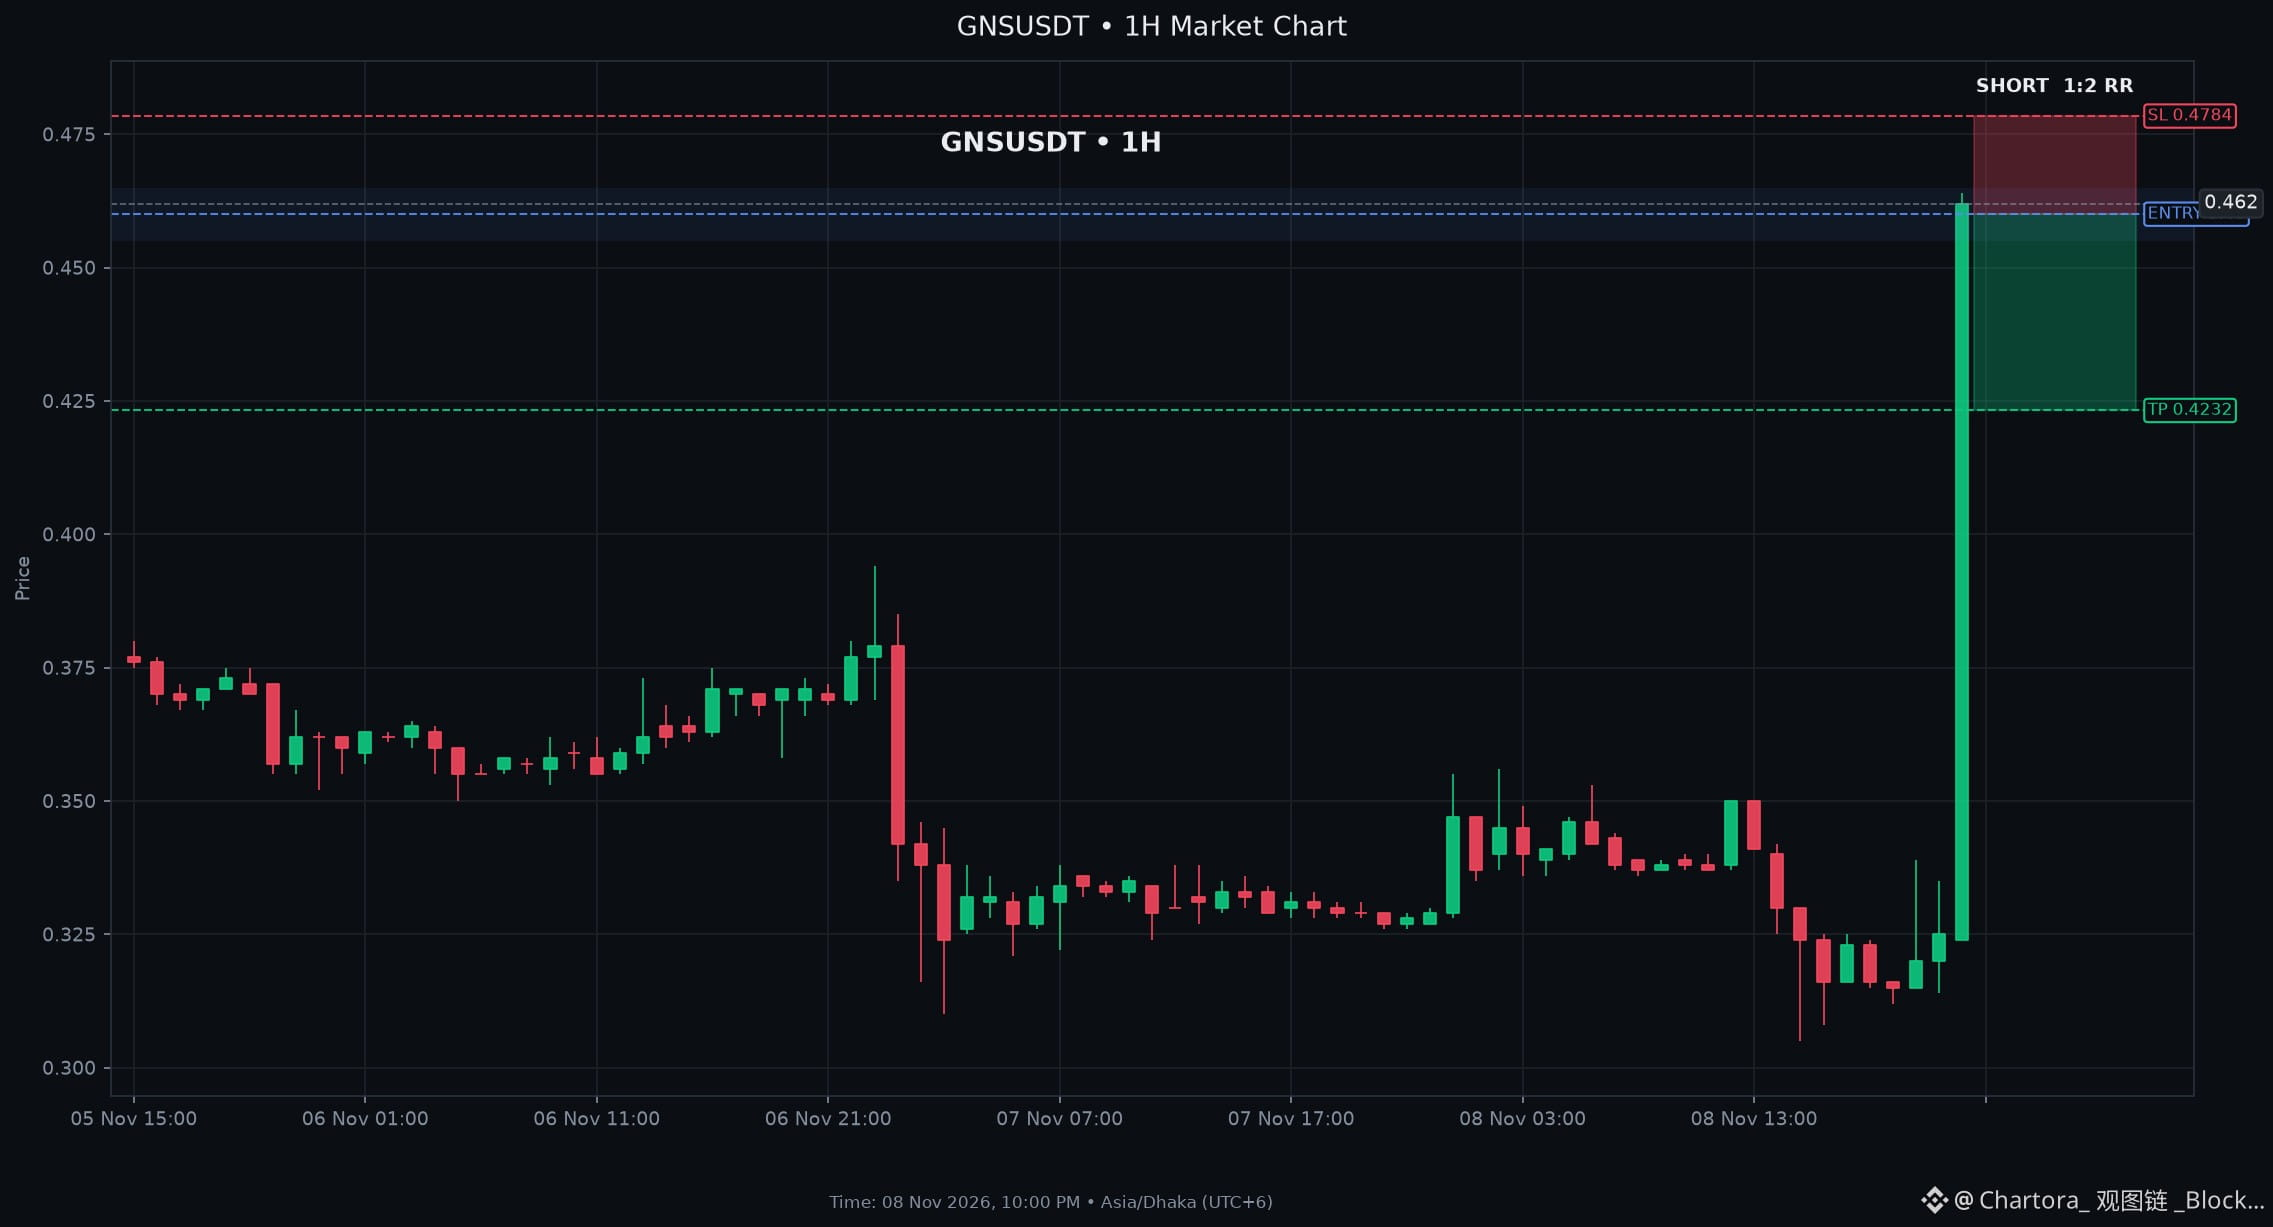
$GNS: Bears Retake Control as $GNS Fails to Hold Moving Averages
SHORT SETUP GNS
Entry: $0.45500 - $0.46500
Stop Loss: $0.47840
Take Profit: $0.42320 (2R)
Key Levels: Support $0.35800 | Resistance $0.52300
Technical Analysis for $GNS: RSI at 82 and Stochastic K near 99 signal extreme overbought conditions, while price sits above the Bollinger upper band. ADX above 30 confirms a strong trend, and the orderbook shows a -46% imbalance toward sells. These factors point to downside pressure toward the 0.358 support and could trigger a move down the next few candles.
Market Context: BTC remains in a bearish 4hour and daily trend, with price down 6.2% and market breadth broadly negative, reinforcing the overall downside
SHORT $GNS
$GNS : Bears Retake Control as $GNS Fails to Hold Moving Averages
SHORT SETUP GNS
Entry: $0.45500 - $0.46500
Stop Loss: $0.47840
Take Profit: $0.42320 (2R)
Key Levels: Support $0.35800 | Resistance $0.52300
Technical Analysis for $GNS : RSI at 82 and Stochastic K near 99 signal extreme overbought conditions, while price sits above the Bollinger upper band. ADX above 30 confirms a strong trend, and the orderbook shows a -46% imbalance toward sells. These factors point to downside pressure toward the 0.358 support and could trigger a move down the next few candles.
Market Context: BTC remains in a bearish 4hour and daily trend, with price down 6.2% and market breadth broadly negative, reinforcing the overall downside
SHORT $GNS
SHORT SETUP GNS
Entry: $0.45500 - $0.46500
Stop Loss: $0.47840
Take Profit: $0.42320 (2R)
Key Levels: Support $0.35800 | Resistance $0.52300
Technical Analysis for $GNS : RSI at 82 and Stochastic K near 99 signal extreme overbought conditions, while price sits above the Bollinger upper band. ADX above 30 confirms a strong trend, and the orderbook shows a -46% imbalance toward sells. These factors point to downside pressure toward the 0.358 support and could trigger a move down the next few candles.
Market Context: BTC remains in a bearish 4hour and daily trend, with price down 6.2% and market breadth broadly negative, reinforcing the overall downside
SHORT $GNS
عرض الترجمة
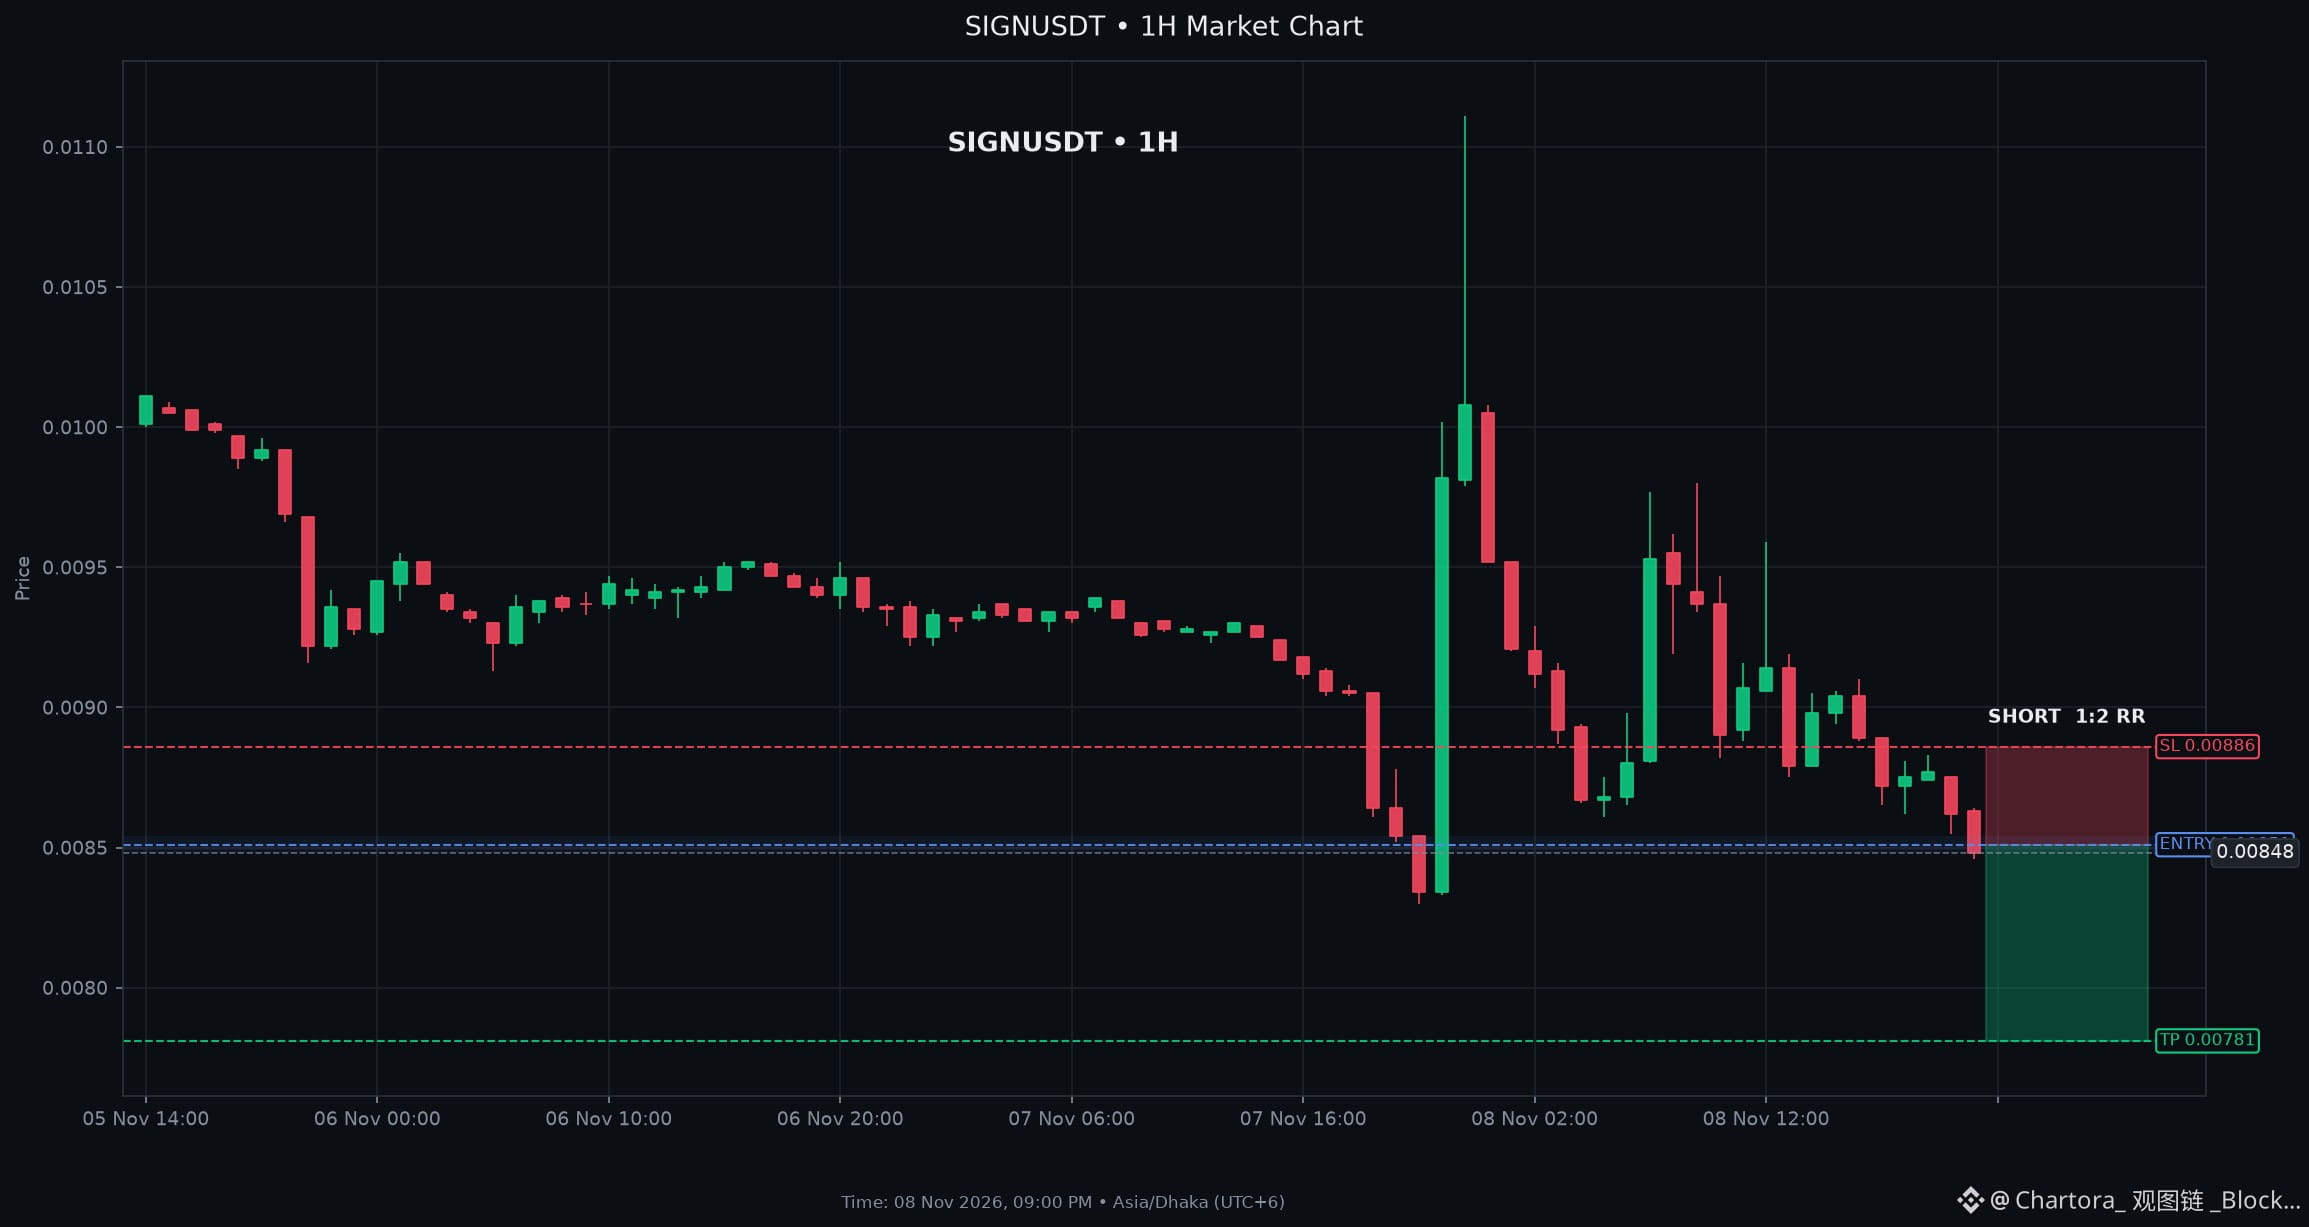
$SIGN: Volume Decreases on Rally: Weak Buyers Exposed
SHORT SETUP SIGN
Entry: $0.00848 - $0.00854
Stop Loss: $0.00886
Take Profit: $0.00781 (2R)
Key Levels: Support $0.0083 | Resistance $0.0091
Technical Analysis for $SIGN: Price sits below the 9, 21, 50 and 200EMA, confirming a downtrend. MACD remains negative with a bearish histogram, while RSI at 39 signals weakness. ADX around 18 shows a weak trend, and stochastic is deep in oversold territory. The pair respects the 0.0083 support and faces resistance near 0.0091, favoring short pressure.
Market Context: BTC shows bearish alignment on 4hour and daily charts, though the 24hour change is slightly positive, indicating broader market pressure remains negative.
SHORT $SIGN
$SIGN : Volume Decreases on Rally: Weak Buyers Exposed
SHORT SETUP SIGN
Entry: $0.00848 - $0.00854
Stop Loss: $0.00886
Take Profit: $0.00781 (2R)
Key Levels: Support $0.0083 | Resistance $0.0091
Technical Analysis for $SIGN : Price sits below the 9, 21, 50 and 200EMA, confirming a downtrend. MACD remains negative with a bearish histogram, while RSI at 39 signals weakness. ADX around 18 shows a weak trend, and stochastic is deep in oversold territory. The pair respects the 0.0083 support and faces resistance near 0.0091, favoring short pressure.
Market Context: BTC shows bearish alignment on 4hour and daily charts, though the 24hour change is slightly positive, indicating broader market pressure remains negative.
SHORT $SIGN
SHORT SETUP SIGN
Entry: $0.00848 - $0.00854
Stop Loss: $0.00886
Take Profit: $0.00781 (2R)
Key Levels: Support $0.0083 | Resistance $0.0091
Technical Analysis for $SIGN : Price sits below the 9, 21, 50 and 200EMA, confirming a downtrend. MACD remains negative with a bearish histogram, while RSI at 39 signals weakness. ADX around 18 shows a weak trend, and stochastic is deep in oversold territory. The pair respects the 0.0083 support and faces resistance near 0.0091, favoring short pressure.
Market Context: BTC shows bearish alignment on 4hour and daily charts, though the 24hour change is slightly positive, indicating broader market pressure remains negative.
SHORT $SIGN
عرض الترجمة
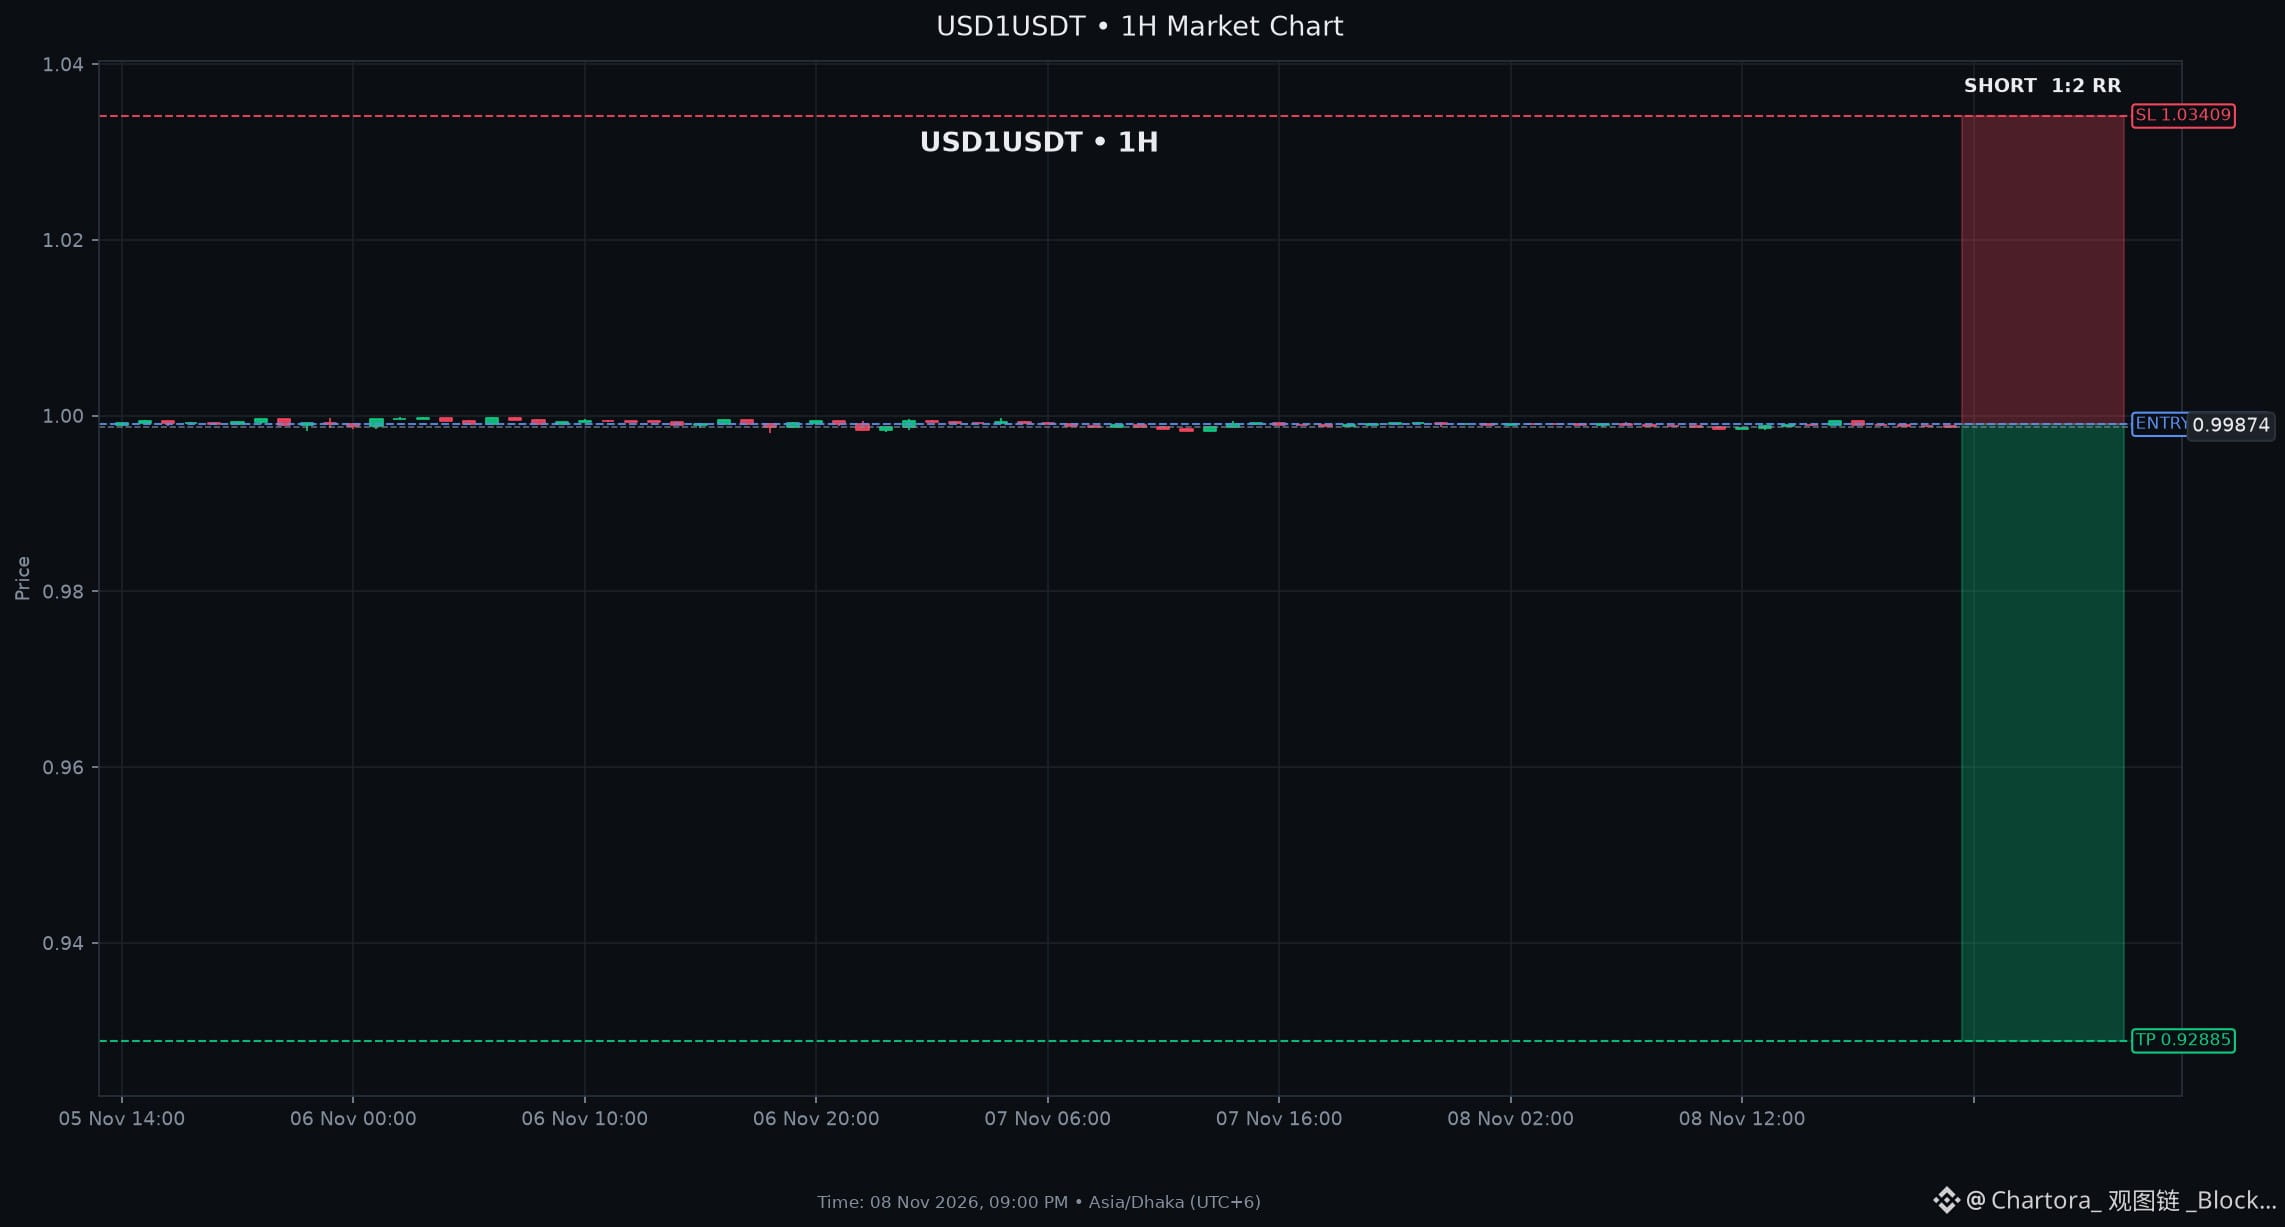
$USD1: Distribution Phase Ends: Downside Target Zone Set
SHORT SETUP USD1
Entry: $0.99890 - $0.99912
Stop Loss: $1.0341
Take Profit: $0.92885 (2R)
Key Levels: Support $0.99873 | Resistance $0.99912
Technical Analysis for $USD1: All key indicators point down. Price sits below EMA9, EMA21, EMA50 and EMA200, while MACD histogram remains negative. Orderbook shows a 38 % askside imbalance. The pair respects a 1H/4H resistance around 0.99912 and support near 0.99873, favoring short bias. Together, these indicators favor SHORT continuation toward support. Negative momentum and trend readings give this setup a clear bearish structure.
Market Context: BTC is in a bearish trend on 4H and daily charts, though the 24hour change is modestly positive, keeping overall market breadth
SHORT $USD1
$USD1 : Distribution Phase Ends: Downside Target Zone Set
SHORT SETUP USD1
Entry: $0.99890 - $0.99912
Stop Loss: $1.0341
Take Profit: $0.92885 (2R)
Key Levels: Support $0.99873 | Resistance $0.99912
Technical Analysis for $USD1 : All key indicators point down. Price sits below EMA9, EMA21, EMA50 and EMA200, while MACD histogram remains negative. Orderbook shows a 38 % askside imbalance. The pair respects a 1H/4H resistance around 0.99912 and support near 0.99873, favoring short bias. Together, these indicators favor SHORT continuation toward support. Negative momentum and trend readings give this setup a clear bearish structure.
Market Context: BTC is in a bearish trend on 4H and daily charts, though the 24hour change is modestly positive, keeping overall market breadth
SHORT $USD1
SHORT SETUP USD1
Entry: $0.99890 - $0.99912
Stop Loss: $1.0341
Take Profit: $0.92885 (2R)
Key Levels: Support $0.99873 | Resistance $0.99912
Technical Analysis for $USD1 : All key indicators point down. Price sits below EMA9, EMA21, EMA50 and EMA200, while MACD histogram remains negative. Orderbook shows a 38 % askside imbalance. The pair respects a 1H/4H resistance around 0.99912 and support near 0.99873, favoring short bias. Together, these indicators favor SHORT continuation toward support. Negative momentum and trend readings give this setup a clear bearish structure.
Market Context: BTC is in a bearish trend on 4H and daily charts, though the 24hour change is modestly positive, keeping overall market breadth
SHORT $USD1
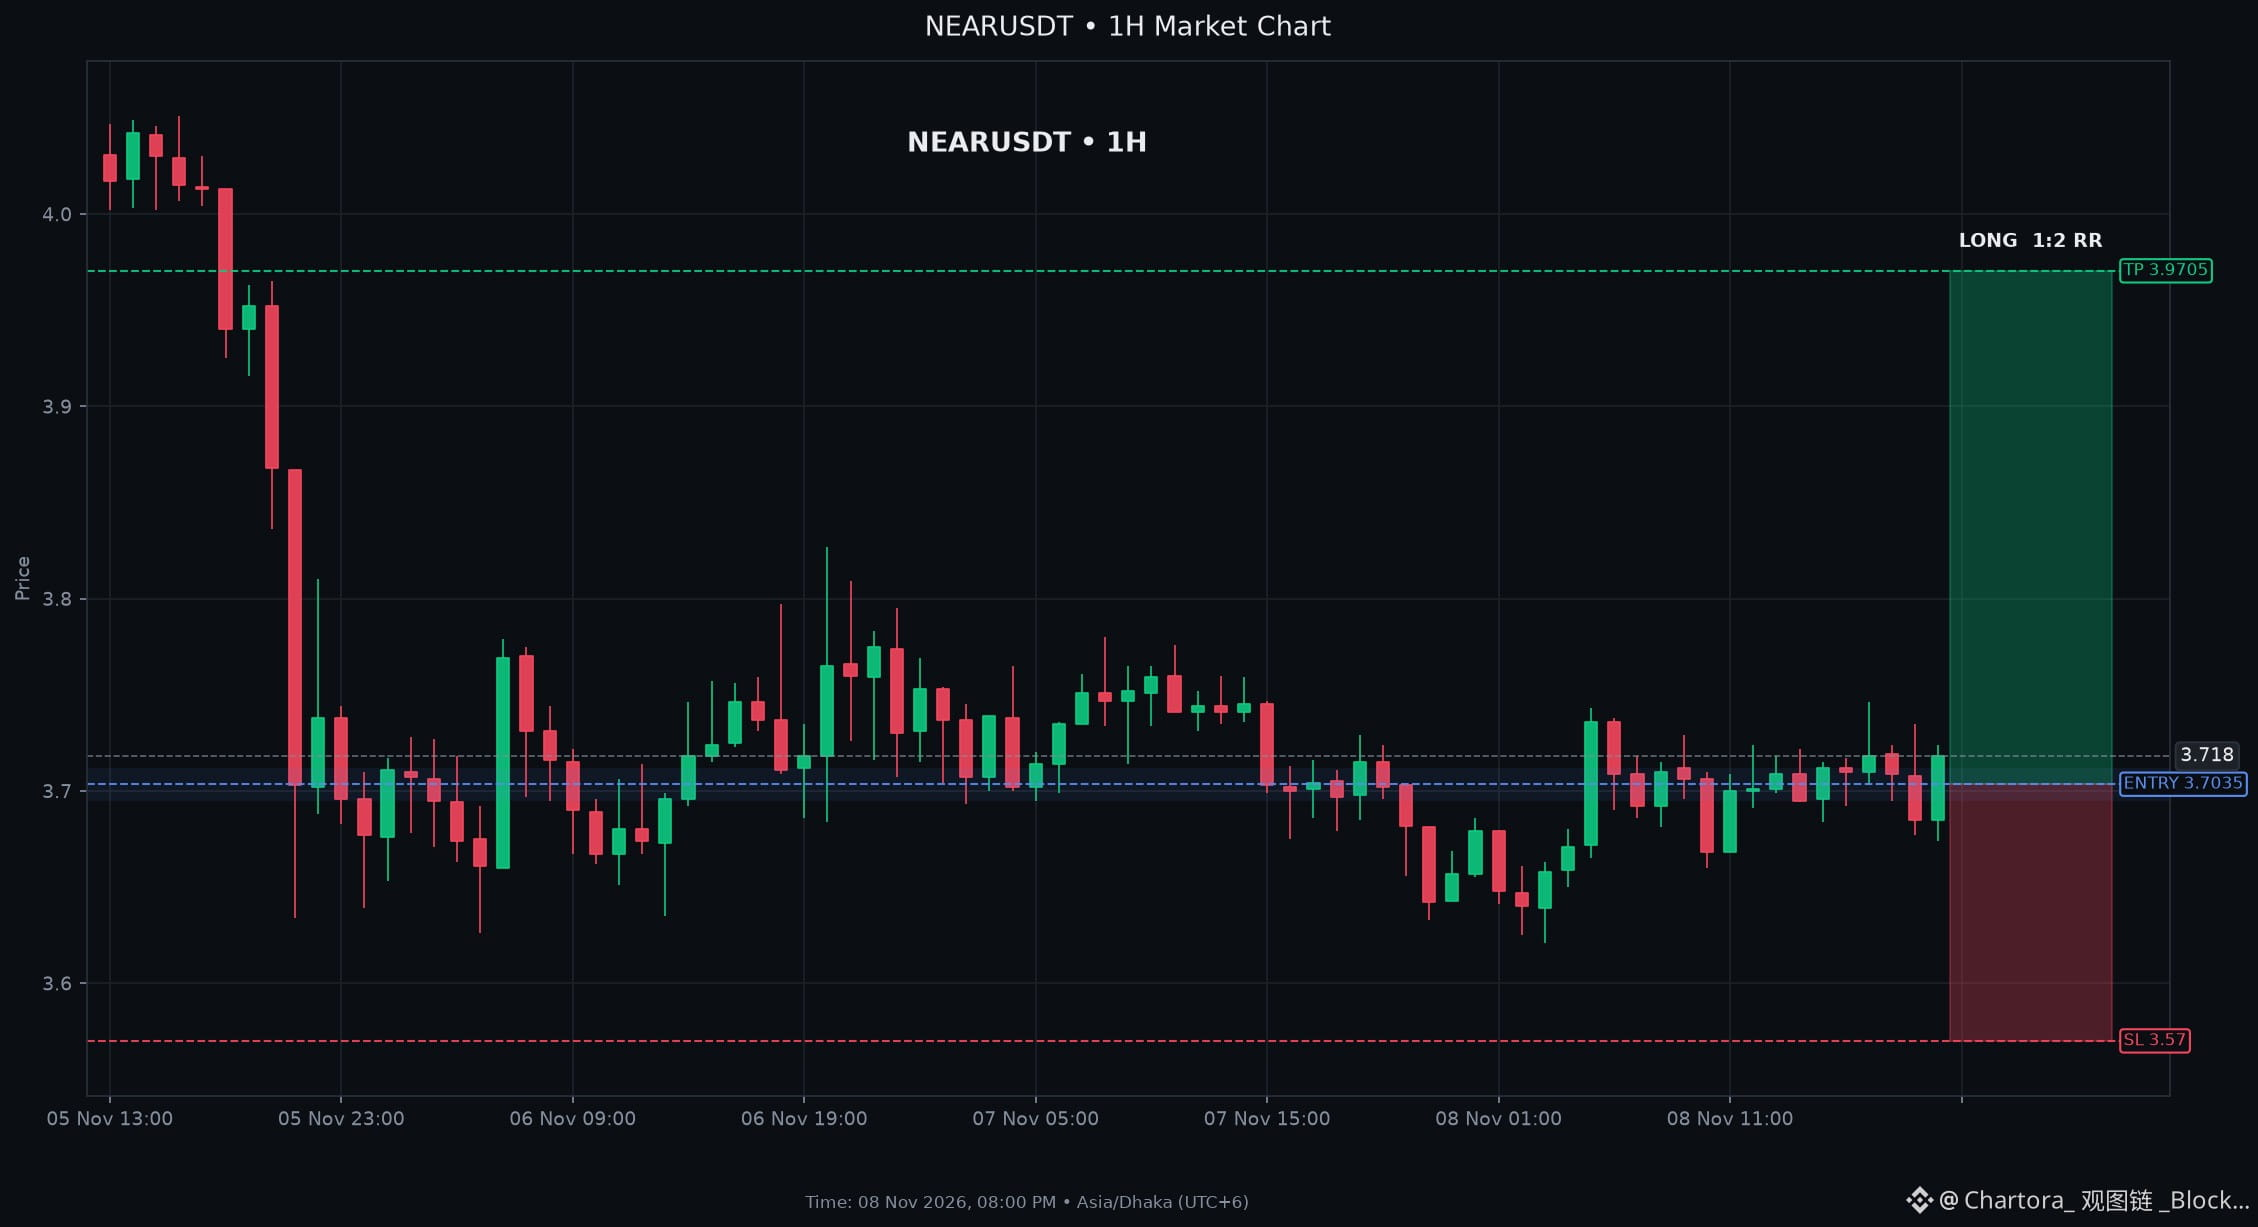
$NEAR: تأكد انعكاس الاتجاه لـ $NEAR مع ارتفاع حجم التداول
إعداد صفقة شراء على NEAR
الدخول: $3.6950 - $3.7120
وقف الخسارة: $3.5700
جني الأرباح: $3.9705 (2R)
المستويات الرئيسية: الدعم $3.6950 | المقاومة $3.7240
التحليل الفني لـ $NEAR: يتم تداول NEAR أعلى بقليل من مستوى الدعم على إطار الساعة عند 3.695، وقرب مستوى المقاومة عند 3.724. مخطط MACD البياني إيجابي، ومؤشر ستوكاستك K عند 67 فوق خط D، والسعر أعلى من المتوسطين الأسيين 9 و21، وكلها تشير إلى زخم صعودي. مؤشر RSI محايد ومؤشر ADX منخفض، ما يشير إلى ميل صعودي معتدل.
سياق السوق: يُظهر BTC تحركًا صعوديًا طفيفًا (+0.27%)، بينما لا يزال السوق ككل سلبيًا إلى حد كبير، إذ إن 78.8% من الأصول في المنطقة الحمراء.
شراء $NEAR
$NEAR : تأكد انعكاس الاتجاه لـ $NEAR مع ارتفاع حجم التداول
إعداد صفقة شراء على NEAR
الدخول: $3.6950 - $3.7120
وقف الخسارة: $3.5700
جني الأرباح: $3.9705 (2R)
المستويات الرئيسية: الدعم $3.6950 | المقاومة $3.7240
التحليل الفني لـ $NEAR : يتم تداول NEAR أعلى بقليل من مستوى الدعم على إطار الساعة عند 3.695، وقرب مستوى المقاومة عند 3.724. مخطط MACD البياني إيجابي، ومؤشر ستوكاستك K عند 67 فوق خط D، والسعر أعلى من المتوسطين الأسيين 9 و21، وكلها تشير إلى زخم صعودي. مؤشر RSI محايد ومؤشر ADX منخفض، ما يشير إلى ميل صعودي معتدل.
سياق السوق: يُظهر BTC تحركًا صعوديًا طفيفًا (+0.27%)، بينما لا يزال السوق ككل سلبيًا إلى حد كبير، إذ إن 78.8% من الأصول في المنطقة الحمراء.
شراء $NEAR
إعداد صفقة شراء على NEAR
الدخول: $3.6950 - $3.7120
وقف الخسارة: $3.5700
جني الأرباح: $3.9705 (2R)
المستويات الرئيسية: الدعم $3.6950 | المقاومة $3.7240
التحليل الفني لـ $NEAR : يتم تداول NEAR أعلى بقليل من مستوى الدعم على إطار الساعة عند 3.695، وقرب مستوى المقاومة عند 3.724. مخطط MACD البياني إيجابي، ومؤشر ستوكاستك K عند 67 فوق خط D، والسعر أعلى من المتوسطين الأسيين 9 و21، وكلها تشير إلى زخم صعودي. مؤشر RSI محايد ومؤشر ADX منخفض، ما يشير إلى ميل صعودي معتدل.
سياق السوق: يُظهر BTC تحركًا صعوديًا طفيفًا (+0.27%)، بينما لا يزال السوق ككل سلبيًا إلى حد كبير، إذ إن 78.8% من الأصول في المنطقة الحمراء.
شراء $NEAR
26
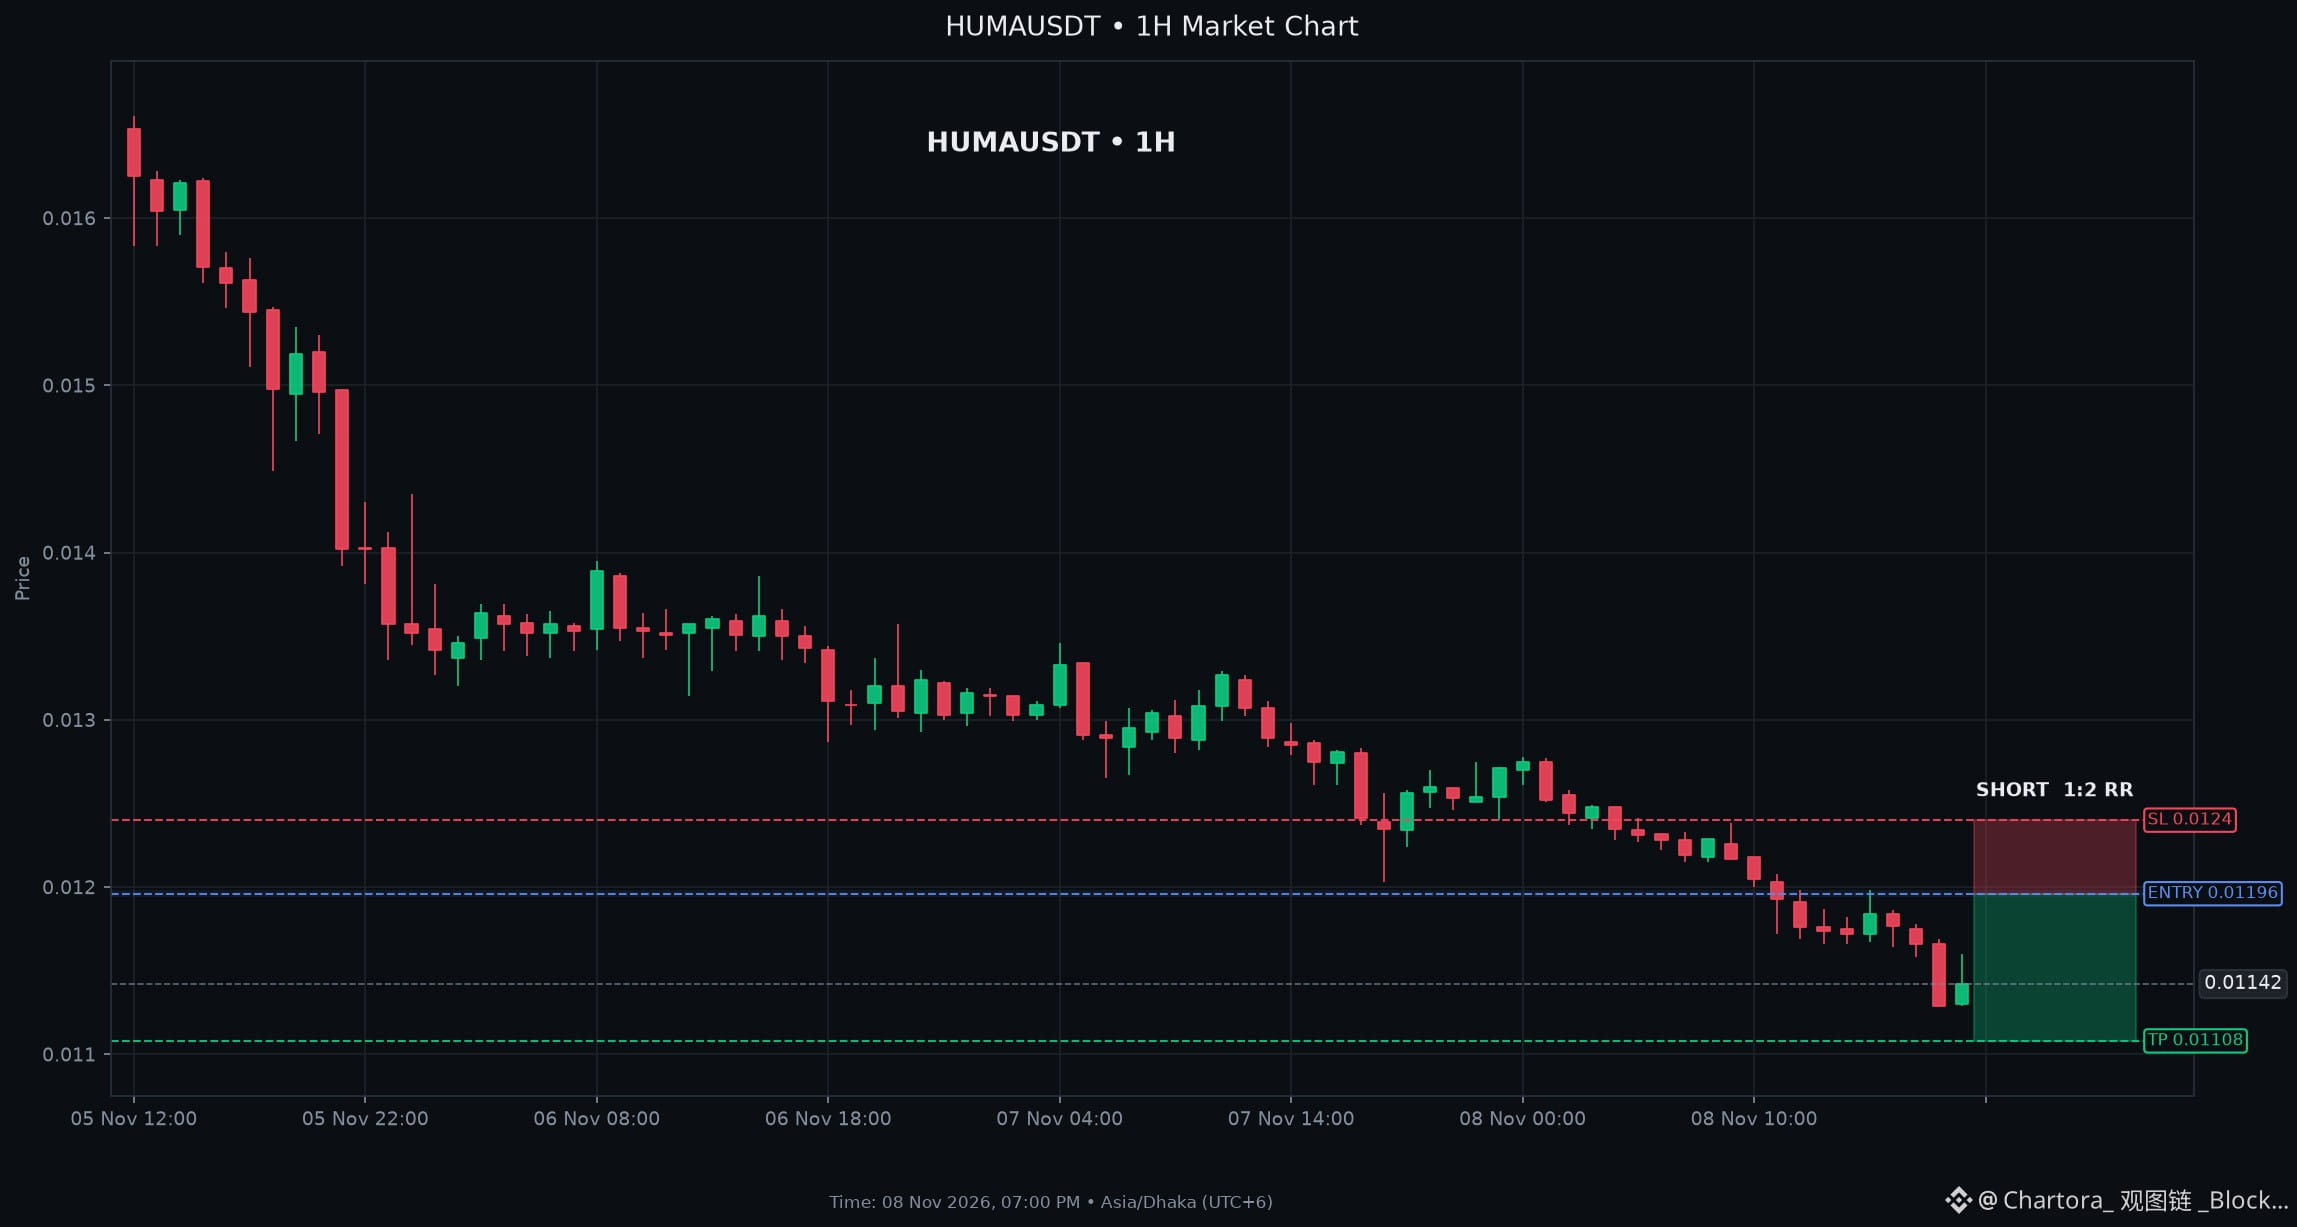
$HUMA: تأكد نمط القمم الهابطة: هدف البيع على المكشوف بات قريبًا
إعداد بيع على المكشوف لـ HUMA
الدخول: $0.01194 - $0.01198
وقف الخسارة: $0.01240
جني الأرباح: $0.01108 (2R)
المستويات الرئيسية: الدعم $0.01126 | المقاومة $0.01198
التحليل الفني لـ $HUMA: تسود التوقعات الهبوطية. يتداول السعر دون EMA9 وEMA21 وEMA50 وEMA200، مما يؤكد الاتجاه الهابط. لا يزال خط MACD دون خط الإشارة مع مدرج تكراري سلبي، بينما تشير قراءة ADX البالغة 42 إلى اتجاه قوي. ترجح هذه المؤشرات مجتمعةً استمرار البيع على المكشوف نحو مستوى الدعم. ويمنح الزخم السلبي وقراءات الاتجاه هذا الإعداد بنية هبوطية واضحة.
سياق السوق: لا يزال BTC ضمن اتجاه هبوطي على إطارَي 4 ساعات واليومي، فيما تسود السلبية السوق الأوسع، مع تراجع 80.5% من الأصول.
بيع $HUMA على المكشوف
$HUMA : تأكد نمط القمم الهابطة: هدف البيع على المكشوف بات قريبًا
إعداد بيع على المكشوف لـ HUMA
الدخول: $0.01194 - $0.01198
وقف الخسارة: $0.01240
جني الأرباح: $0.01108 (2R)
المستويات الرئيسية: الدعم $0.01126 | المقاومة $0.01198
التحليل الفني لـ $HUMA : تسود التوقعات الهبوطية. يتداول السعر دون EMA9 وEMA21 وEMA50 وEMA200، مما يؤكد الاتجاه الهابط. لا يزال خط MACD دون خط الإشارة مع مدرج تكراري سلبي، بينما تشير قراءة ADX البالغة 42 إلى اتجاه قوي. ترجح هذه المؤشرات مجتمعةً استمرار البيع على المكشوف نحو مستوى الدعم. ويمنح الزخم السلبي وقراءات الاتجاه هذا الإعداد بنية هبوطية واضحة.
سياق السوق: لا يزال BTC ضمن اتجاه هبوطي على إطارَي 4 ساعات واليومي، فيما تسود السلبية السوق الأوسع، مع تراجع 80.5% من الأصول.
بيع $HUMA على المكشوف
إعداد بيع على المكشوف لـ HUMA
الدخول: $0.01194 - $0.01198
وقف الخسارة: $0.01240
جني الأرباح: $0.01108 (2R)
المستويات الرئيسية: الدعم $0.01126 | المقاومة $0.01198
التحليل الفني لـ $HUMA : تسود التوقعات الهبوطية. يتداول السعر دون EMA9 وEMA21 وEMA50 وEMA200، مما يؤكد الاتجاه الهابط. لا يزال خط MACD دون خط الإشارة مع مدرج تكراري سلبي، بينما تشير قراءة ADX البالغة 42 إلى اتجاه قوي. ترجح هذه المؤشرات مجتمعةً استمرار البيع على المكشوف نحو مستوى الدعم. ويمنح الزخم السلبي وقراءات الاتجاه هذا الإعداد بنية هبوطية واضحة.
سياق السوق: لا يزال BTC ضمن اتجاه هبوطي على إطارَي 4 ساعات واليومي، فيما تسود السلبية السوق الأوسع، مع تراجع 80.5% من الأصول.
بيع $HUMA على المكشوف
12
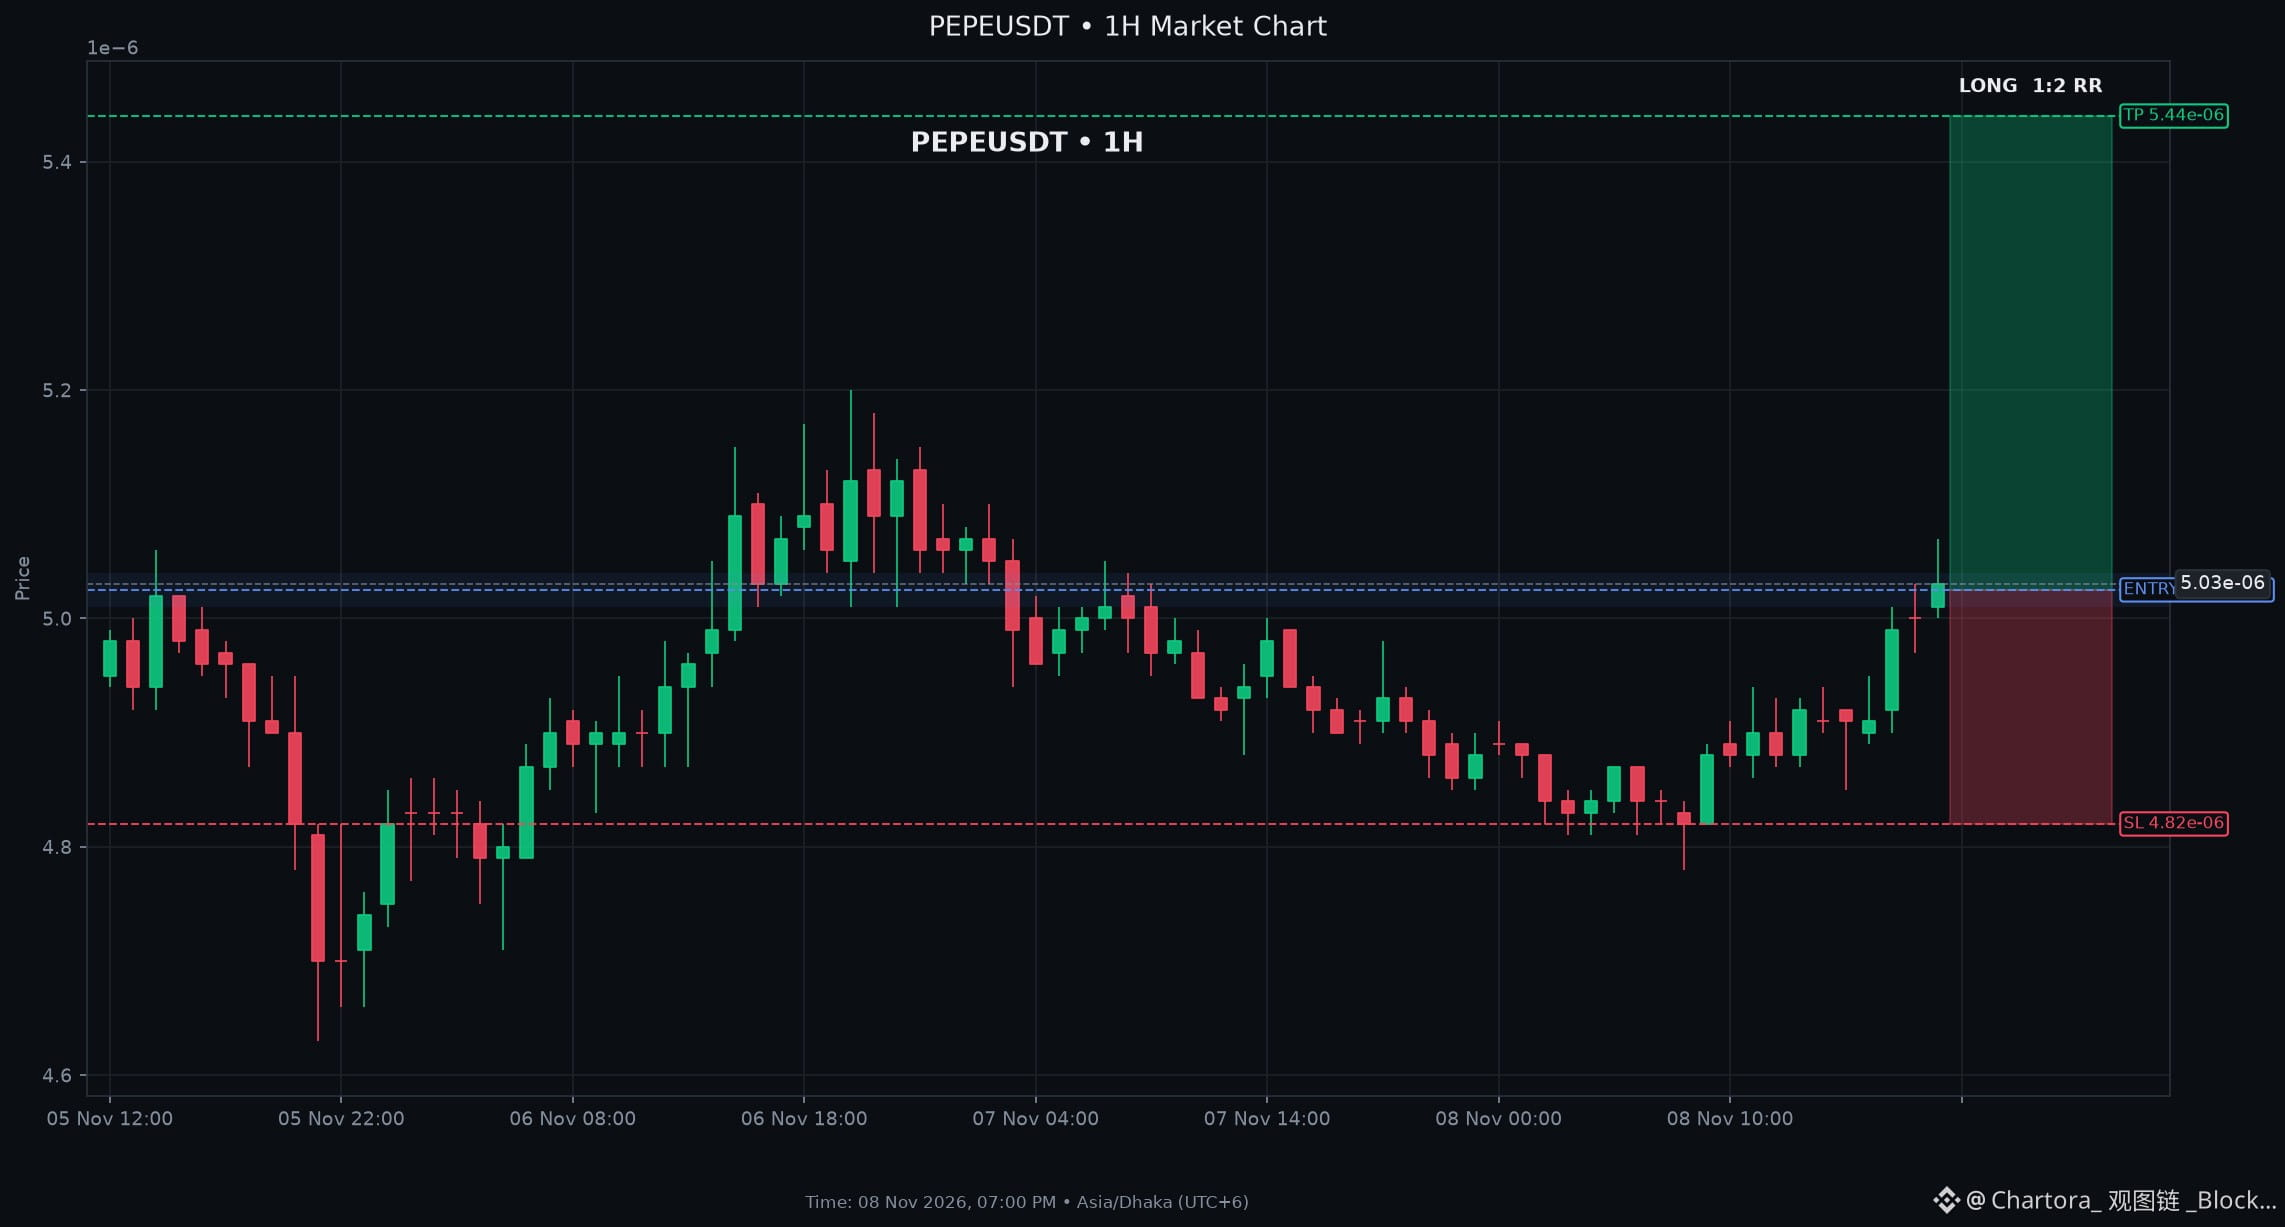
$PEPE: المشترون يدافعون عن منطقة طلب رئيسية: $PEPE مستعد لمواصلة الصعود
إعداد صفقة شراء PEPE
الدخول: $0.00000501 - $0.00000504
وقف الخسارة: $0.00000482
جني الأرباح: $0.00000544 (2R)
المستويات الرئيسية: الدعم $0.00000501 | المقاومة $0.00000505
التحليل الفني لـ $PEPE: يتداول PEPEUSDT فوق المتوسطات المتحركة الأسية لـ 9 و21 و50 و200 فترة، كما أن مخطط MACD إيجابي، ما يشير إلى زخم صعودي. ارتفع حجم التداول بنسبة 179 %، وتشير قراءة مؤشر RSI عند 68 إلى القوة، رغم أن مؤشر ستوكاستيك في منطقة تشبع شرائي. ومع وجود دعم على إطار الساعة عند 5.01 ومقاومة قرب 5.05، تميل المؤشرات إلى الاتجاه الصعودي.
سياق السوق: ارتفع BTC بشكل طفيف بنسبة 0.02 % على إطاري 4 ساعات واليوم الواحد، لكن السوق الأوسع لا يزال سلبيًا عمومًا بنسبة 83 %
شراء $PEPE
$PEPE : المشترون يدافعون عن منطقة طلب رئيسية: $PEPE مستعد لمواصلة الصعود
إعداد صفقة شراء PEPE
الدخول: $0.00000501 - $0.00000504
وقف الخسارة: $0.00000482
جني الأرباح: $0.00000544 (2R)
المستويات الرئيسية: الدعم $0.00000501 | المقاومة $0.00000505
التحليل الفني لـ $PEPE : يتداول PEPEUSDT فوق المتوسطات المتحركة الأسية لـ 9 و21 و50 و200 فترة، كما أن مخطط MACD إيجابي، ما يشير إلى زخم صعودي. ارتفع حجم التداول بنسبة 179 %، وتشير قراءة مؤشر RSI عند 68 إلى القوة، رغم أن مؤشر ستوكاستيك في منطقة تشبع شرائي. ومع وجود دعم على إطار الساعة عند 5.01 ومقاومة قرب 5.05، تميل المؤشرات إلى الاتجاه الصعودي.
سياق السوق: ارتفع BTC بشكل طفيف بنسبة 0.02 % على إطاري 4 ساعات واليوم الواحد، لكن السوق الأوسع لا يزال سلبيًا عمومًا بنسبة 83 %
شراء $PEPE
إعداد صفقة شراء PEPE
الدخول: $0.00000501 - $0.00000504
وقف الخسارة: $0.00000482
جني الأرباح: $0.00000544 (2R)
المستويات الرئيسية: الدعم $0.00000501 | المقاومة $0.00000505
التحليل الفني لـ $PEPE : يتداول PEPEUSDT فوق المتوسطات المتحركة الأسية لـ 9 و21 و50 و200 فترة، كما أن مخطط MACD إيجابي، ما يشير إلى زخم صعودي. ارتفع حجم التداول بنسبة 179 %، وتشير قراءة مؤشر RSI عند 68 إلى القوة، رغم أن مؤشر ستوكاستيك في منطقة تشبع شرائي. ومع وجود دعم على إطار الساعة عند 5.01 ومقاومة قرب 5.05، تميل المؤشرات إلى الاتجاه الصعودي.
سياق السوق: ارتفع BTC بشكل طفيف بنسبة 0.02 % على إطاري 4 ساعات واليوم الواحد، لكن السوق الأوسع لا يزال سلبيًا عمومًا بنسبة 83 %
شراء $PEPE
3
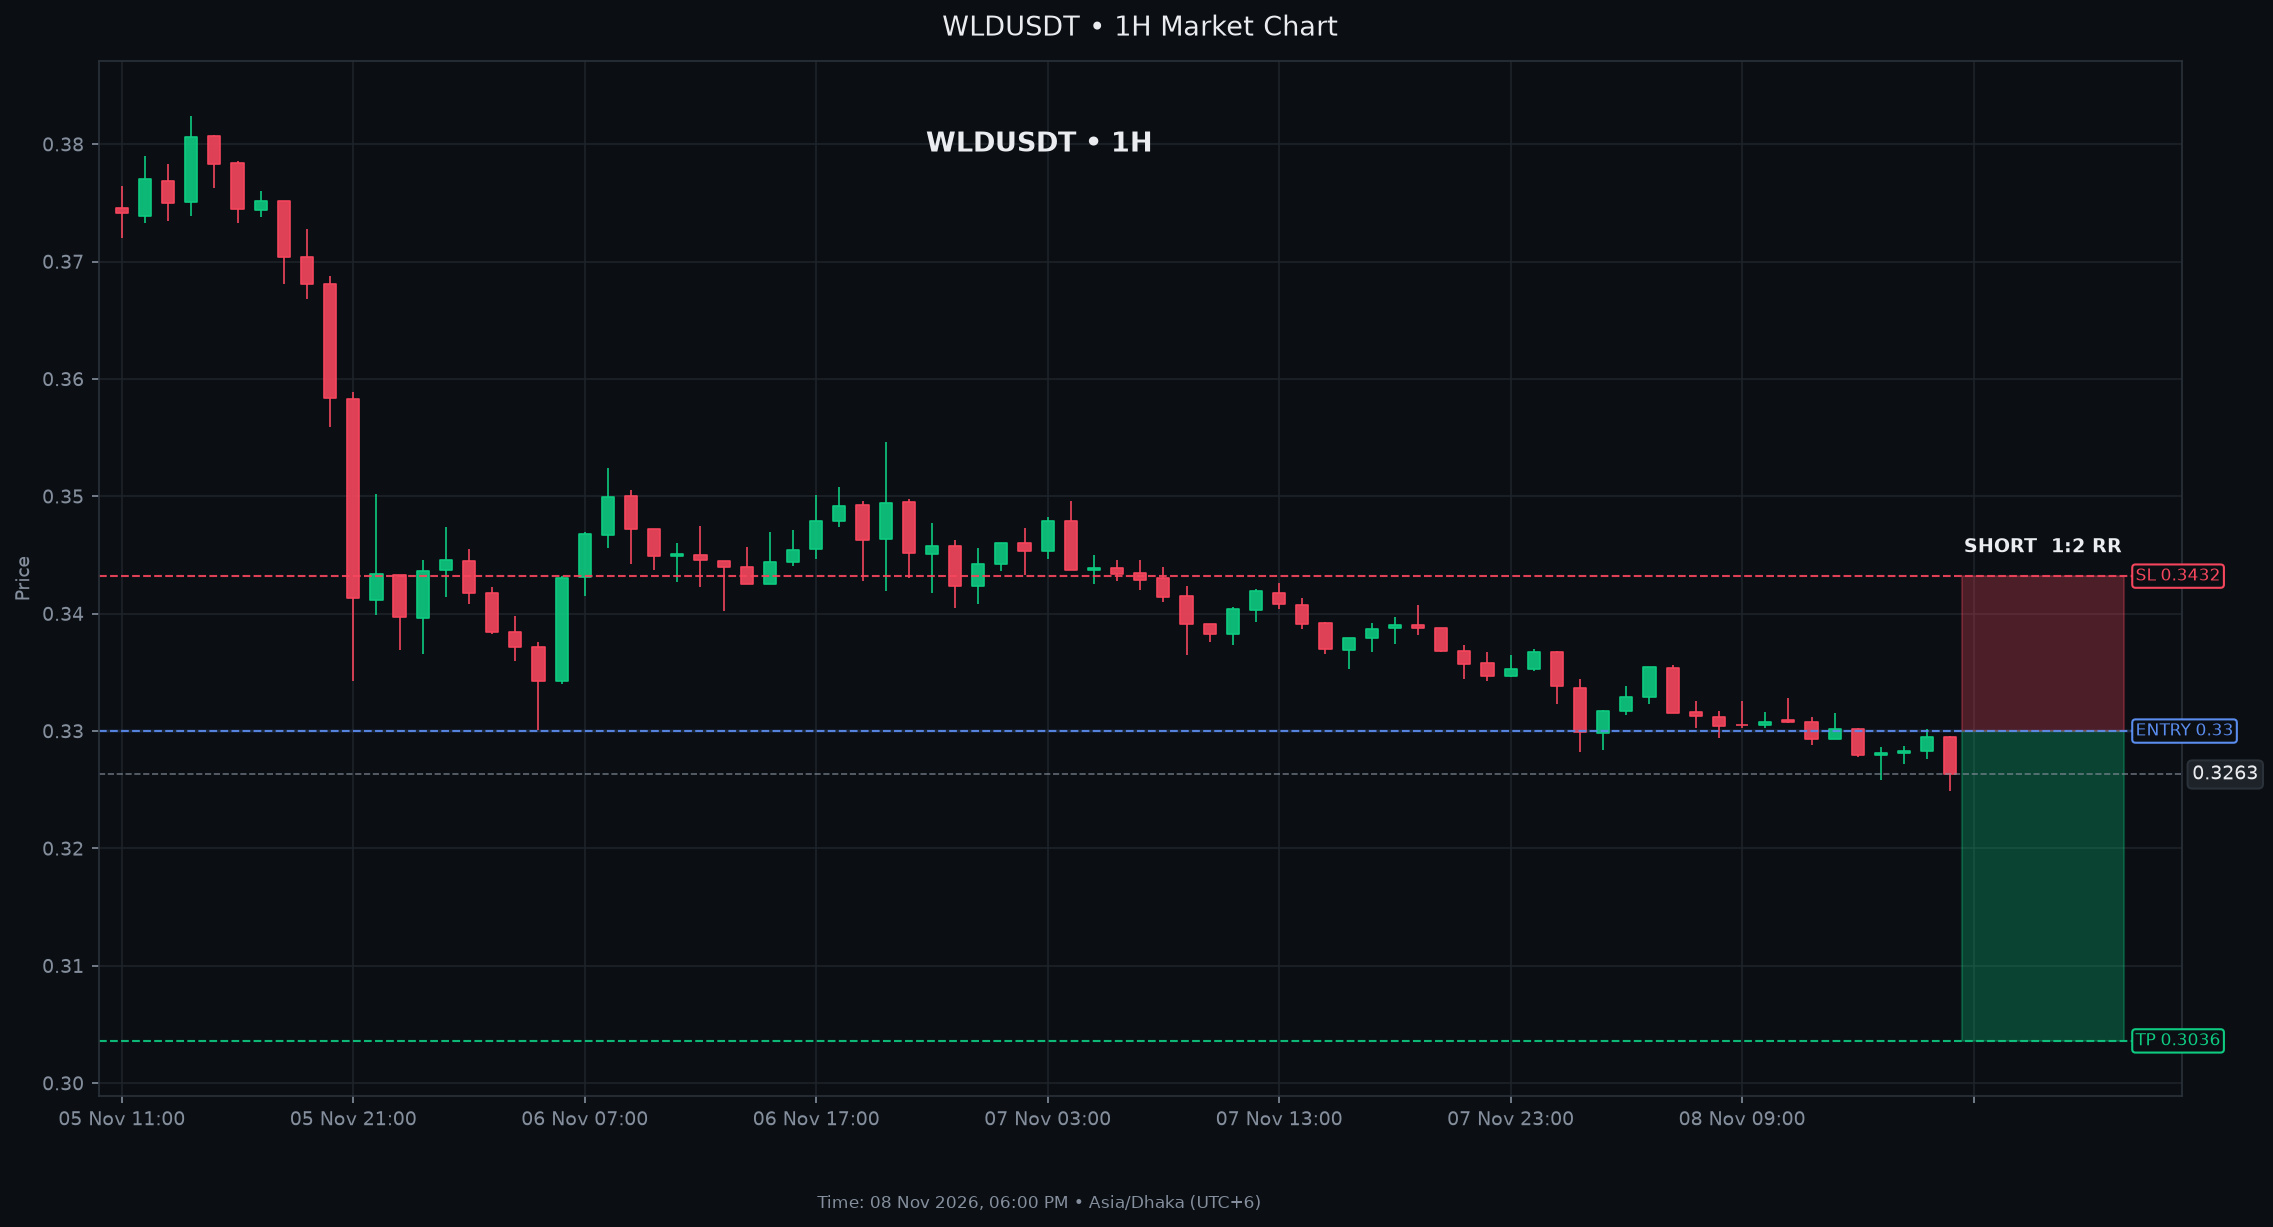
$WLD: يستعد للانهيار: تصاعد مخاطر الهبوط
إعداد صفقة بيع على المكشوف لـ WLD
الدخول: $0.32980 - $0.33020
وقف الخسارة: $0.34320
جني الأرباح: $0.30360 (2R)
المستويات الرئيسية: الدعم $0.32490 | المقاومة $0.33020
التحليل الفني لـ $WLD: يتداول السعر دون EMA9 وEMA21 وEMA50 وEMA200، مما يؤكد الاتجاه الهبوطي. يشير مؤشر RSI عند 32.6 وADX عند 26.6 إلى ضعف الزخم، بينما يقترب MACD من الحياد. يتداول الزوج قرب الحد السفلي لخطوط بولينجر، مما يدعم الميل الهبوطي نحو منطقة الدعم عند 0.3249. وبشكل عام، ترجّح هذه المؤشرات استمرار البيع على المكشوف باتجاه الدعم.
سياق السوق: الاتجاه هبوطي لـ BTC على الرسمين البيانيين لأربع ساعات واليومي، رغم أن اتجاه الـ24 ساعة يميل قليلاً إلى الصعود. اتساع السوق سلبي إجمالاً، حيث يبلغ 80.5%
بيع على المكشوف لـ $WLD
$WLD : يستعد للانهيار: تصاعد مخاطر الهبوط
إعداد صفقة بيع على المكشوف لـ WLD
الدخول: $0.32980 - $0.33020
وقف الخسارة: $0.34320
جني الأرباح: $0.30360 (2R)
المستويات الرئيسية: الدعم $0.32490 | المقاومة $0.33020
التحليل الفني لـ $WLD : يتداول السعر دون EMA9 وEMA21 وEMA50 وEMA200، مما يؤكد الاتجاه الهبوطي. يشير مؤشر RSI عند 32.6 وADX عند 26.6 إلى ضعف الزخم، بينما يقترب MACD من الحياد. يتداول الزوج قرب الحد السفلي لخطوط بولينجر، مما يدعم الميل الهبوطي نحو منطقة الدعم عند 0.3249. وبشكل عام، ترجّح هذه المؤشرات استمرار البيع على المكشوف باتجاه الدعم.
سياق السوق: الاتجاه هبوطي لـ BTC على الرسمين البيانيين لأربع ساعات واليومي، رغم أن اتجاه الـ24 ساعة يميل قليلاً إلى الصعود. اتساع السوق سلبي إجمالاً، حيث يبلغ 80.5%
بيع على المكشوف لـ $WLD
إعداد صفقة بيع على المكشوف لـ WLD
الدخول: $0.32980 - $0.33020
وقف الخسارة: $0.34320
جني الأرباح: $0.30360 (2R)
المستويات الرئيسية: الدعم $0.32490 | المقاومة $0.33020
التحليل الفني لـ $WLD : يتداول السعر دون EMA9 وEMA21 وEMA50 وEMA200، مما يؤكد الاتجاه الهبوطي. يشير مؤشر RSI عند 32.6 وADX عند 26.6 إلى ضعف الزخم، بينما يقترب MACD من الحياد. يتداول الزوج قرب الحد السفلي لخطوط بولينجر، مما يدعم الميل الهبوطي نحو منطقة الدعم عند 0.3249. وبشكل عام، ترجّح هذه المؤشرات استمرار البيع على المكشوف باتجاه الدعم.
سياق السوق: الاتجاه هبوطي لـ BTC على الرسمين البيانيين لأربع ساعات واليومي، رغم أن اتجاه الـ24 ساعة يميل قليلاً إلى الصعود. اتساع السوق سلبي إجمالاً، حيث يبلغ 80.5%
بيع على المكشوف لـ $WLD
2
سجّل الدخول لاستكشاف المزيد من المُحتوى
انضم إلى مُستخدمي العملات الرقمية حول العالم على Binance Square
⚡️ احصل على أحدث المعلومات المفيدة عن العملات الرقمية.
💬 موثوقة من قبل أكبر منصّة لتداول العملات الرقمية في العالم.
👍 اكتشف الرؤى الحقيقية من صنّاع المُحتوى الموثوقين.
البريد الإلكتروني / رقم الهاتف
المواضيع الرائجة
BitcoinFiveWeeklyLosses
33 مشاهدات
44 يقومون بالنقاش
أخبار بيتكوين | بيتكوين يتراجع خمسة أسابيع متتالية مع امتداد موجة هبوط أسهم الذكاء الاصطناعي إلى العملات المشفرة
Binance News
·3 إعجاب
·3k مشاهدات
AIChipSlumpNasdaq
15 مشاهدات
28 يقومون بالنقاش
BinanceReopensWithdrawalsForHYPE&APT
128,110 مشاهدات
1,095 يقومون بالنقاش