
CryptoZeno 1
350 منشورات

CryptoZeno 1
Featured Creator on #CoinMarketCap #BinanceSquare and #CryptoQuant | On Chain Research and Market Insights
0 تتابع
8 المتابعون
18 إعجاب
منشورات
عرض الترجمة
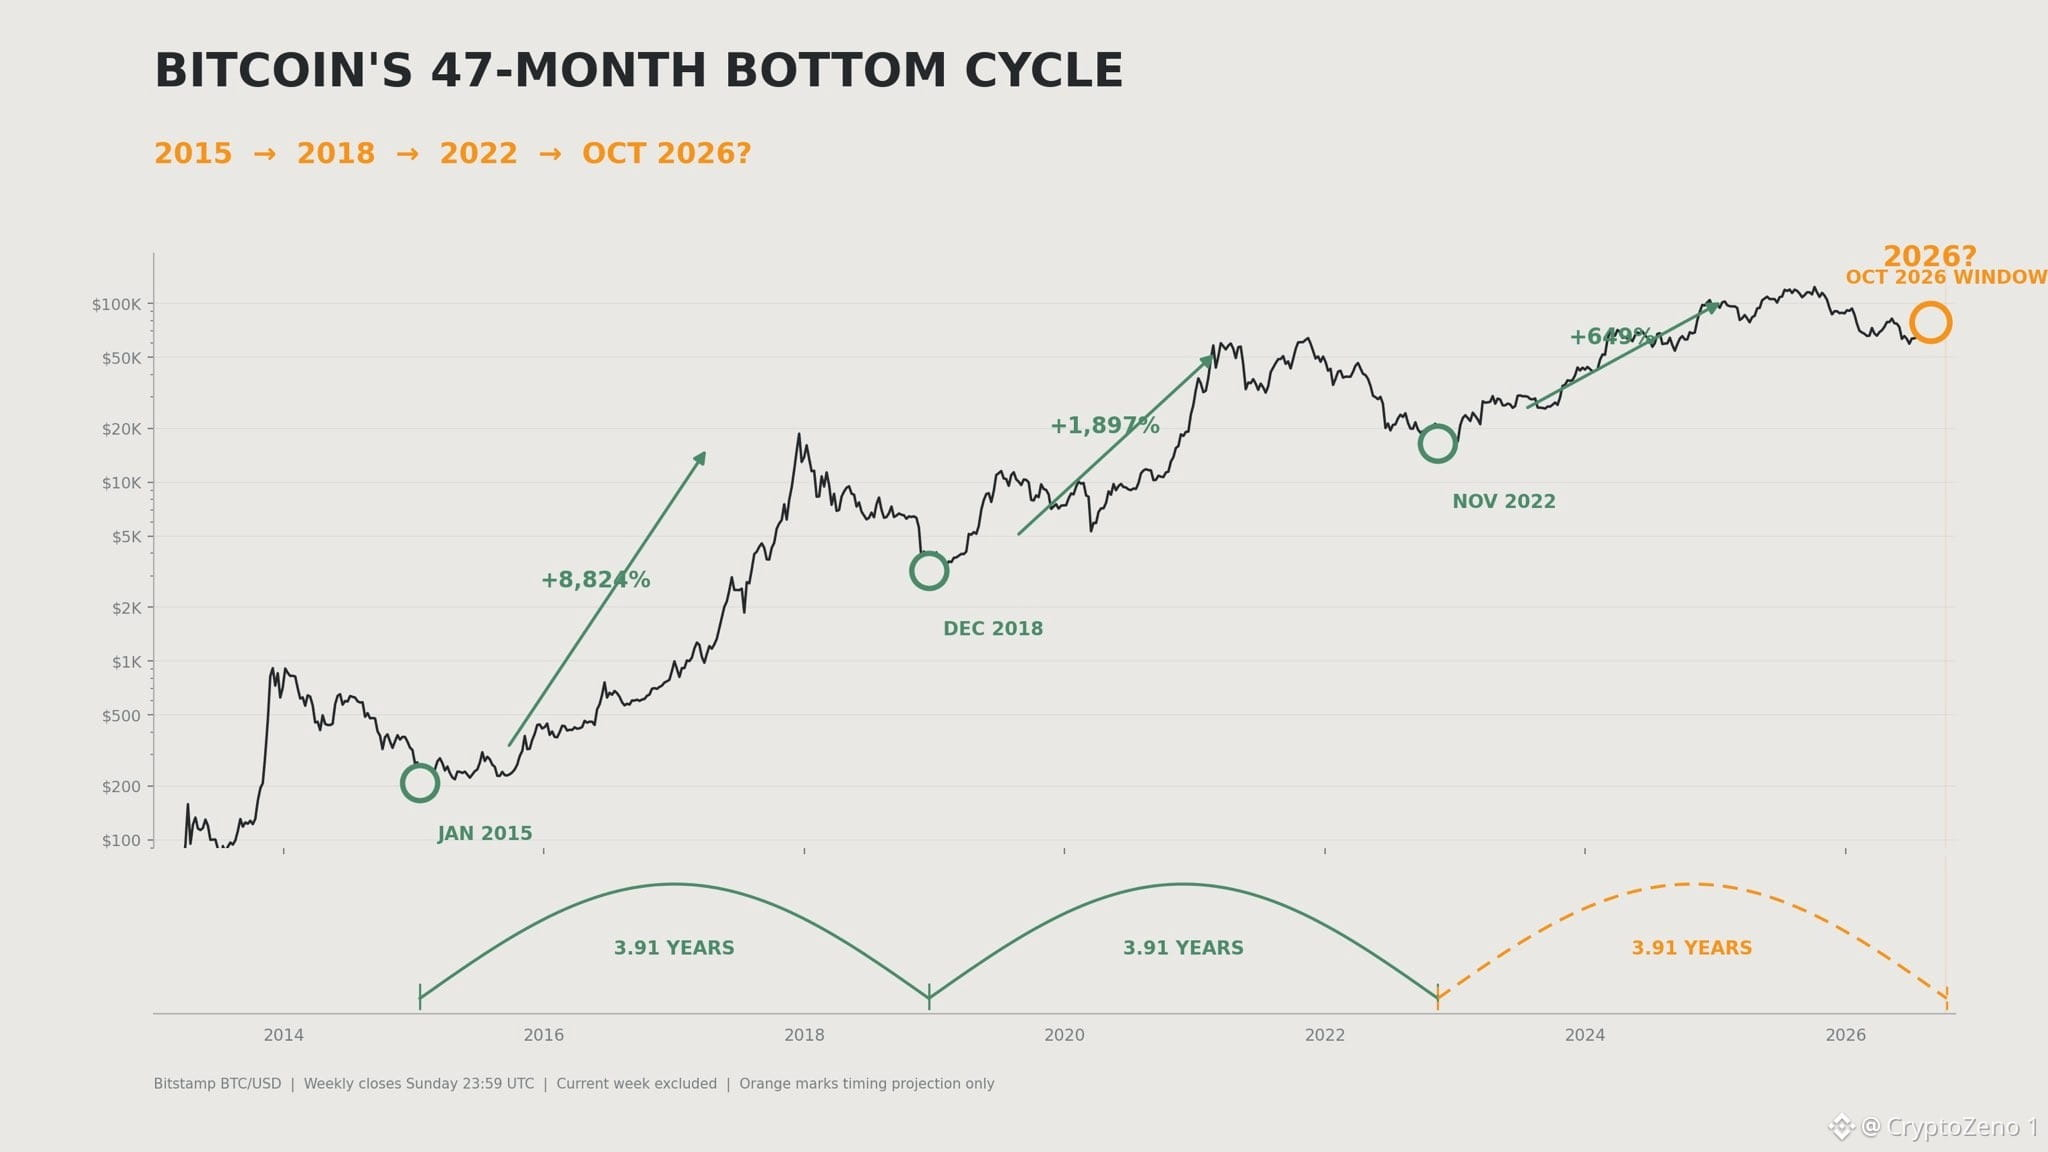
#Bitcoin last two bottom-to-bottom cycles both lasted exactly 1,428 days.
After those cycle lows,
$BTC
rallied:
• 2015: +8,824%
• 2018: +1,897%
• 2022: +649%
That rhythm projects the next timing window into October 2026.
But I don’t think Bitcoin needs to make a new low exactly then. July’s ~$58K may already have been the bottom, or close enough.
Markets front-run obvious cycles. #BTC Price Analysis# #Macro Insights#
After those cycle lows,
$BTC
rallied:
• 2015: +8,824%
• 2018: +1,897%
• 2022: +649%
That rhythm projects the next timing window into October 2026.
But I don’t think Bitcoin needs to make a new low exactly then. July’s ~$58K may already have been the bottom, or close enough.
Markets front-run obvious cycles. #BTC Price Analysis# #Macro Insights#
عرض الترجمة
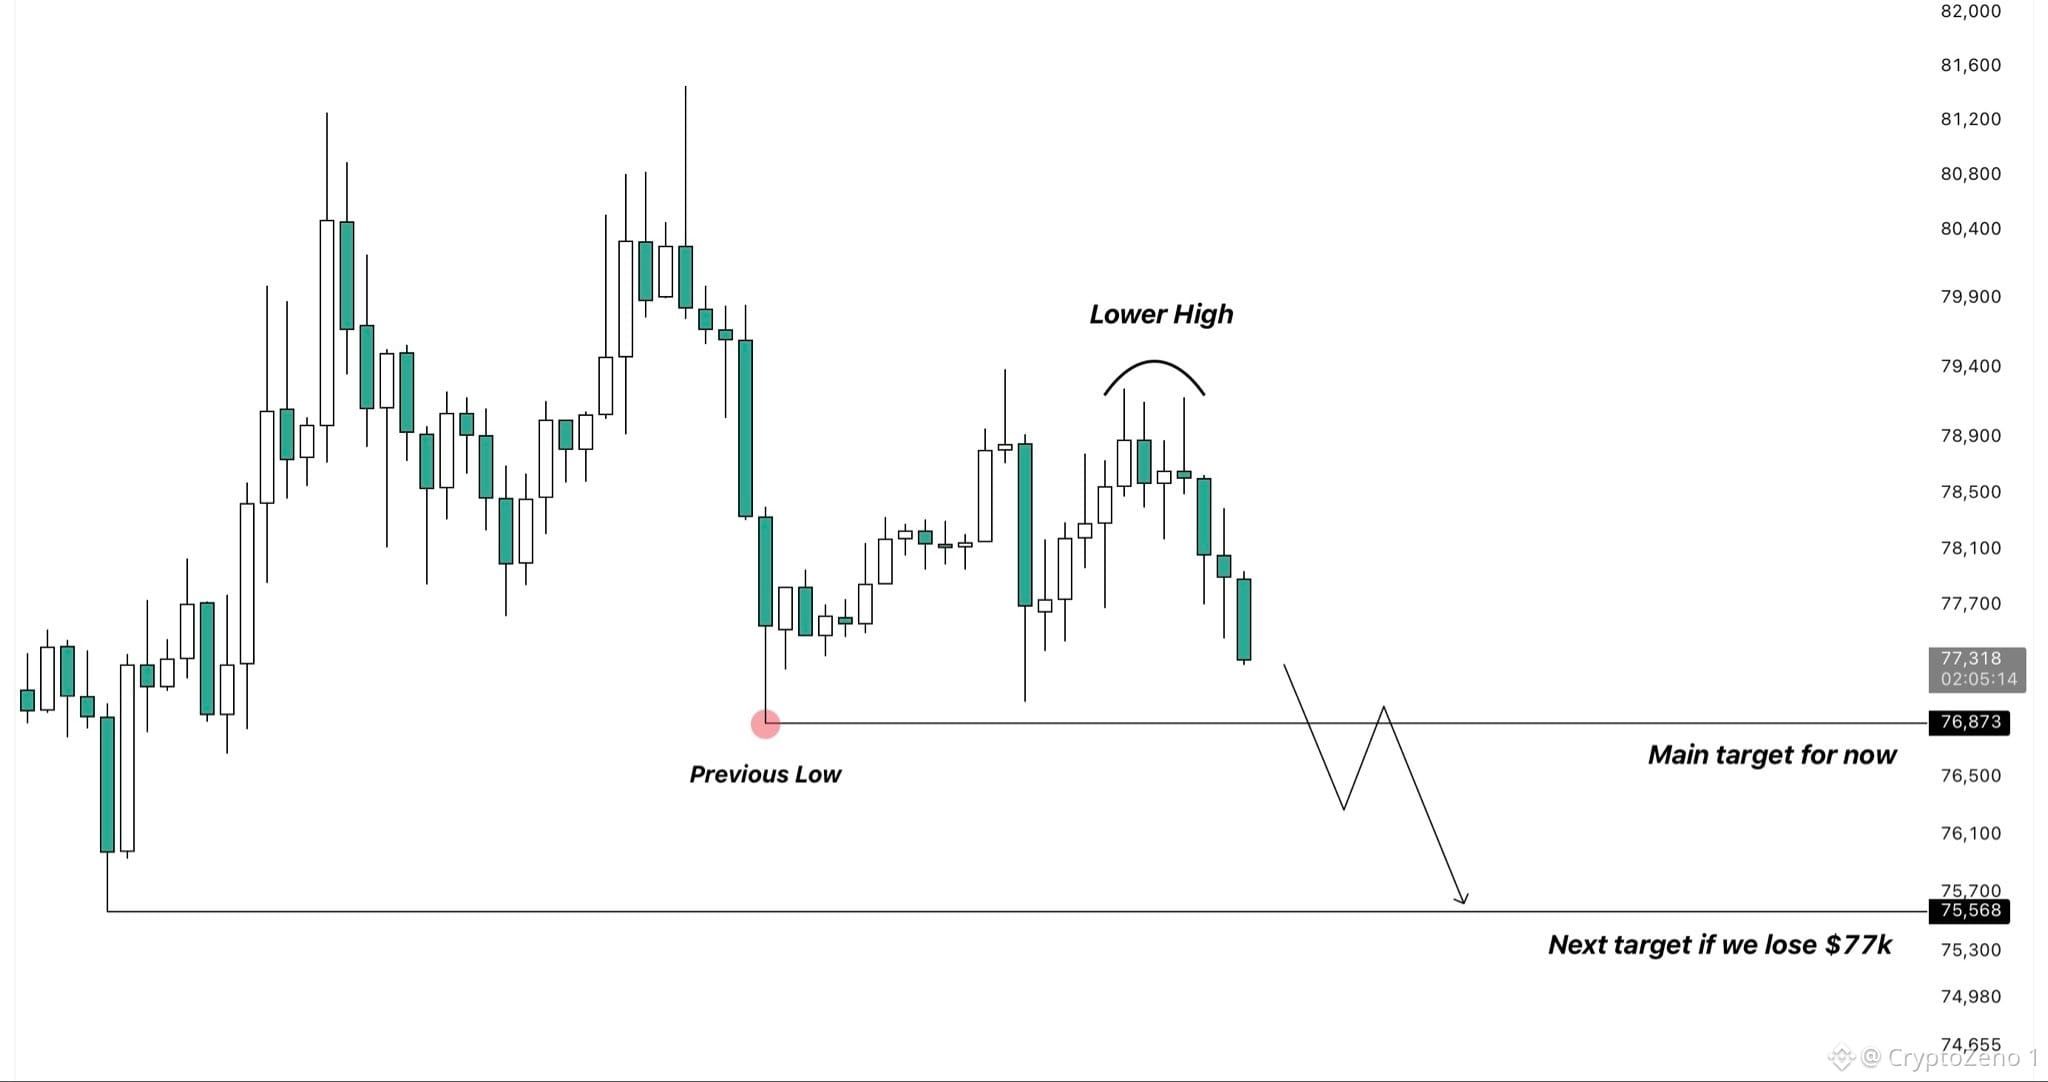
$BTC Structure is starting to look increasingly bearish.
After failing to reclaim the previous high, BTC has now printed a clear lower high and is moving back toward the
recent low around $76.9K.
That level remains my main short-term target for now.
If buyers manage to defend it again, we could see another bounce and would have to reassess from there.
However, if $77K gives way and price finds acceptance below it, I would expect a continuation to the downside to target the remaining low around $75.6K. #BTC Price Analysis# #Macro Insights# #BNBChain#
After failing to reclaim the previous high, BTC has now printed a clear lower high and is moving back toward the
recent low around $76.9K.
That level remains my main short-term target for now.
If buyers manage to defend it again, we could see another bounce and would have to reassess from there.
However, if $77K gives way and price finds acceptance below it, I would expect a continuation to the downside to target the remaining low around $75.6K. #BTC Price Analysis# #Macro Insights# #BNBChain#
عرض الترجمة
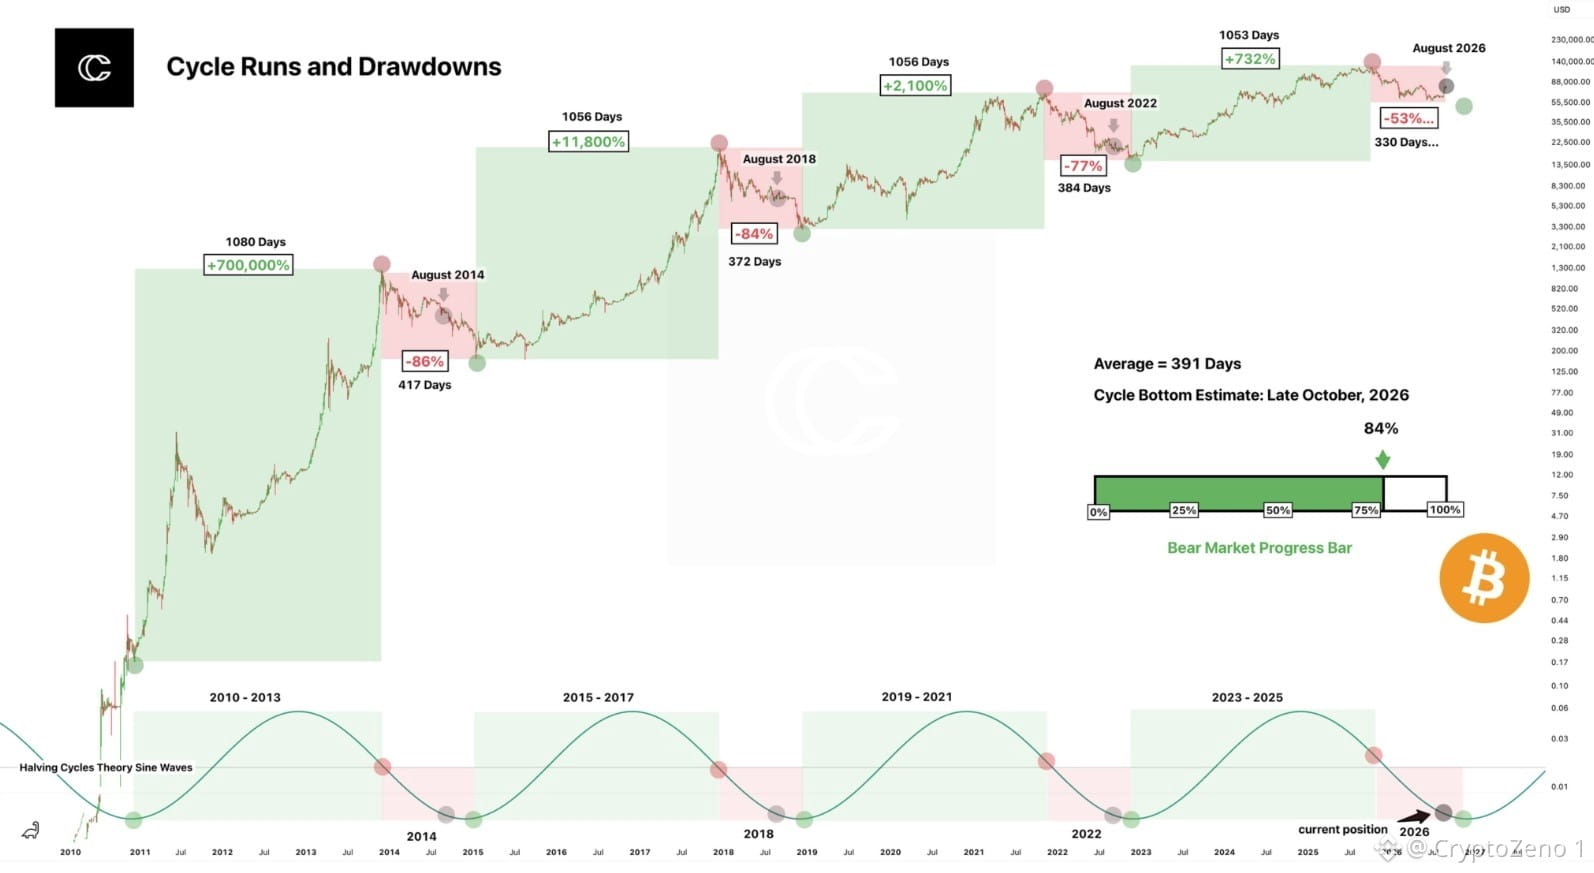
🚨 $BTC Cycle History Is Flashing A Major Warning #Bitcoin may be entering the late stage of a cycle that has historically preceded brutal drawdowns. The chart shows strikingly consistent behavior across previous cycles, with major peaks followed by corrections of roughly 84%, 86%, 77%, and 53%, while the expansion phases repeatedly lasted around 1,050 days. The current cycle has reached approximately 1,053 days, remarkably close to the duration of the previous major expansion phases. If historical timing continues to rhyme, the market may already be transitioning from distribution into a deeper bearish phase, with the chart estimating an average 391 day bear market cycle and a potential bottom around late October 2026. What makes this setup interesting is the combination of cycle duration, historical drawdown structure, and the halving cycle sine wave. The current position appears increasingly aligned with the declining side of the long term cycle, suggesting that BTC may have more downside risk ahead before the next major accumulation phase begins. History does not repeat perfectly, but when multiple independent cycle measurements point toward the same region, ignoring the signal can become expensive. BTC is not necessarily at the bottom yet. The real question may be how much of the bear cycle is still ahead. 📉 #BTC Price Analysis# #Macro Insights#
عرض الترجمة
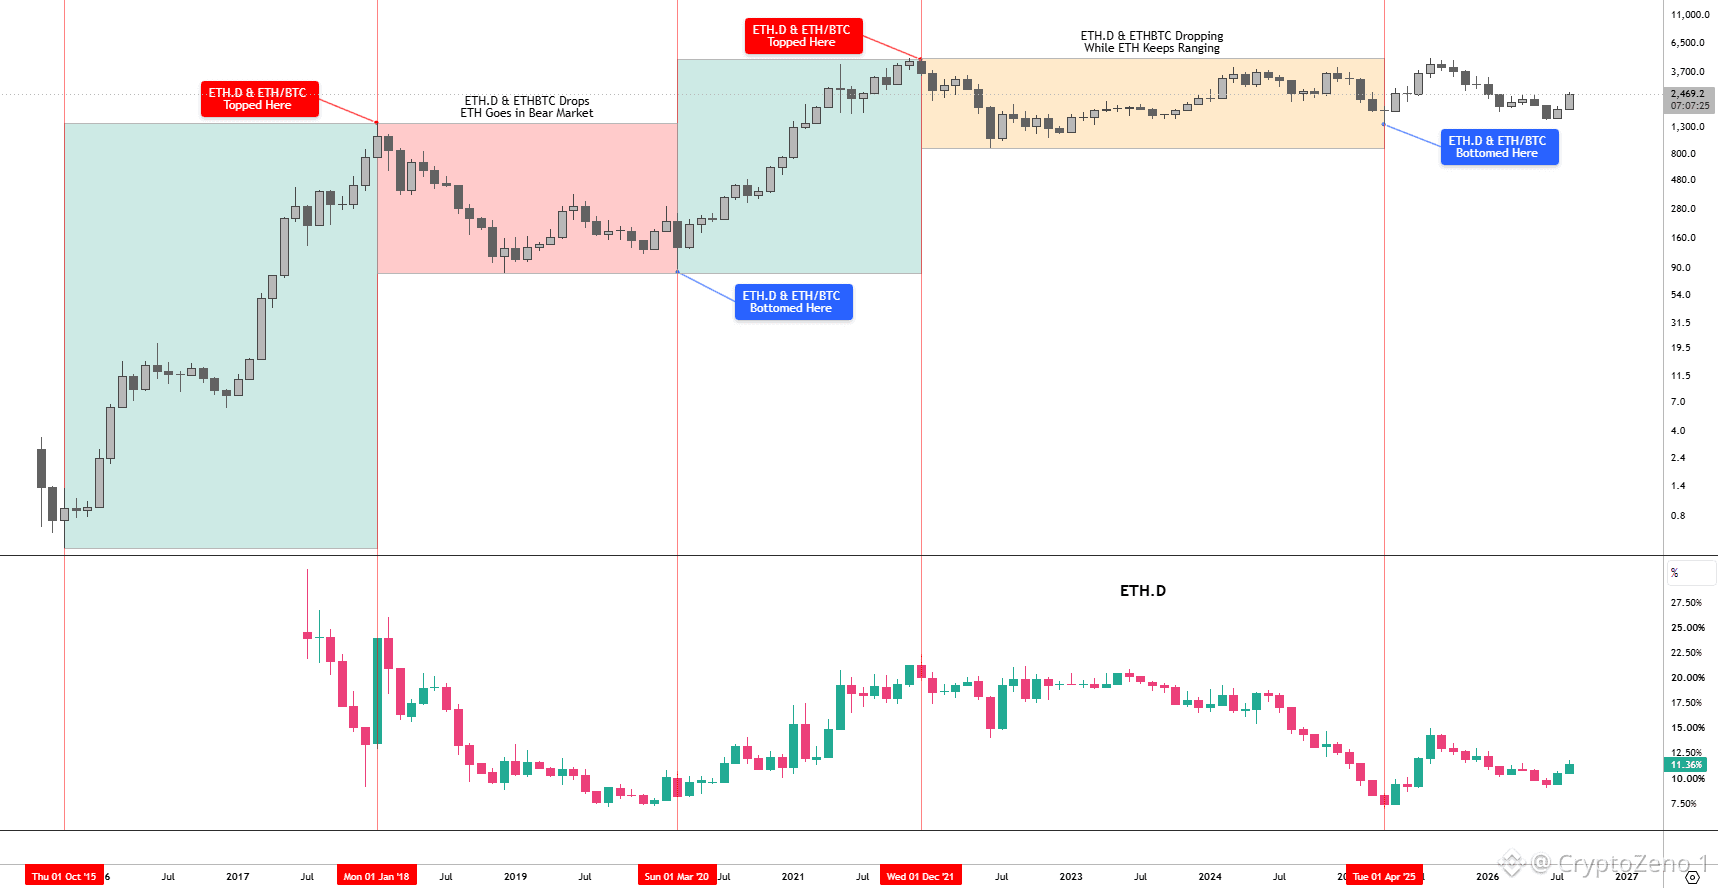
$ETH Underperformed Because ETH.D was Dying.
For the past 4-5 years, ETH.D remained trapped in a persistent downtrend, which was one of the main reasons ETH failed to perform the way it historically has.
But this Cycle's Structure is Different.
ETH.D found its bottom when ETH was trading in the 1300s back in April 2025.
Just 5 months later, ETH went parabolic and swept its previous ATH after 3.5 years.
And that was only a glimpse of what ETH is capable of when ETH.D starts expanding.
More importantly, during this Bear Market, both ETH and ETH.D have created Higher Lows after bottoming in April 2025.
That is a major structural shift and a clear indication that bullish momentum is returning to ETH.
If ETH.D continues gaining strength here, ETH reaching $5k-$7K this cycle is very realistic.
Because when the lows continue to hold, the market eventually starts reaching for the highs.
The stronger ETH.D gets, the more explosive ETH can become. #Macro Insights# #Altcoin Season# #ETH
For the past 4-5 years, ETH.D remained trapped in a persistent downtrend, which was one of the main reasons ETH failed to perform the way it historically has.
But this Cycle's Structure is Different.
ETH.D found its bottom when ETH was trading in the 1300s back in April 2025.
Just 5 months later, ETH went parabolic and swept its previous ATH after 3.5 years.
And that was only a glimpse of what ETH is capable of when ETH.D starts expanding.
More importantly, during this Bear Market, both ETH and ETH.D have created Higher Lows after bottoming in April 2025.
That is a major structural shift and a clear indication that bullish momentum is returning to ETH.
If ETH.D continues gaining strength here, ETH reaching $5k-$7K this cycle is very realistic.
Because when the lows continue to hold, the market eventually starts reaching for the highs.
The stronger ETH.D gets, the more explosive ETH can become. #Macro Insights# #Altcoin Season# #ETH
عرض الترجمة
$BTC
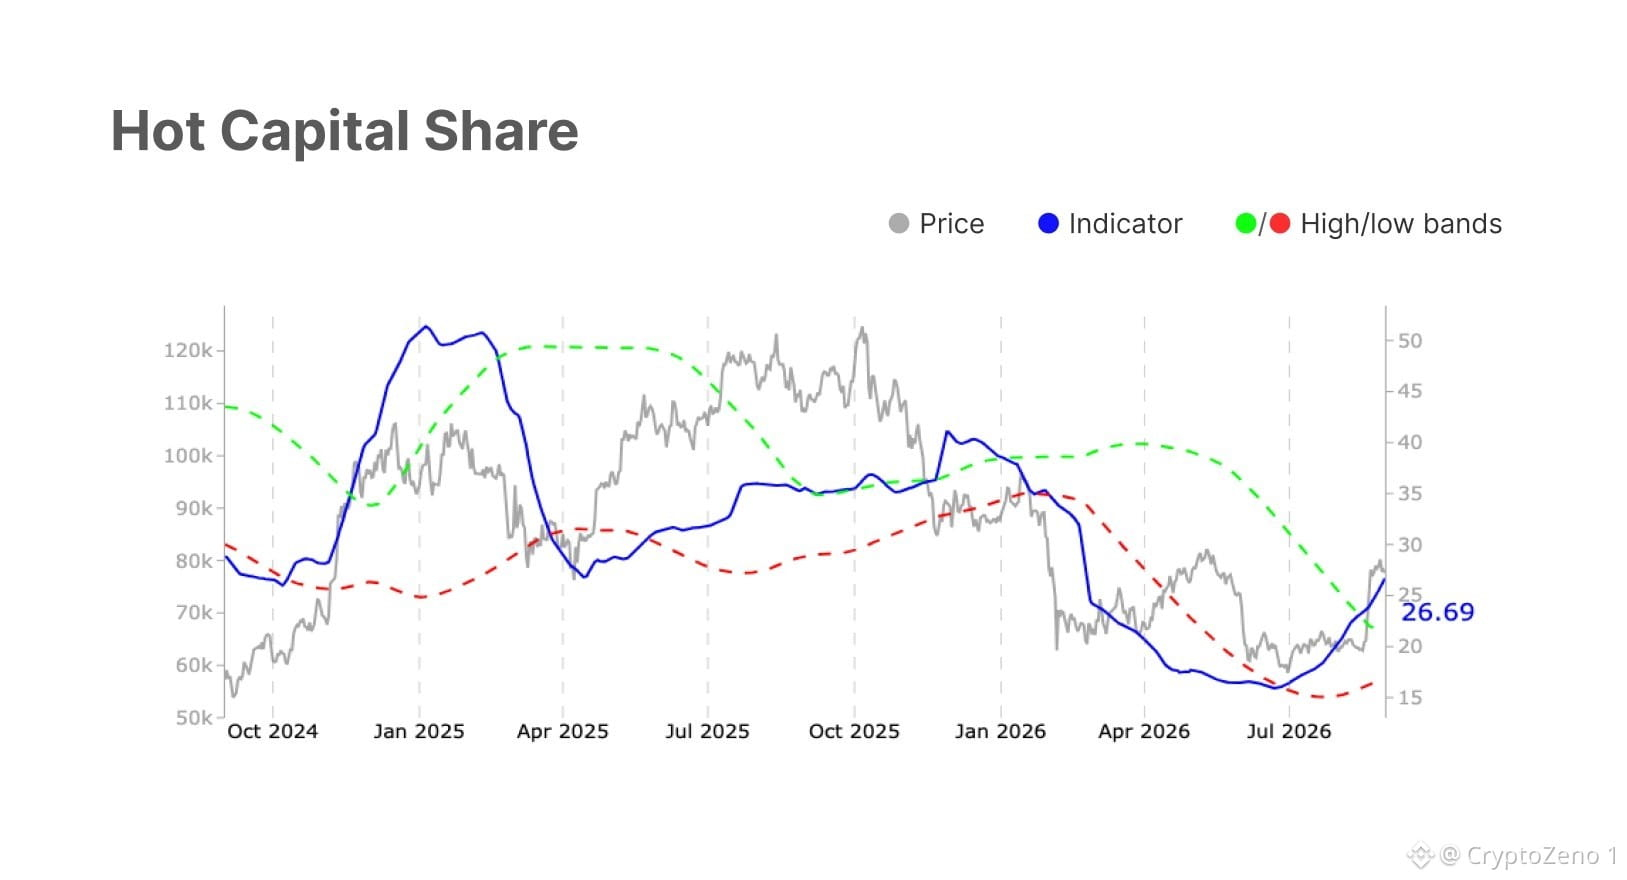
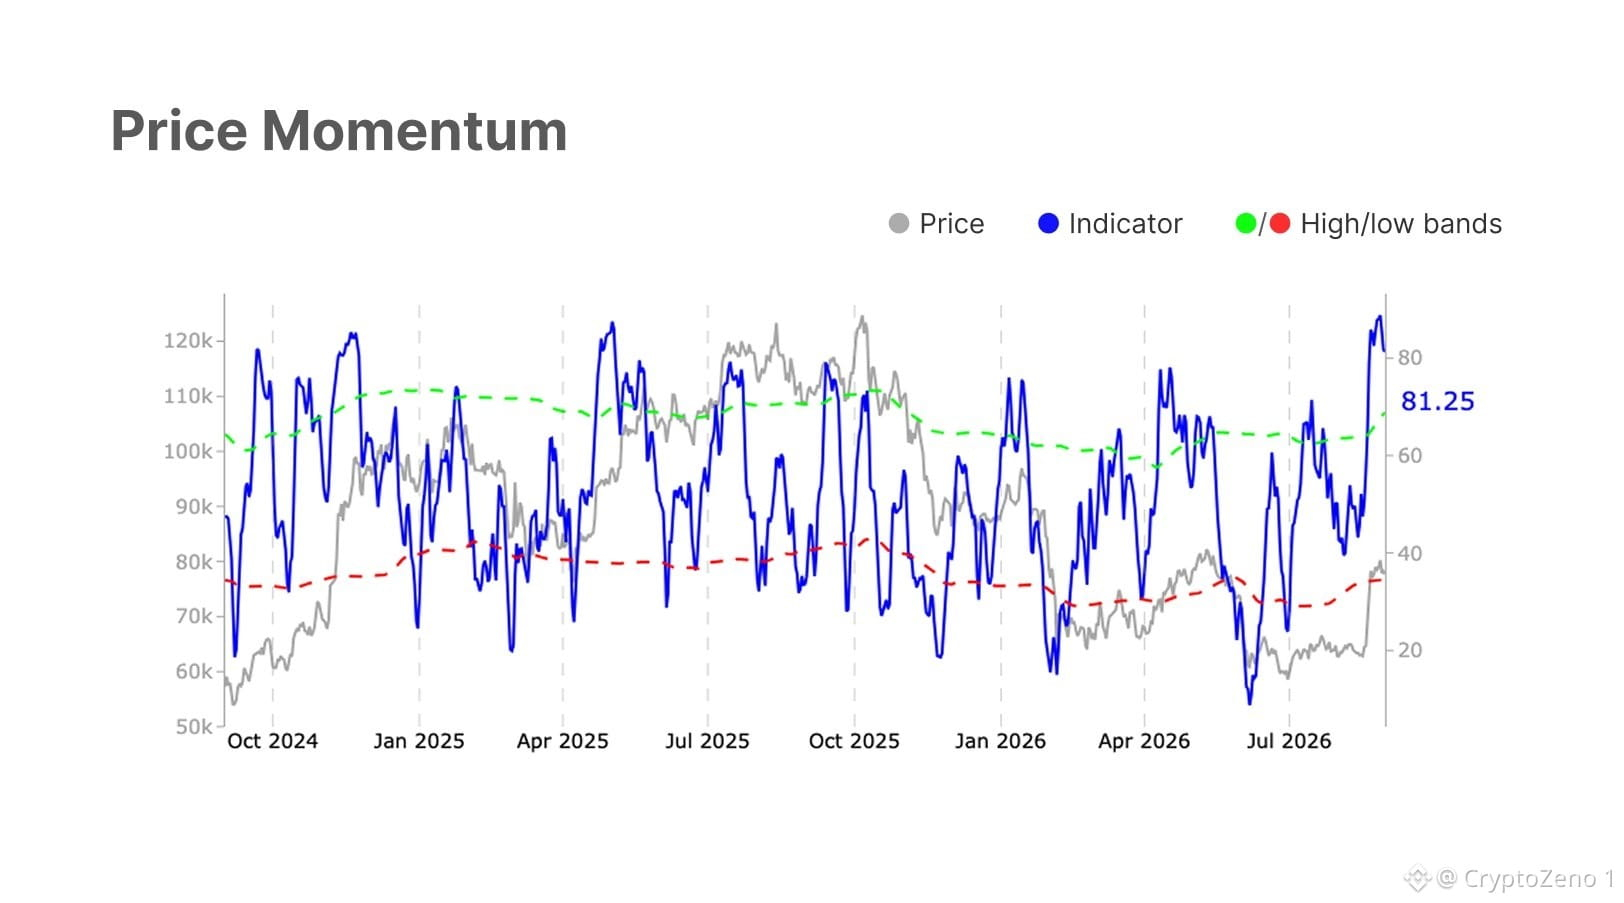
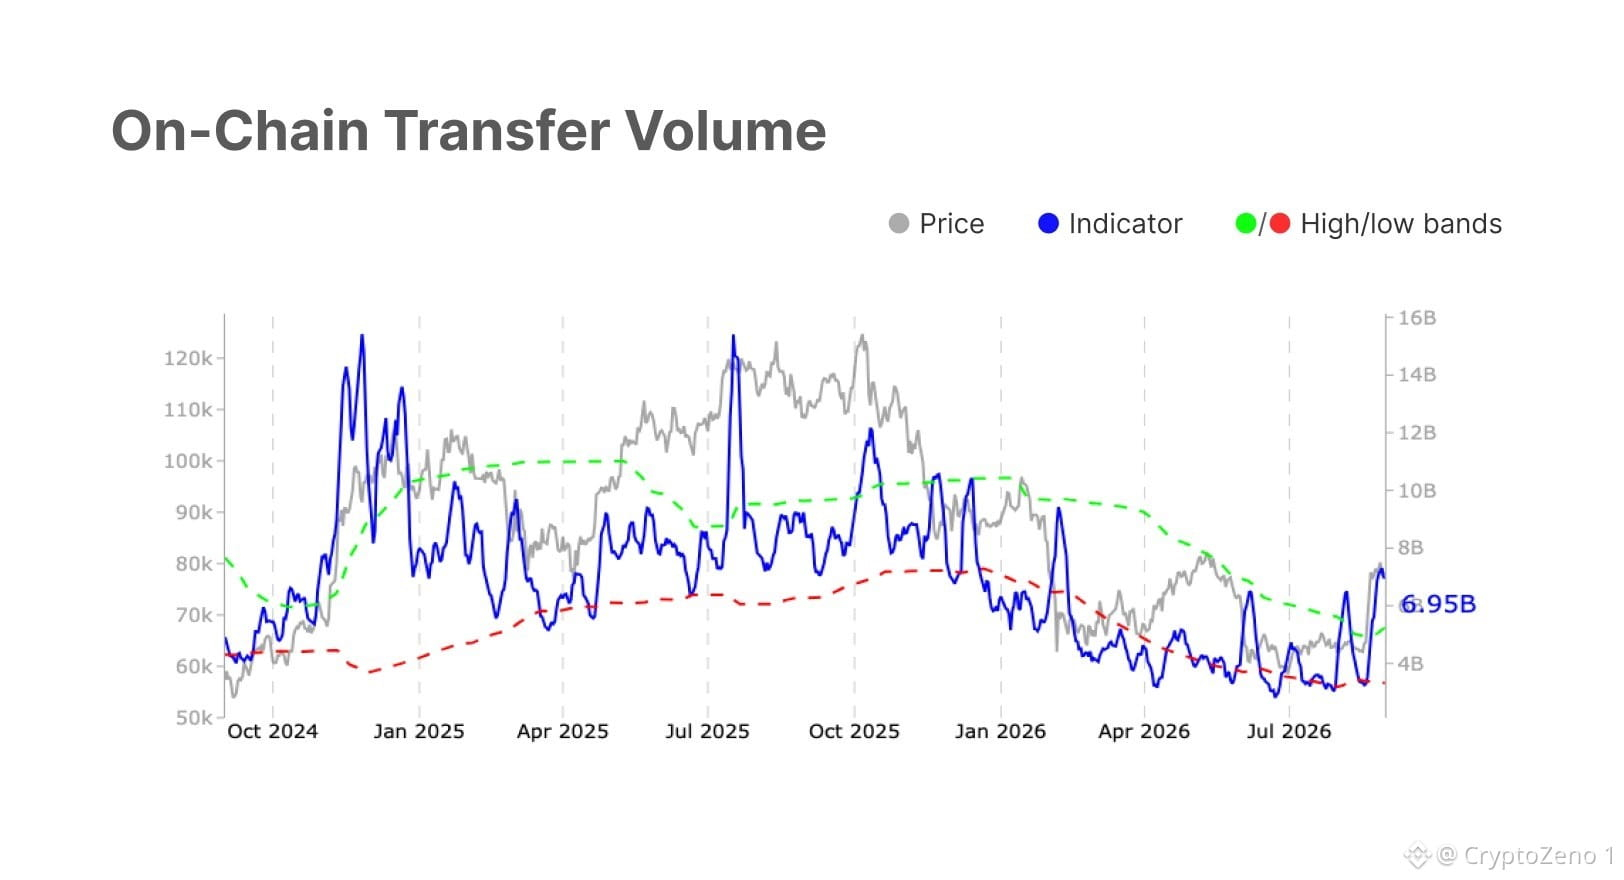
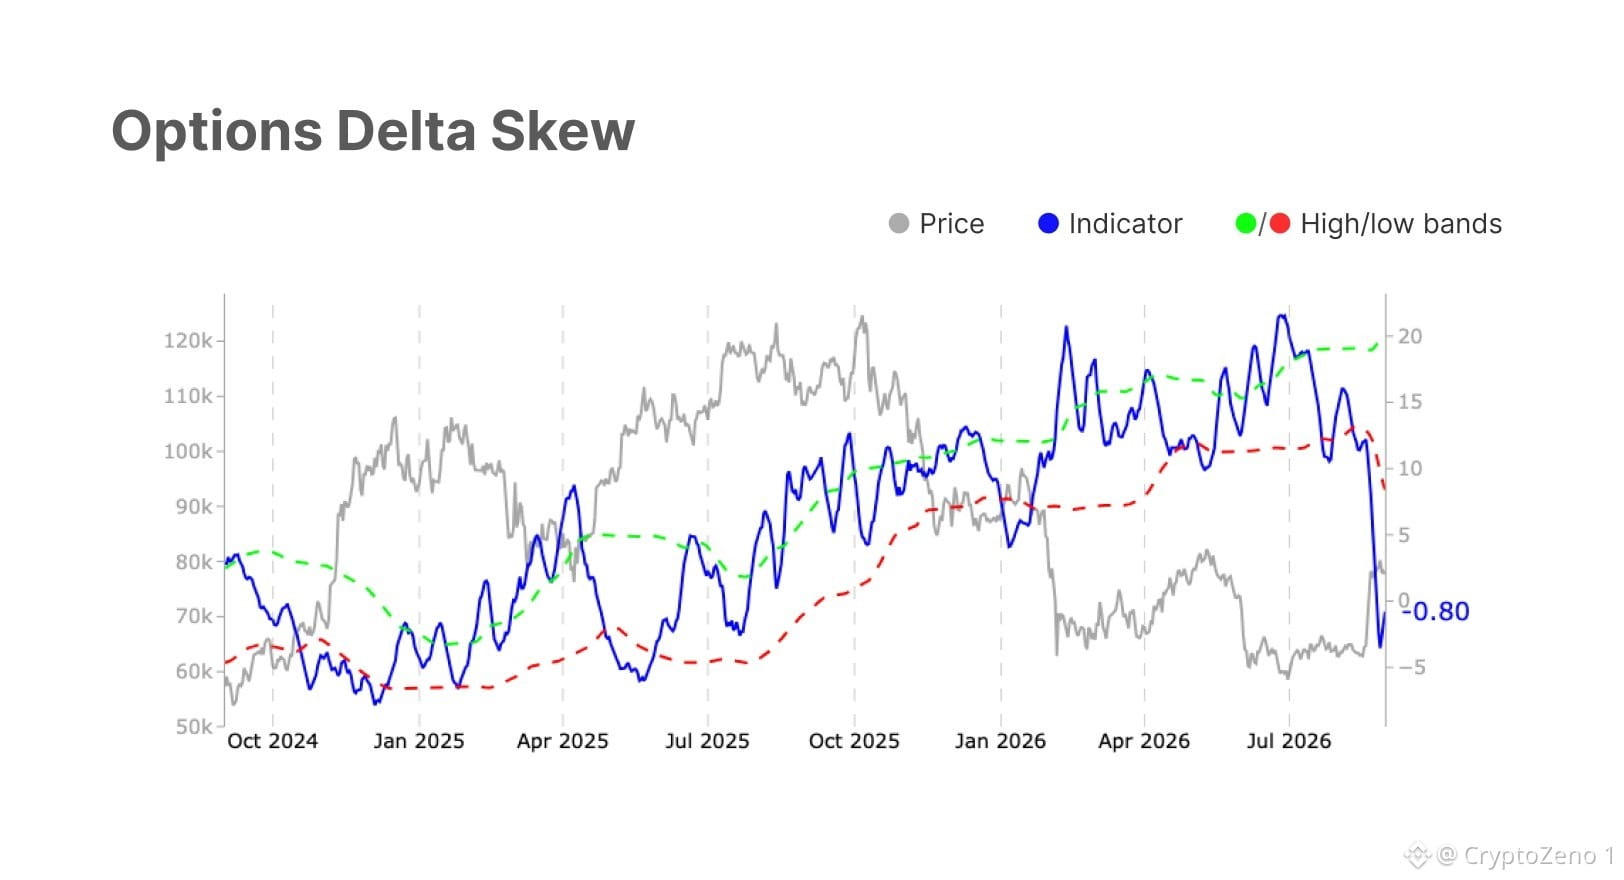
holds near $78,300 after rallying from $64k lows. Institutional inflows stay strong, but rising leverage, tight volatility spreads, and softening retail activity point to a cautious, transitional market. #BTC Price Analysis# #Macro Insights#
holds near $78,300 after rallying from $64k lows. Institutional inflows stay strong, but rising leverage, tight volatility spreads, and softening retail activity point to a cautious, transitional market. #BTC Price Analysis# #Macro Insights#
عرض الترجمة
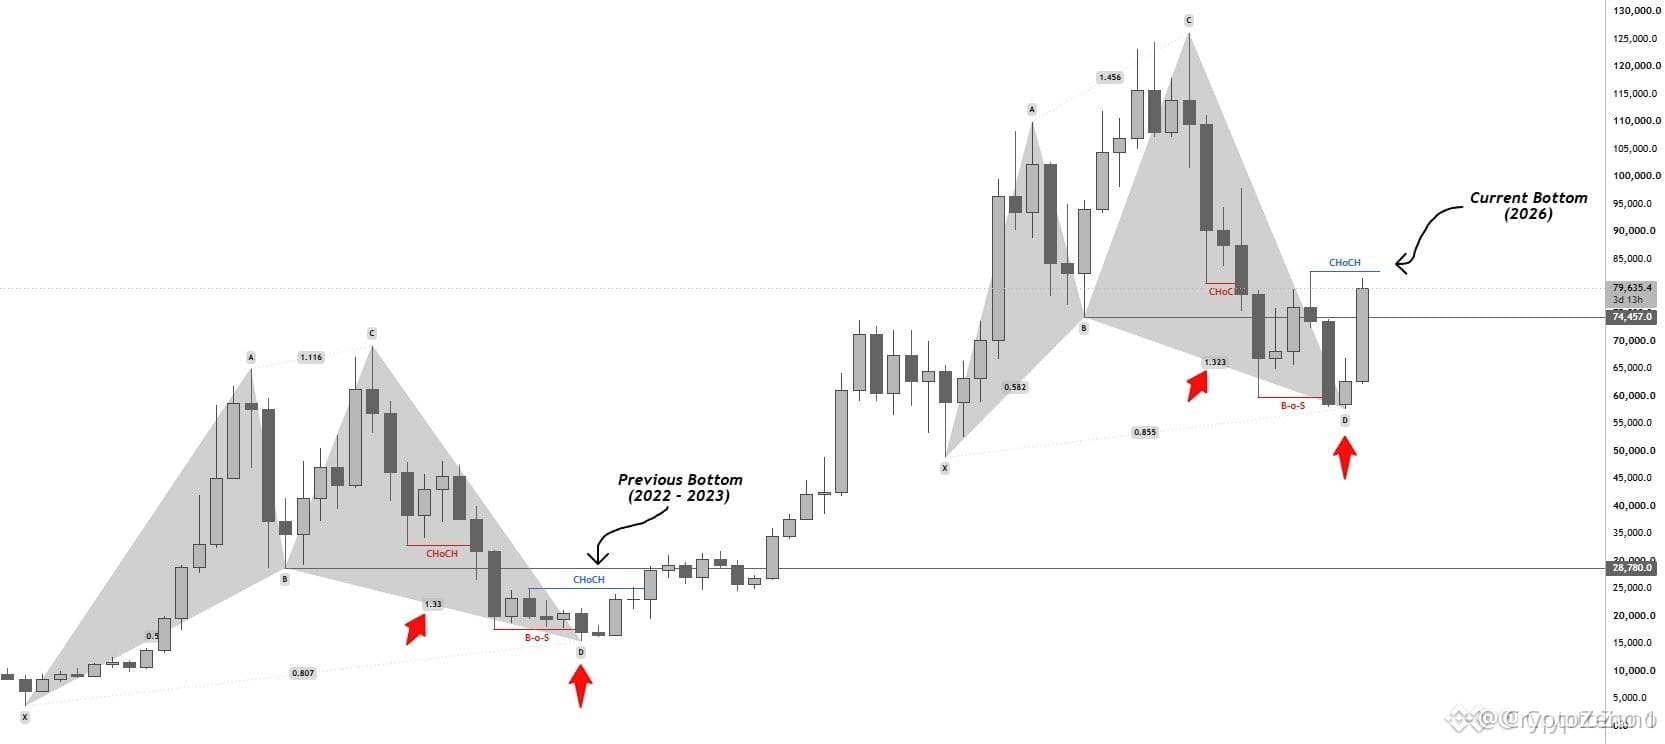
$BTC Same Structure. Same Bottom.
Yet people made the same mistake they’ve made EVERY. SINGLE. TIME we get a dip.
They waited for lower.
Suddenly, everyone had a new reason why Bitcoin was going to 54K.
Funny how that works. #BTC Price Analysis# #Macro Insights# #Altcoin Season#
Yet people made the same mistake they’ve made EVERY. SINGLE. TIME we get a dip.
They waited for lower.
Suddenly, everyone had a new reason why Bitcoin was going to 54K.
Funny how that works. #BTC Price Analysis# #Macro Insights# #Altcoin Season#
عرض الترجمة
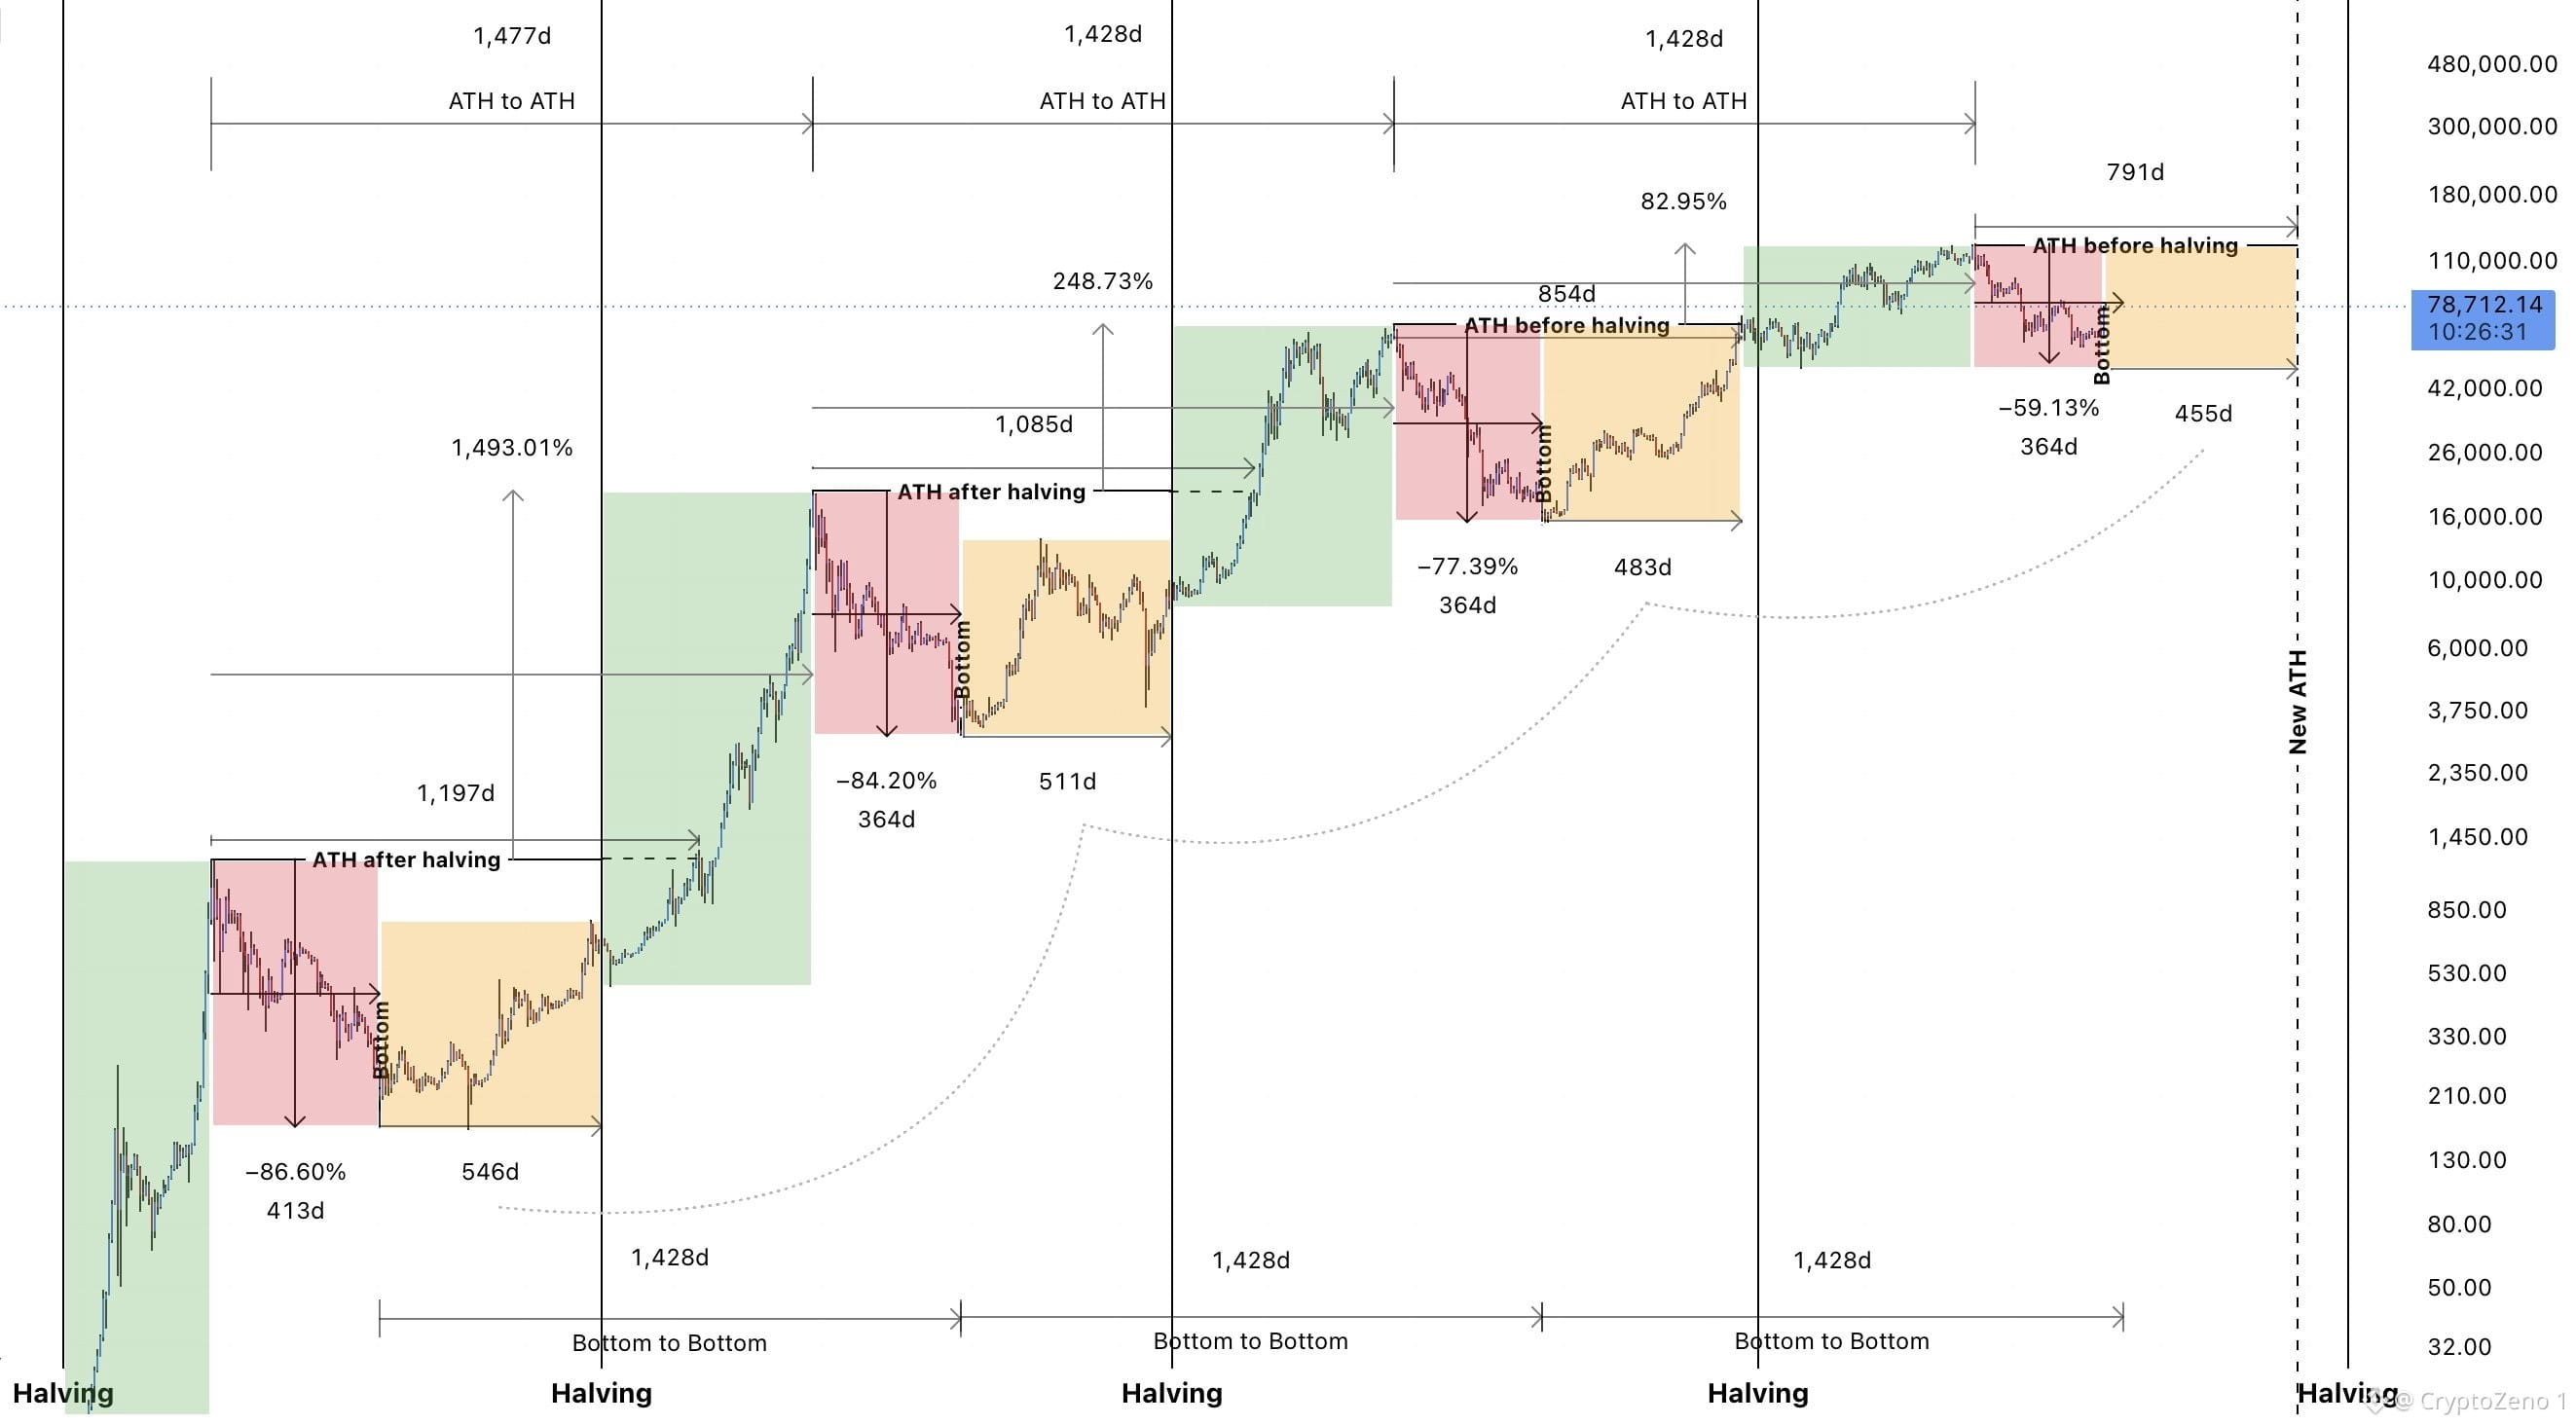
$BTC New ATH in around 455 days.
Q4 2027.⏳
The bear market bottom is in. Cycles will keep evolving and are progressing faster each time, making a new ATH before the halving very likely.
Price is now entering the orange phase, which has historically marked the start of the bull market and every dip should be bought.
Higher lows. Higher highs. Stop shorting. #BTC Price Analysis# #Macro Insights#
Q4 2027.⏳
The bear market bottom is in. Cycles will keep evolving and are progressing faster each time, making a new ATH before the halving very likely.
Price is now entering the orange phase, which has historically marked the start of the bull market and every dip should be bought.
Higher lows. Higher highs. Stop shorting. #BTC Price Analysis# #Macro Insights#
عرض الترجمة
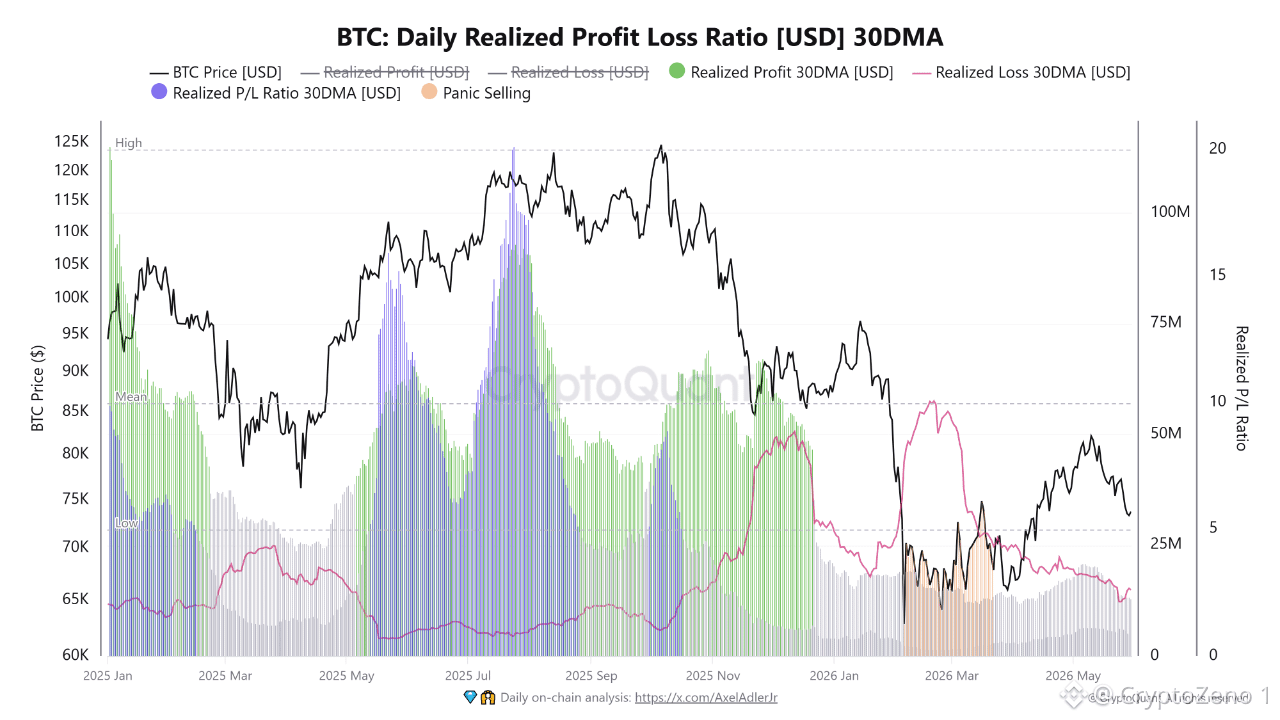
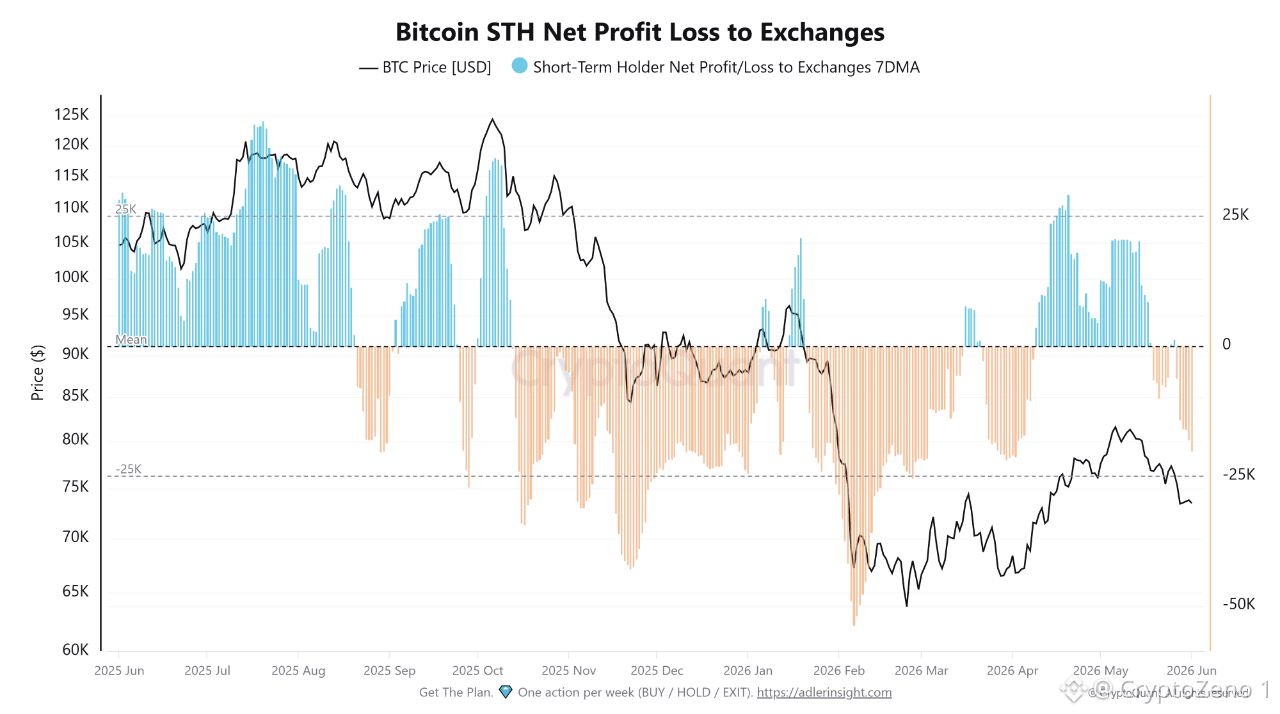
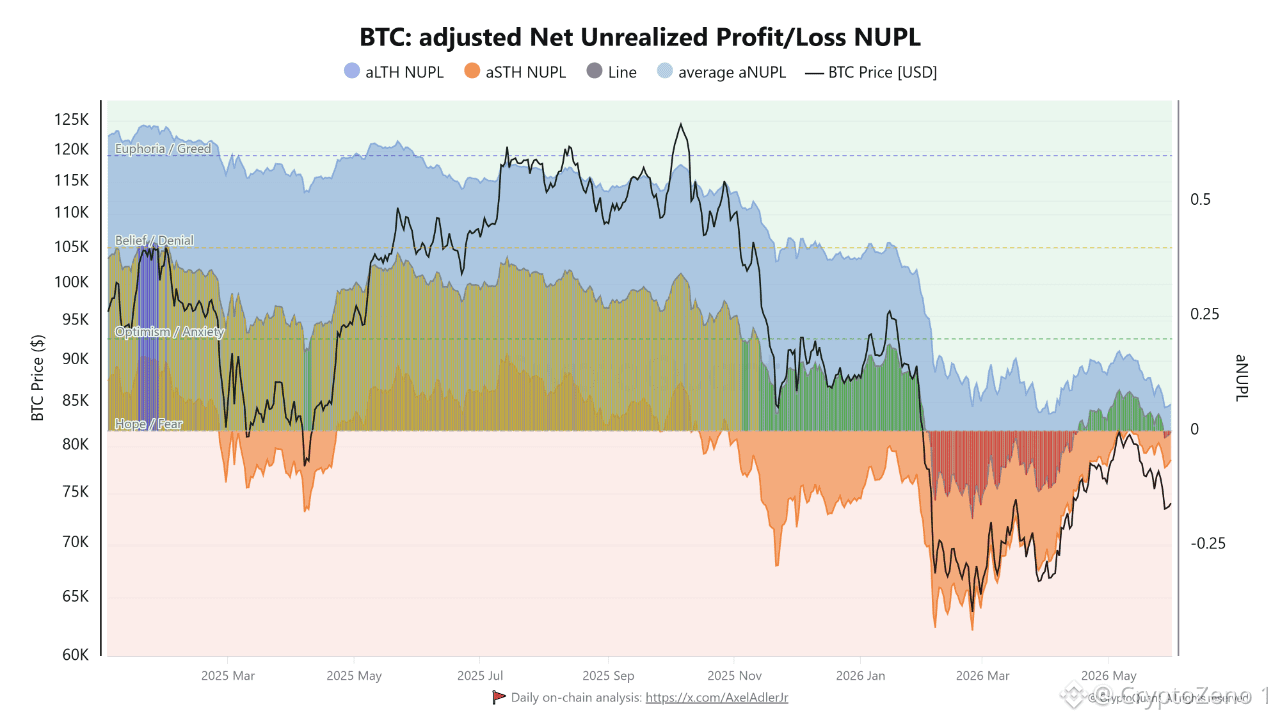
$BTC Faces a Silent Reset as Short-Term Holders Absorb Growing Losses Recent on-chain data suggests #Bitcoin is moving through a period of profit compression rather than outright capitulation. The Short-Term Holder Net Profit/Loss to Exchanges metric has returned to negative territory, indicating that many newer investors are realizing losses when transferring coins to exchanges. This reflects weakening confidence after the latest recovery attempt failed to establish a stronger uptrend. However, realized losses remain far below the extreme levels typically seen near major cycle bottoms. The Realized Profit/Loss Ratio (30DMA) tells a similar story. Realized losses continue to outweigh realized profits, showing that market participants are increasingly accepting losses instead of waiting for better exit opportunities. Yet the current structure differs from historical panic events. Rather than a sudden wave of forced selling, the data points to a gradual process of supply redistribution as weaker hands reduce exposure over time. Meanwhile, adjusted NUPL highlights the growing pressure on short-term holders. The aSTH NUPL remains below zero, placing recent buyers in an unrealized loss position. At the same time, broader network profitability has steadily declined from the optimistic conditions seen during the previous advance. This combination suggests sentiment has cooled significantly, even though the market has not yet reached the deep pessimism often associated with final capitulation phases. These indicators describe a market undergoing a healthy reset. Short-term holders are realizing losses, unrealized profits are shrinking, and speculative excess is being removed from the system. While on-chain conditions remain fragile, the data does not yet show the type of extreme stress that has historically marked definitive cycle lows. #BTC Price Analysis# #Macro Insights#
عرض الترجمة
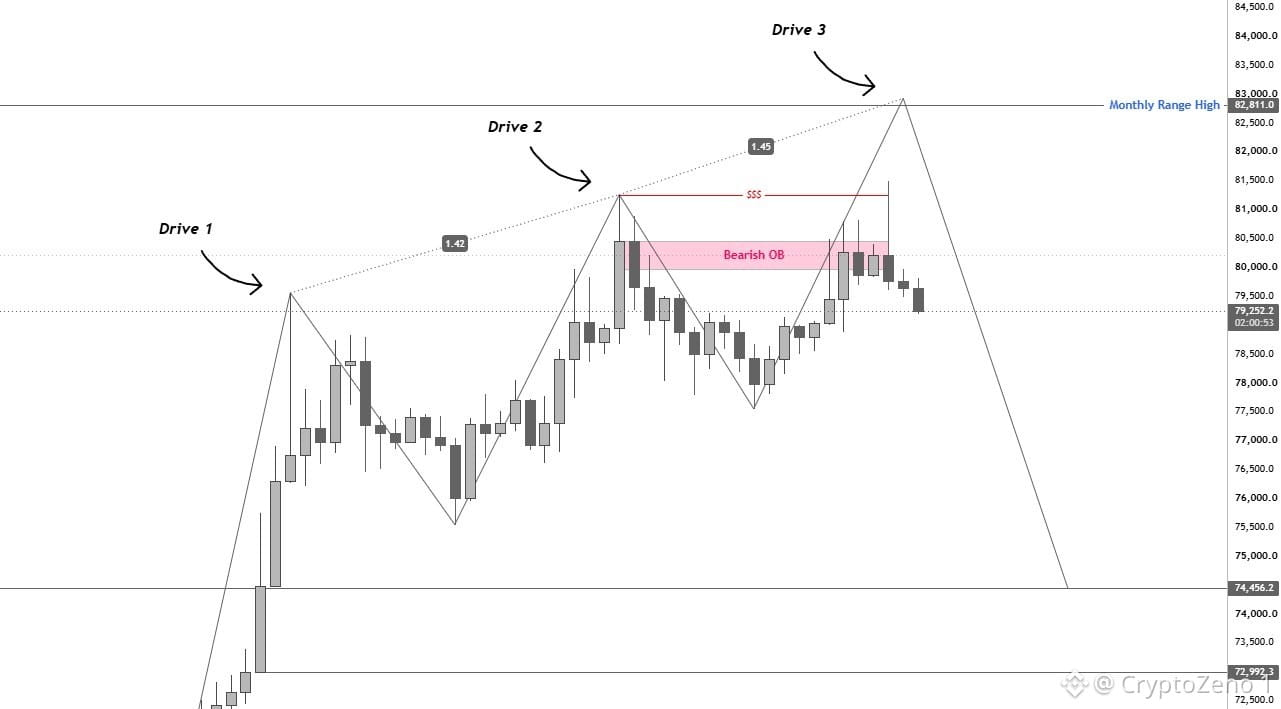
#$BTC is still unable to reclaim the Bearish OB on 4H.
Earlier today, we saw a sweep of the current highs followed by a pretty strong rejection, and now it seems like bears are starting to take control from here.
Front-running the liquidity at the Previous Monthly Range High (82.8K) wouldn’t be unusual either.
A lot of late longs will get trapped here, while the usual “sweep the highs and short” setups will end up getting front-ran.
I know everyone is expecting 82.8K to get swept before any meaningful downside and that’s exactly why I wouldn’t be surprised if the market does the opposite.
The POI to the downside remains the same.
Waiting for price to tap into that area so I can trigger a Short-Term Swing Long from there and add the remaining 30% into my Spot Bag.
Let the late longs provide the liquidity. #BTC Price Analysis# #Macro Insights#
Earlier today, we saw a sweep of the current highs followed by a pretty strong rejection, and now it seems like bears are starting to take control from here.
Front-running the liquidity at the Previous Monthly Range High (82.8K) wouldn’t be unusual either.
A lot of late longs will get trapped here, while the usual “sweep the highs and short” setups will end up getting front-ran.
I know everyone is expecting 82.8K to get swept before any meaningful downside and that’s exactly why I wouldn’t be surprised if the market does the opposite.
The POI to the downside remains the same.
Waiting for price to tap into that area so I can trigger a Short-Term Swing Long from there and add the remaining 30% into my Spot Bag.
Let the late longs provide the liquidity. #BTC Price Analysis# #Macro Insights#
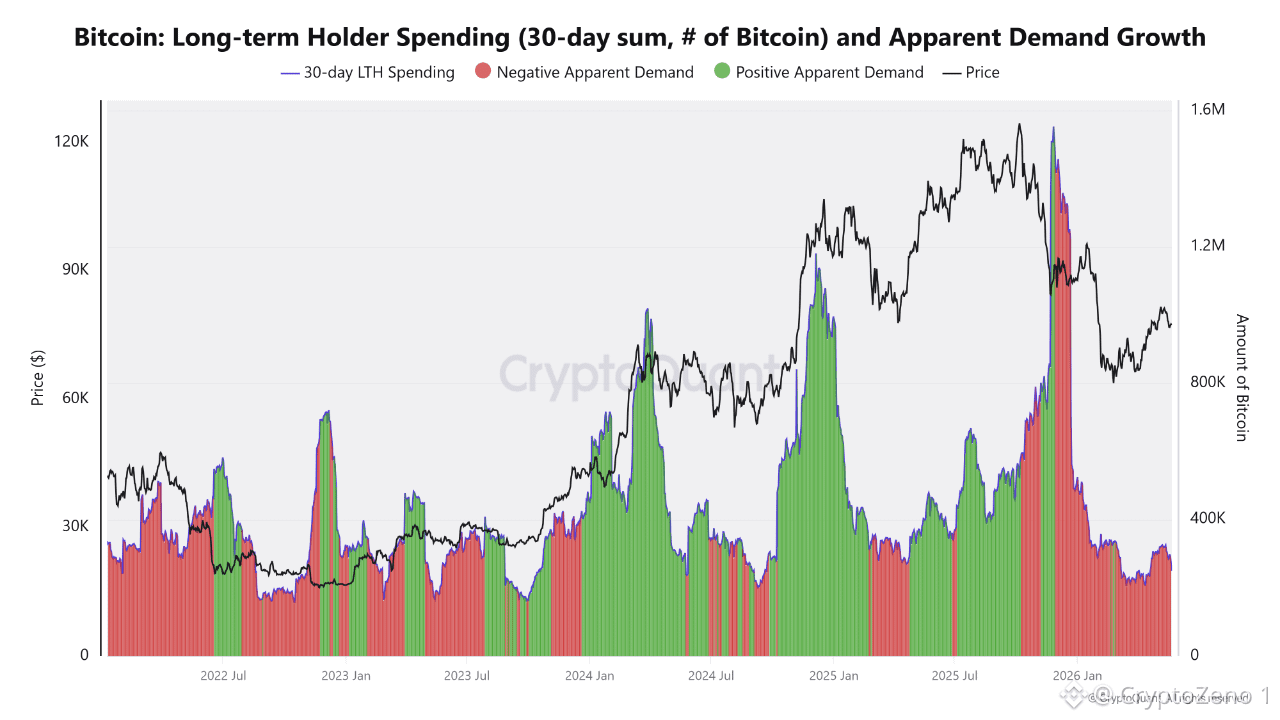
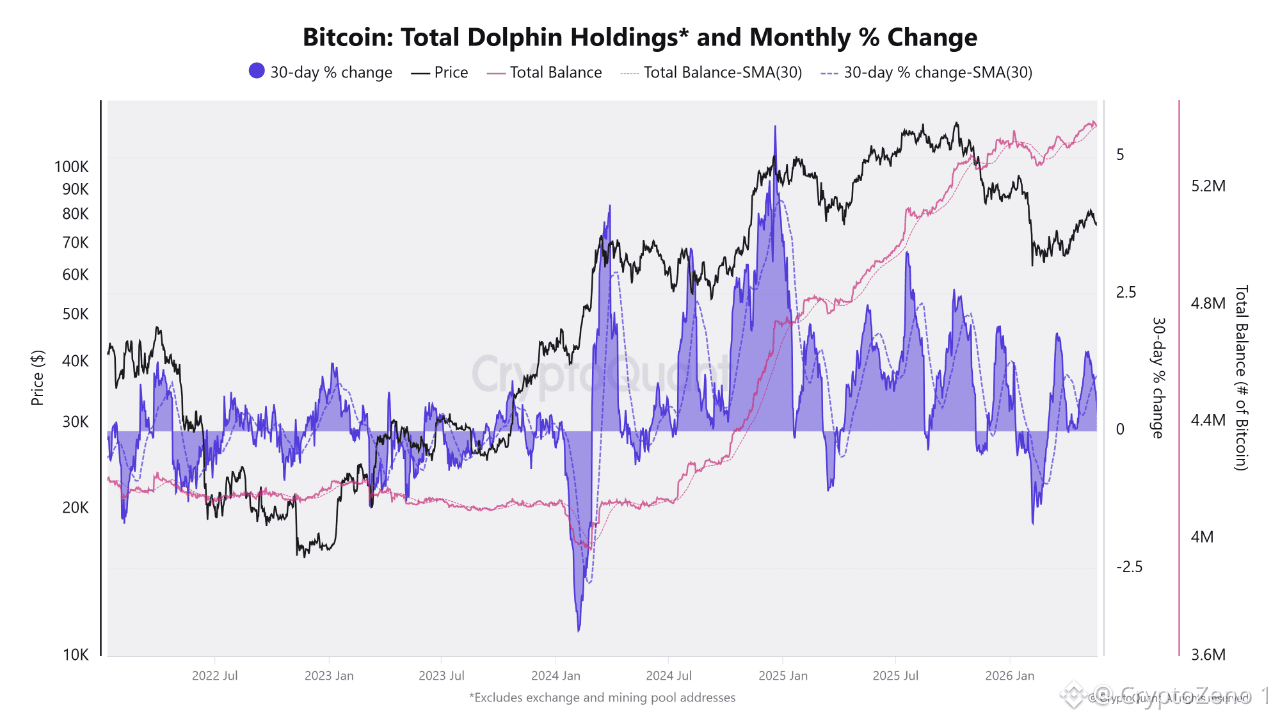
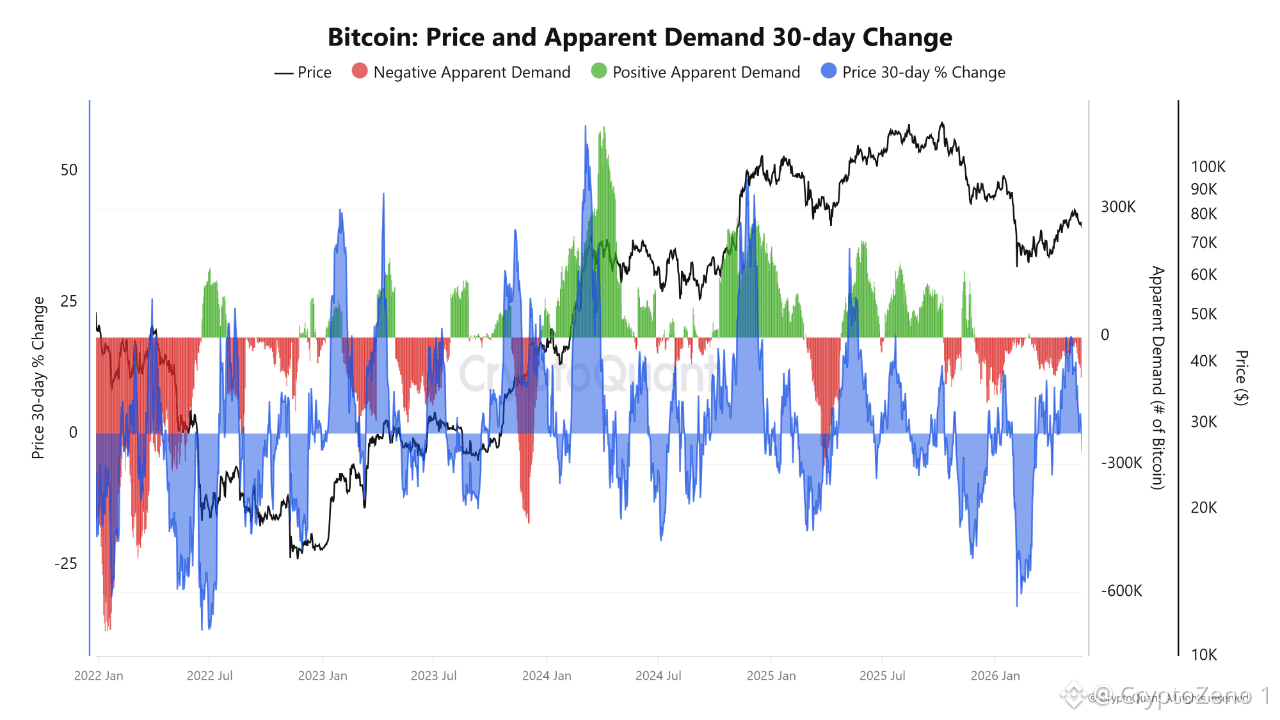
#بتكوين التصحيح الحالي يحدث بينما الطلب يواصل الانهيار ما يزال $BTC يتداول داخل هيكل تصحيح أوسع، وتشير أحدث بيانات السلسلة إلى أن الضعف لم يعد ناتجًا فقط عن حركة السعر. يبقى الطلب الظاهر ضعيفًا بشكل عميق بينما يكافح السوق لإعادة بناء الزخم بعد الرفض الأخير. يخلق ذلك سيناريو خطيرًا حيث يحاول السعر الاستقرار، لكن تدفقات رأس المال الداخلة لا تدعم قوة التعافي. أحد أكبر التحولات يحدث في سلوك المحافظ. لا تزال محافظ دولفين التي تحمل بين 100 و1K BTC تحافظ على أرصدة مرتفعة تاريخيًا، لكن زخم التراكم تراجع بشكل حاد مقارنةً بالأشهر السابقة. لم يعد كبار الحائزين يتوسعون في مراكزهم بشكل هجومي خلال فترات الهبوط كما كان يحدث. غالبًا ما يظهر هذا التحول خلال مراحل التماسك في أواخر الدورة حيث تبقى الثقة قائمة، لكن تتراجع القناعة. في الوقت نفسه، بدأ إنفاق حاملي المدى الطويل يرتفع مرة أخرى بينما تواصل تدهور ظروف الطلب. عادةً ما تضيف العملات الأقدم التي تدخل التداول أثناء فترات الطلب الظاهر السلبية ضغطًا هيكليًا على السوق، لأن المشترين الجدد لا يمتصون المعروض بسرعة كافية. غالبًا ما أدت ظروف مشابهة في الدورات السابقة إلى تصحيحات متعثرة ومطوّلة بدل استمرار اختراق فوري. ما يجعل البيئة الحالية صعبة هو أن حالة الذعر لم تصل بالكامل بعد، ومع ذلك فإن التعافي العضوي للطلب أيضًا غير موجود. باتت بتكوين الآن عالقة بين تباطؤ التراكم، وارتفاع حركة العملات القديمة، وضعف تدفقات رأس المال عبر الشبكة. وحتى تبدأ قوة الطلب في التعافي بشكل ملحوظ مجددًا، قد لا يكتمل التصحيح حتى لو كانت ارتدادات السعر على المدى القصير ما زالت تظهر. #تحليل سعر BTC# #رؤى ماكرو#
عرض الترجمة
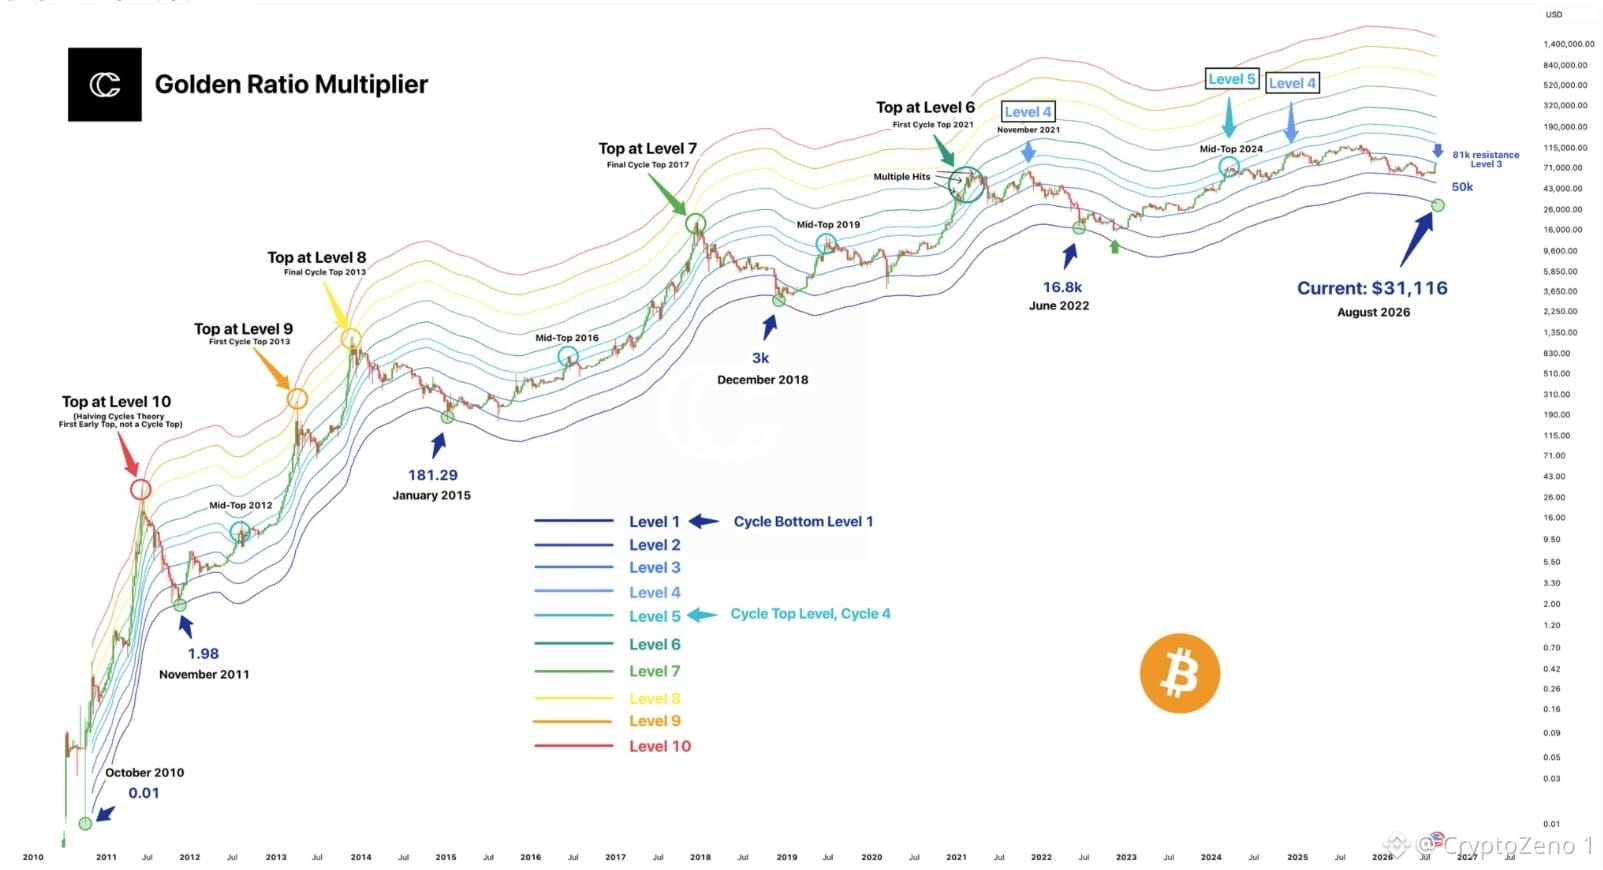
🚨 $BTC Golden Ratio Model Is Flashing A Major Cycle Warning #Bitcoin is now sitting near $31.1K, dramatically below the historical Golden Ratio Multiplier bands that previously marked major cycle tops. The key structural change is the progressive compression of cycle peaks from Level 9 in 2013 → Level 7 in 2017 → Level 6 in 2021, suggesting diminishing upside multiples as market capitalization expands. The critical zone now sits around $50K to $81K. A sustained recovery above $50K would reclaim an important Fibonacci based region, while a move through $81K could signal that BTC is rebuilding momentum toward the higher multiplier bands. Until then, the chart suggests the market remains in a deep structural reset rather than a confirmed new expansion phase. What makes this setup dangerous is the gap between historical cycle behavior and current price action. If the model continues to hold, BTC could be forming another long accumulation phase before the next major expansion. Watch $50K first. Then $81K. The real confirmation comes only after BTC starts reclaiming the multiplier structure above it. #BTC Price Analysis# #Macro Insights#
عرض الترجمة
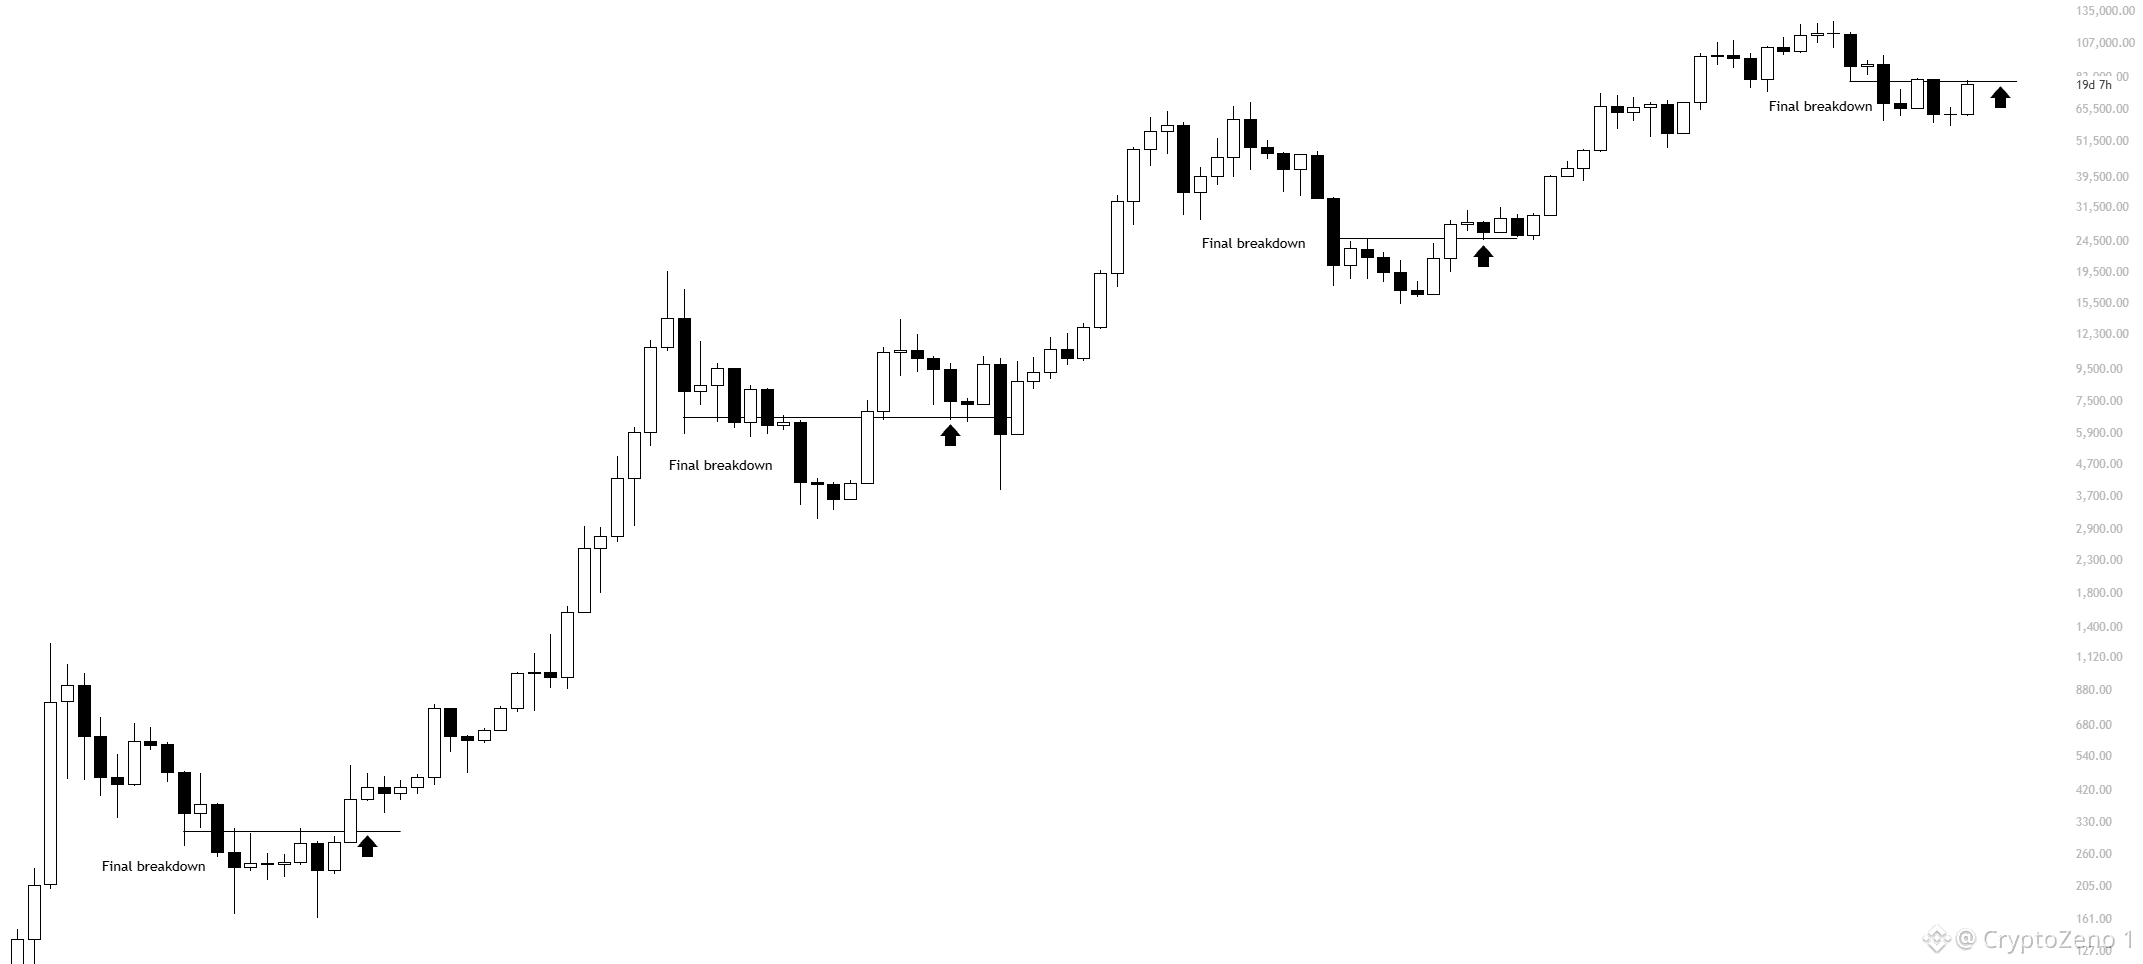
If $BTC accepts above the $83K range, the trend has significantly shifted from a TA perspective.
Right now, technically speaking, the trend has not shifted yet because we haven’t reclaimed and flipped the $83K high on the weekly.
I’m ~80% confident the bottom is already in, but if we’re looking strictly at technical confirmation, 83K is the level that needs to break and hold for a meaningful trend shift.
This analysis is based on the HTF structure.
So when we do reclaim 83K, be careful about blindly shorting the move higher. There’s a very real possibility that doing so gets you squeezed aggressively into the mid-90Ks.
I expect some chop for now, but keep this in mind. #BTC Price Analysis# #Macro Insights#
Right now, technically speaking, the trend has not shifted yet because we haven’t reclaimed and flipped the $83K high on the weekly.
I’m ~80% confident the bottom is already in, but if we’re looking strictly at technical confirmation, 83K is the level that needs to break and hold for a meaningful trend shift.
This analysis is based on the HTF structure.
So when we do reclaim 83K, be careful about blindly shorting the move higher. There’s a very real possibility that doing so gets you squeezed aggressively into the mid-90Ks.
I expect some chop for now, but keep this in mind. #BTC Price Analysis# #Macro Insights#
عرض الترجمة
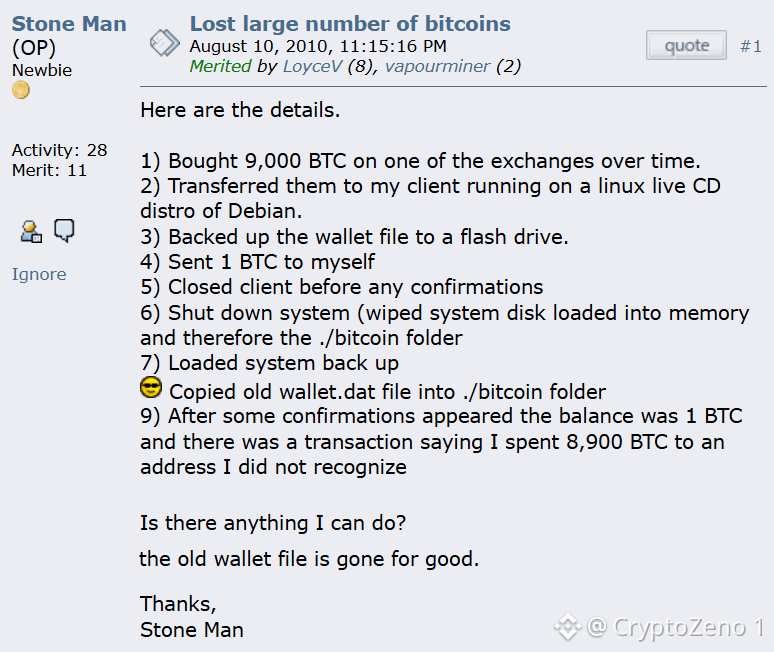
TRAGIC: 16 years ago, 'Stone Man' formatted his hard drive and lost 9,000 #Bitcoins 🤯
$BTC remain frozen there, worth $700M.
Pour one out for a legend! #BTC Price Analysis# #Macro Insights#
$BTC remain frozen there, worth $700M.
Pour one out for a legend! #BTC Price Analysis# #Macro Insights#

عرض الترجمة
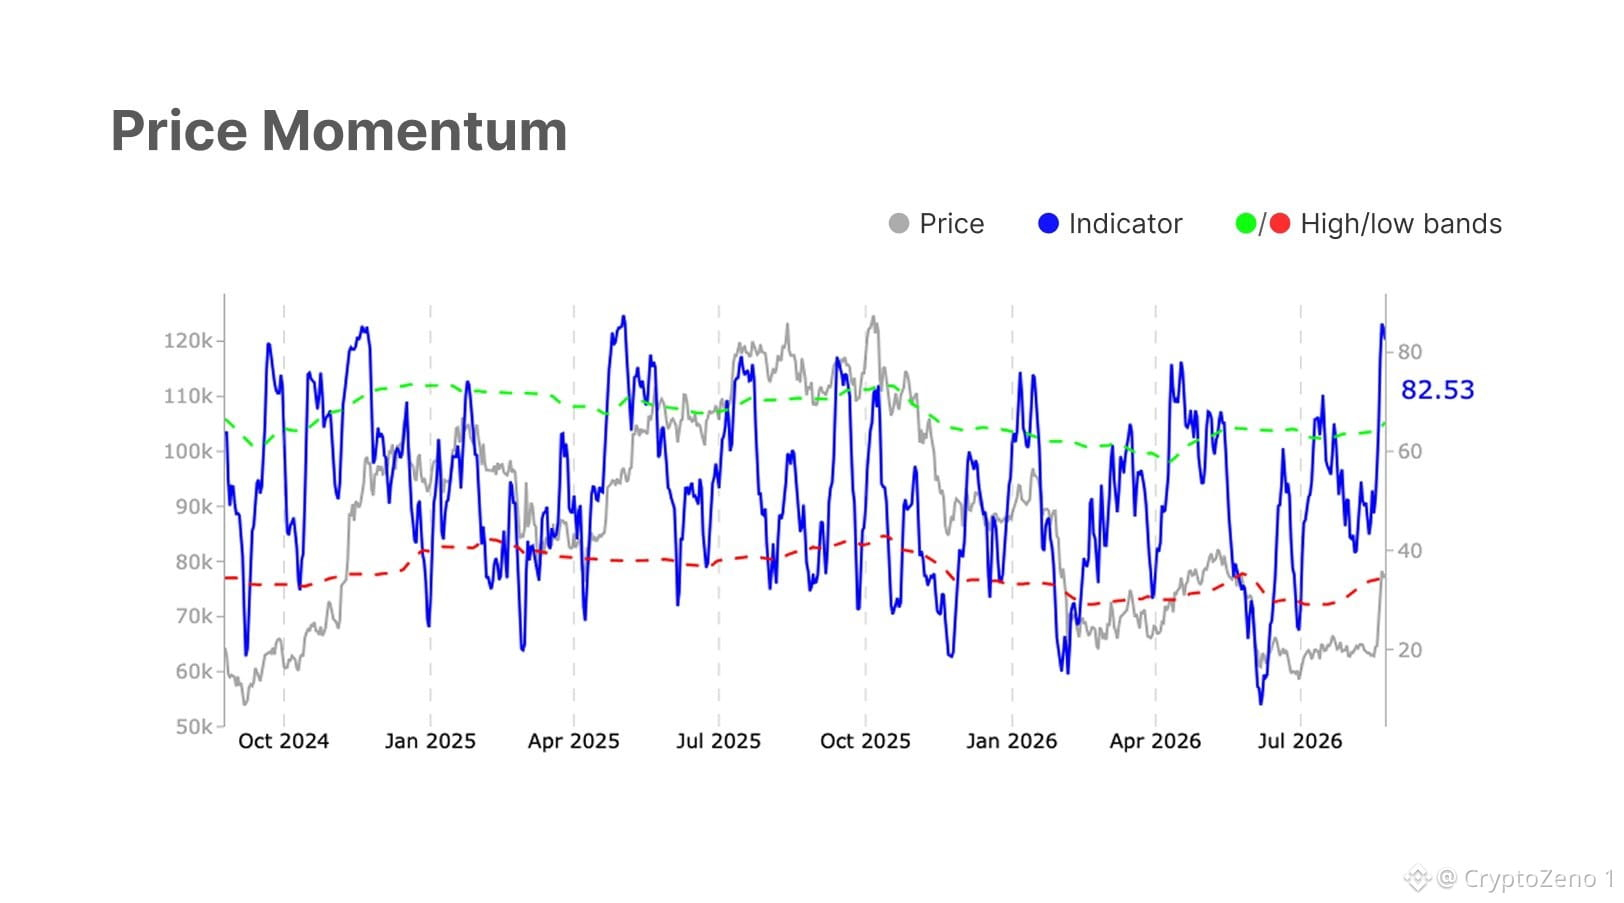
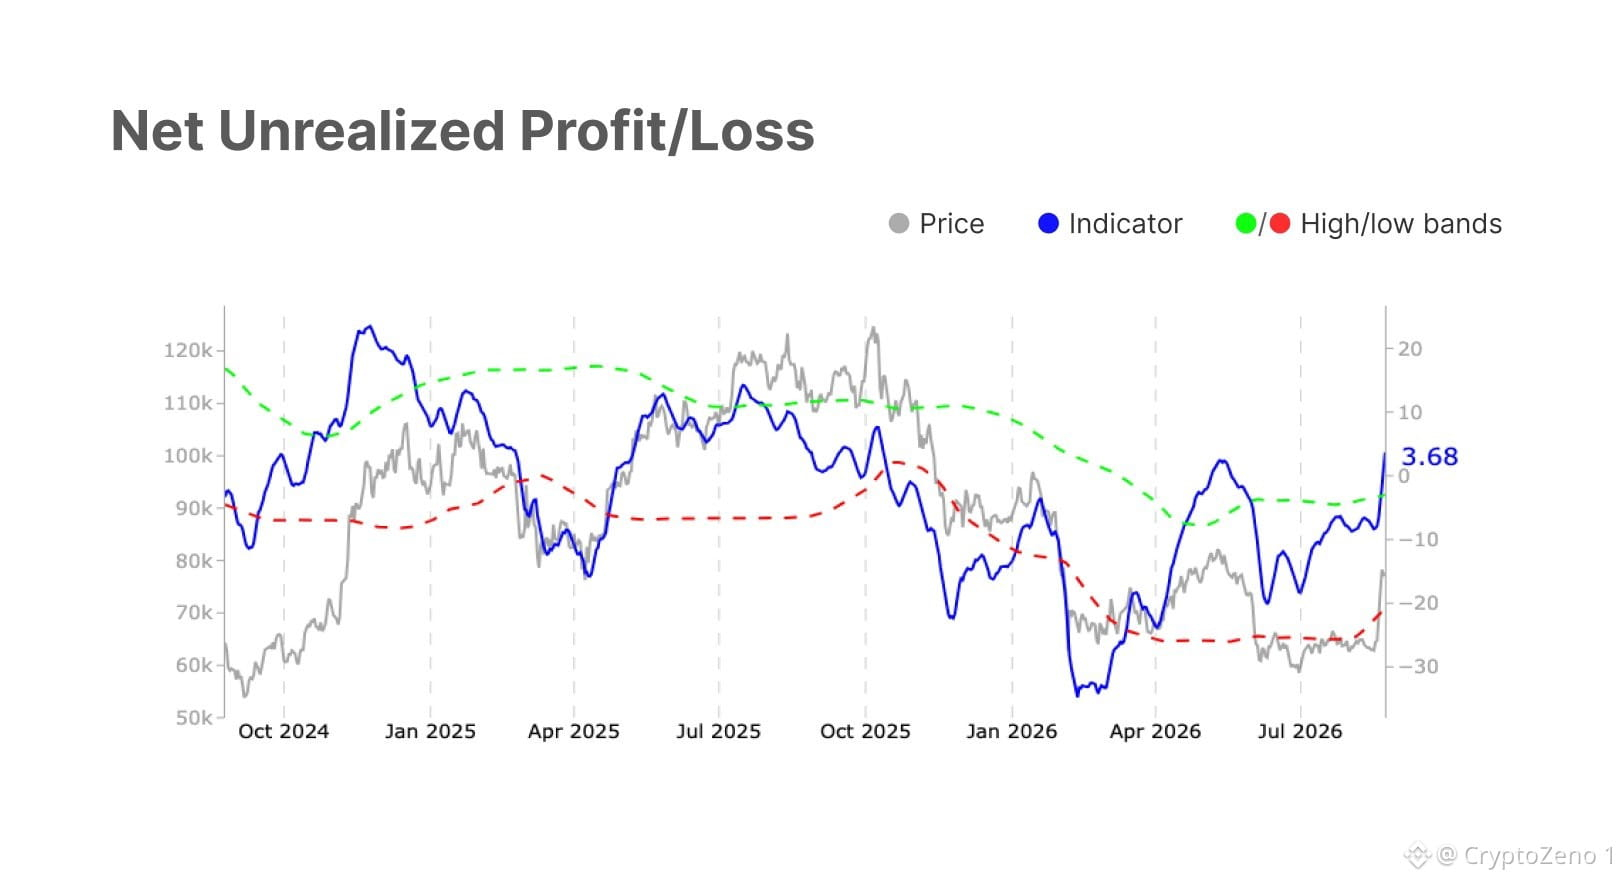
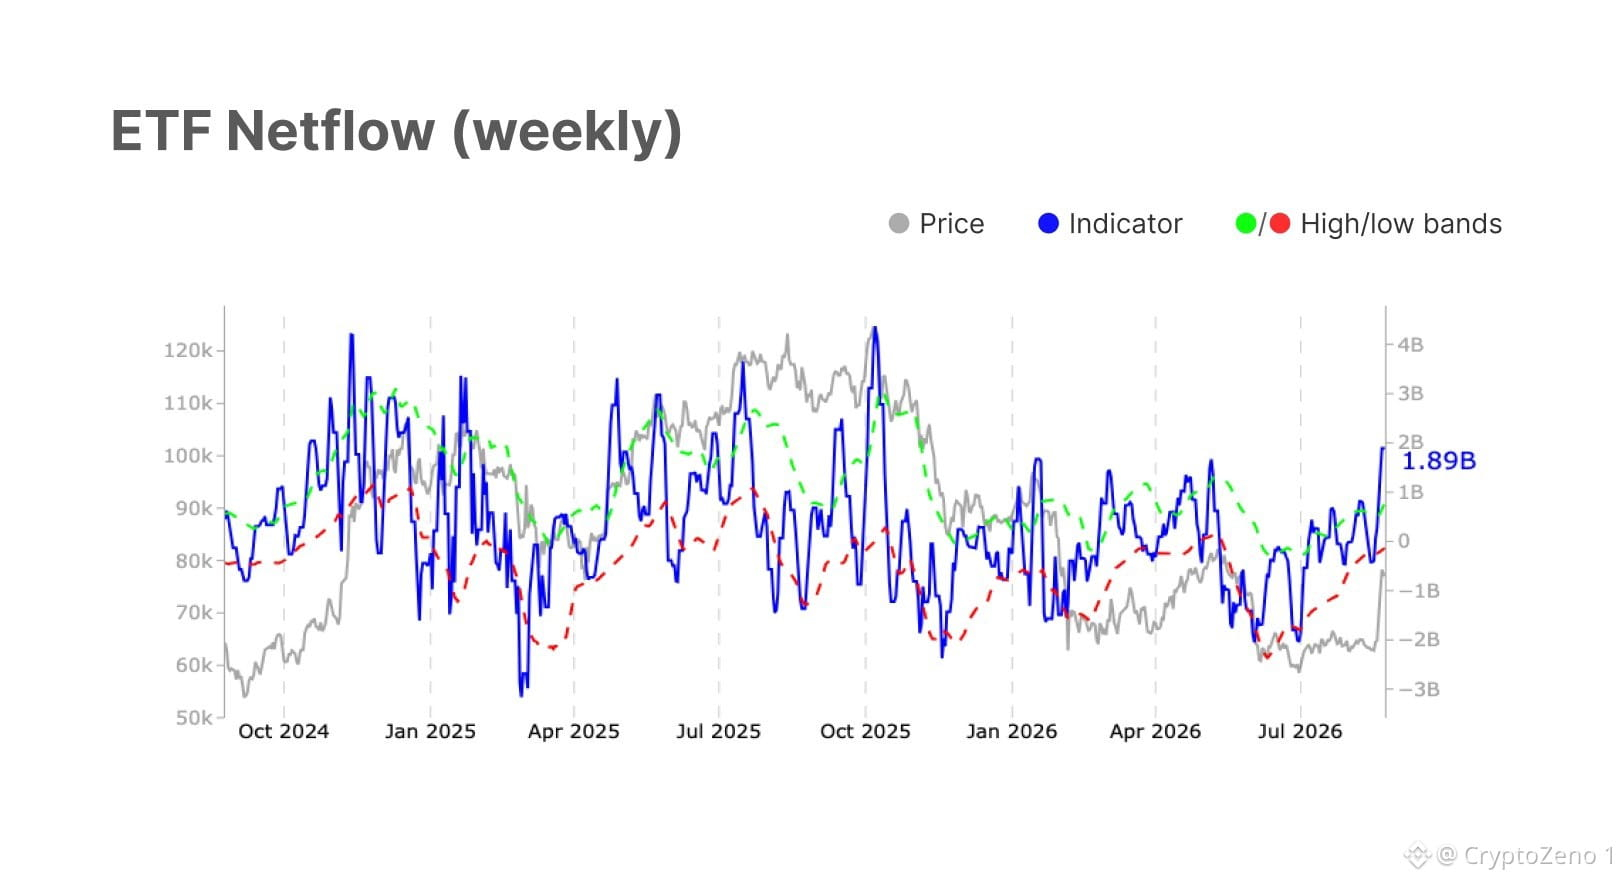
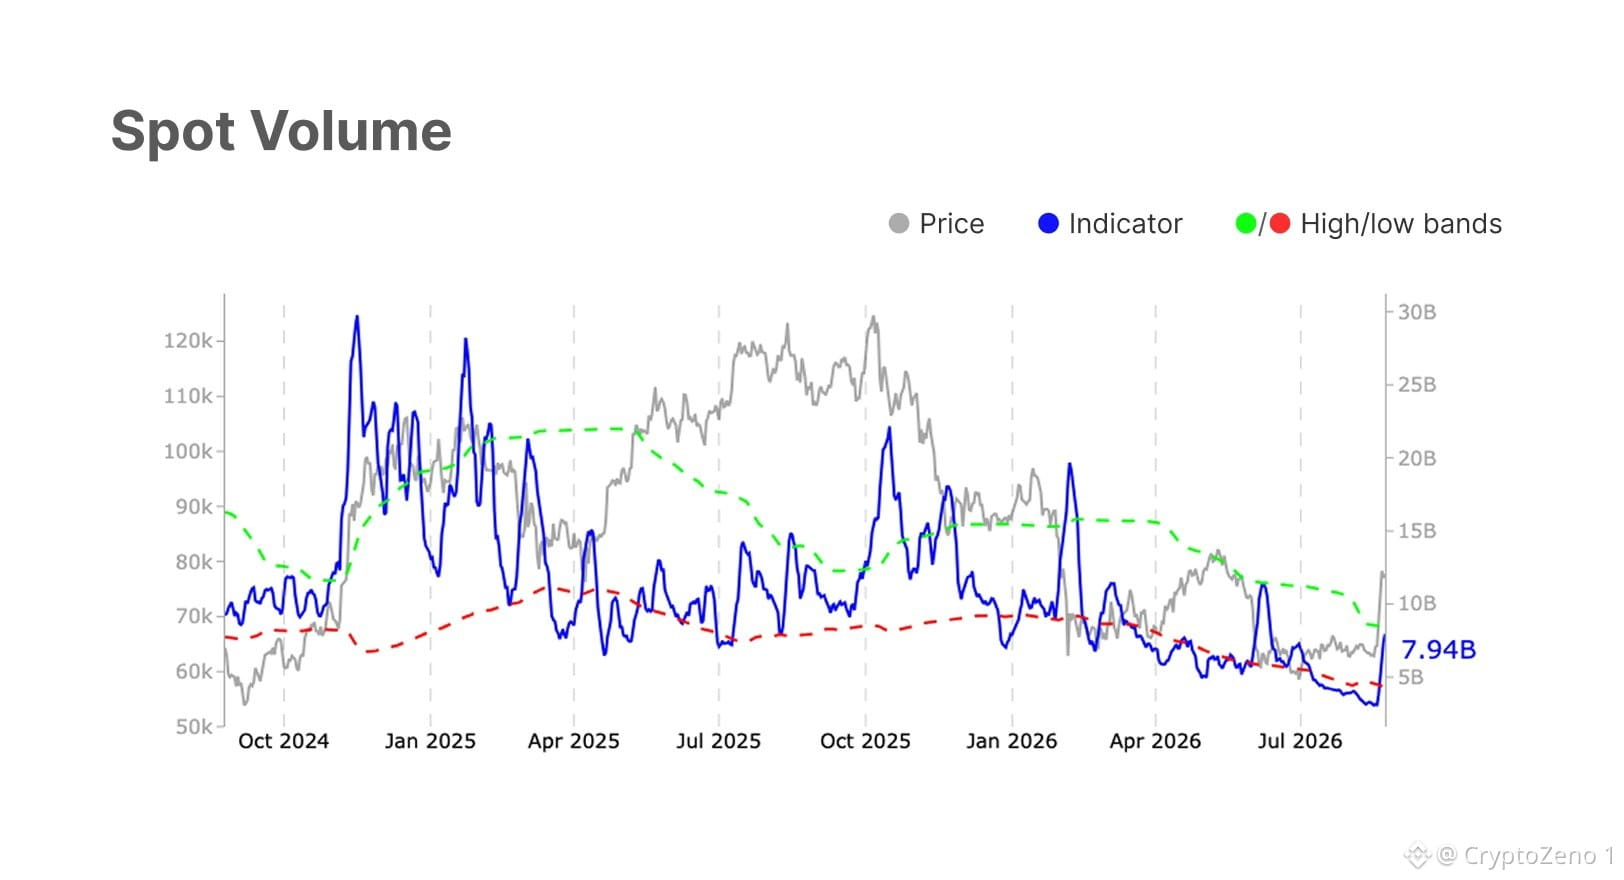
$BTC
has surged toward $80k as spot, derivatives and ETF demand accelerate. Rising activity and profitability support the move, though muted macro inflows suggest it remains tactically driven. #BTC Price Analysis# #Macro Insights#
has surged toward $80k as spot, derivatives and ETF demand accelerate. Rising activity and profitability support the move, though muted macro inflows suggest it remains tactically driven. #BTC Price Analysis# #Macro Insights#
عرض الترجمة
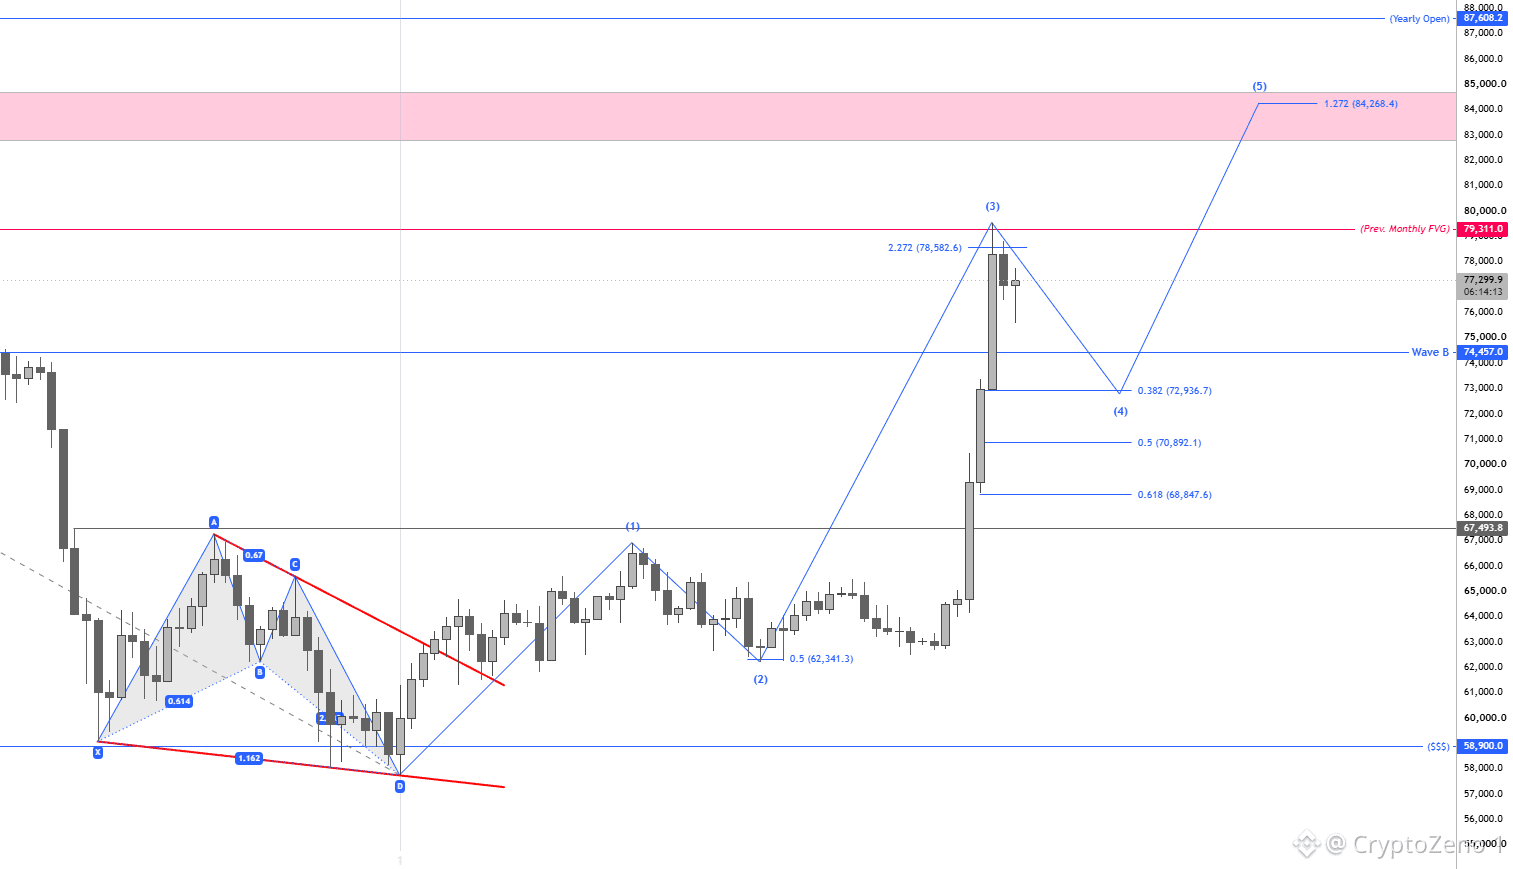
$BTC Currently tracking Wave 4 after this strong Wave 3 impulse.
My POI for Wave 4 is the 0.382-0.5 Fib Zone (72,936-70,892). Expecting us to hold this zone and continue moving higher.
The first major POI for Wave 5 is 82.8K-84.6K. Though, if we push through this zone, it can extend towards 87.6K and potentially 93.7K, so my plan is to play it level-to-level.
Looking for Longs between 72.9K-70.8K and Shorts around the 82.8K–84.6K region. #BTC Price Analysis# #Macro Insights#
My POI for Wave 4 is the 0.382-0.5 Fib Zone (72,936-70,892). Expecting us to hold this zone and continue moving higher.
The first major POI for Wave 5 is 82.8K-84.6K. Though, if we push through this zone, it can extend towards 87.6K and potentially 93.7K, so my plan is to play it level-to-level.
Looking for Longs between 72.9K-70.8K and Shorts around the 82.8K–84.6K region. #BTC Price Analysis# #Macro Insights#
عرض الترجمة
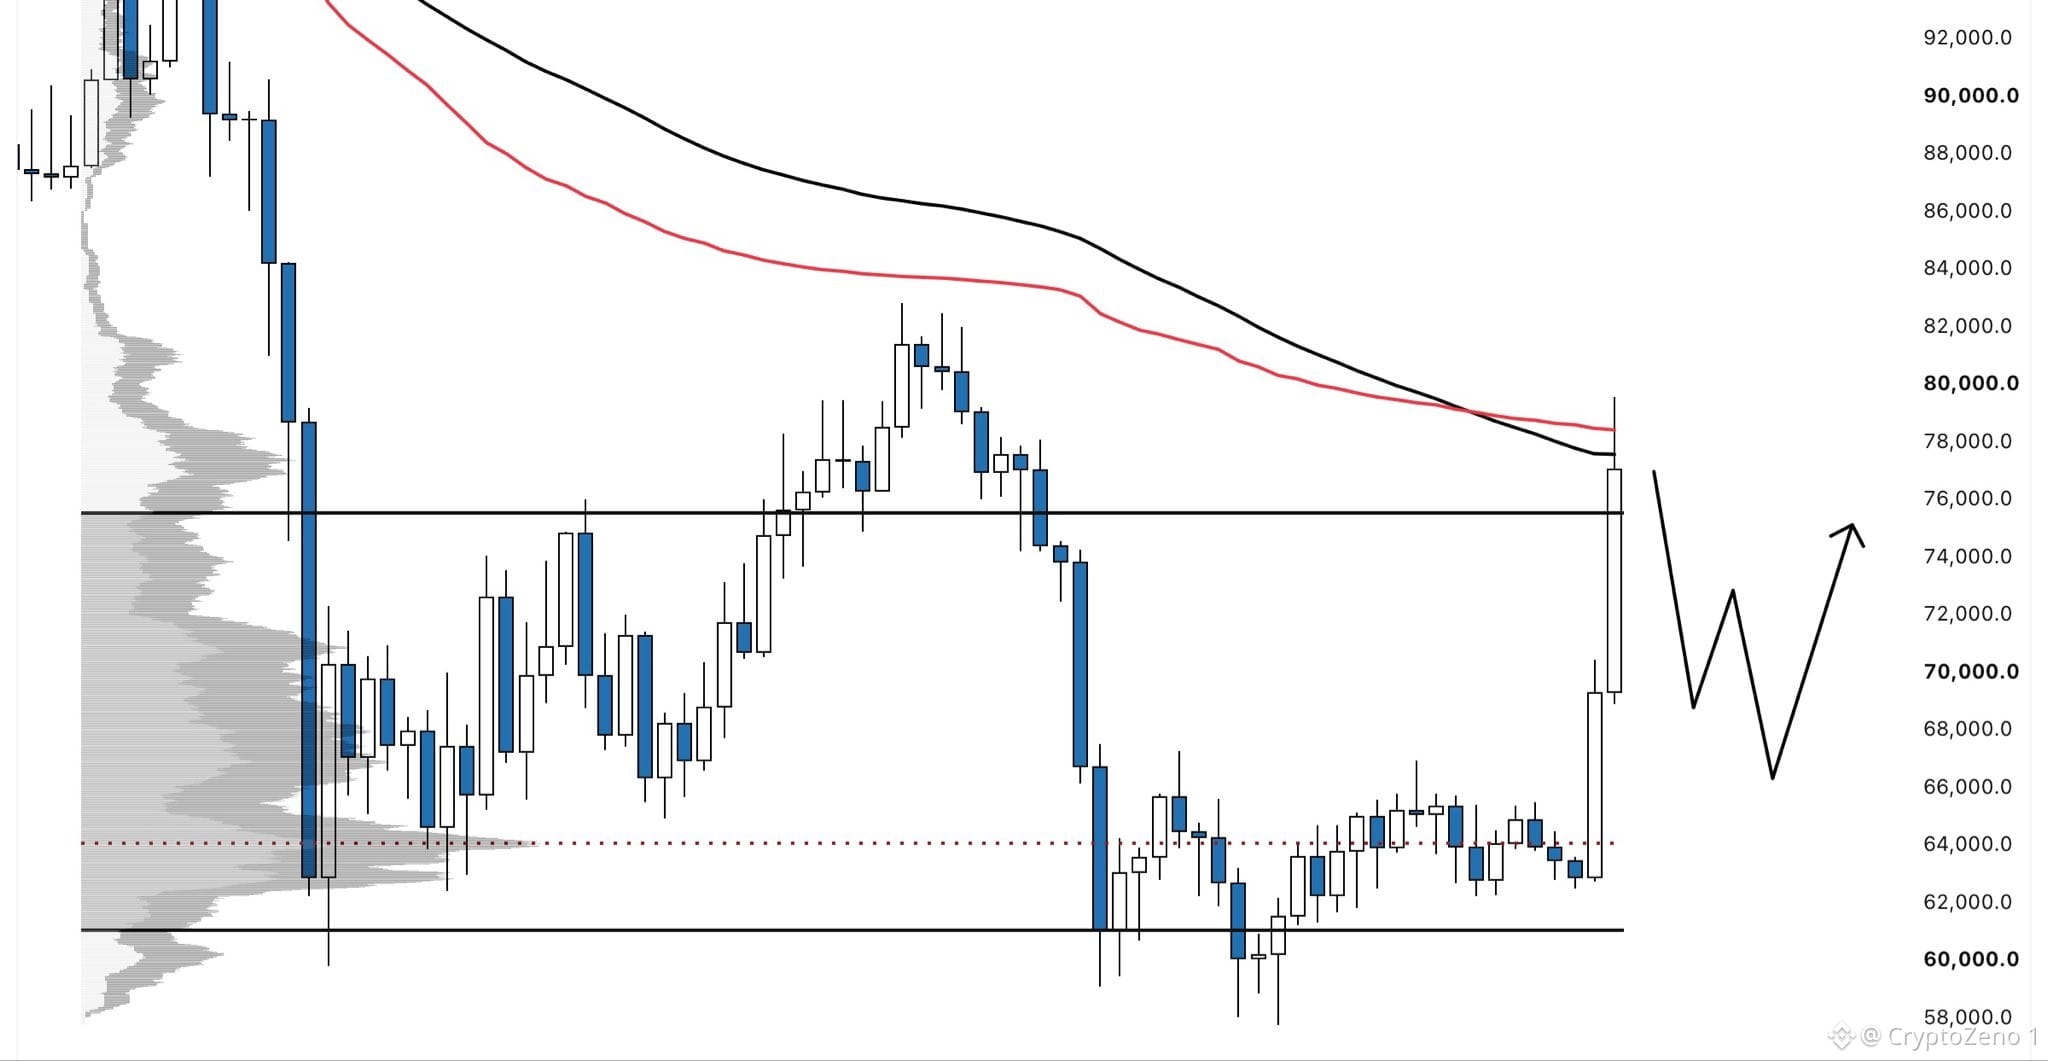
$BTC
Price is currently getting rejected from the 365-day EMA and the aVWAP from the cycle top.
Both are extremely important dynamic levels to reclaim to determine whether we can officially call the end of this bear market.
This rejection is also happening outside the yearly value area, which makes it highly likely that we see a retracement back inside below 75K.
The maximum I expect for this potential pullback is around 67K. #BTC Price Analysis# #Macro Insights#
Price is currently getting rejected from the 365-day EMA and the aVWAP from the cycle top.
Both are extremely important dynamic levels to reclaim to determine whether we can officially call the end of this bear market.
This rejection is also happening outside the yearly value area, which makes it highly likely that we see a retracement back inside below 75K.
The maximum I expect for this potential pullback is around 67K. #BTC Price Analysis# #Macro Insights#
عرض الترجمة
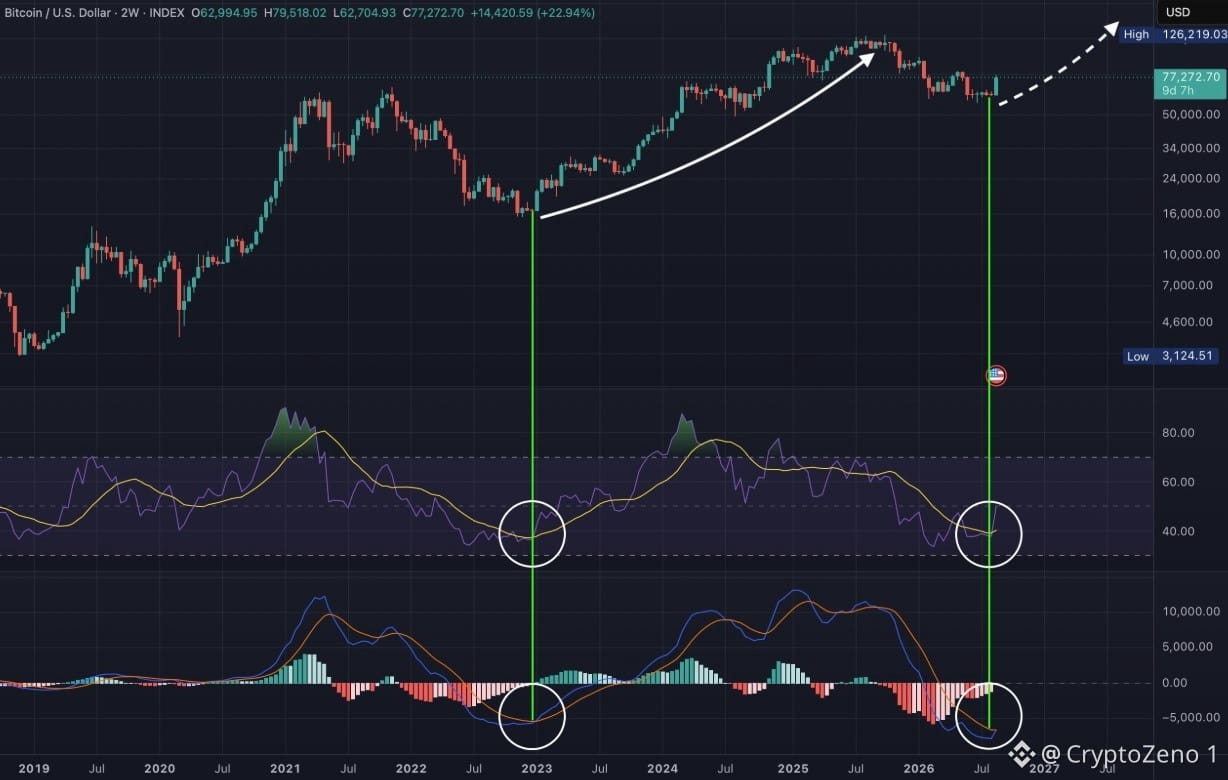
$BTC 2-WEEK Indicators Are Flipping Bullish Once this week closes out the MACD and RSI will confirm and all the bears will be buried. It's over.You made it through the bear market. #BTC Price Analysis# #Macro Insights#
عرض الترجمة
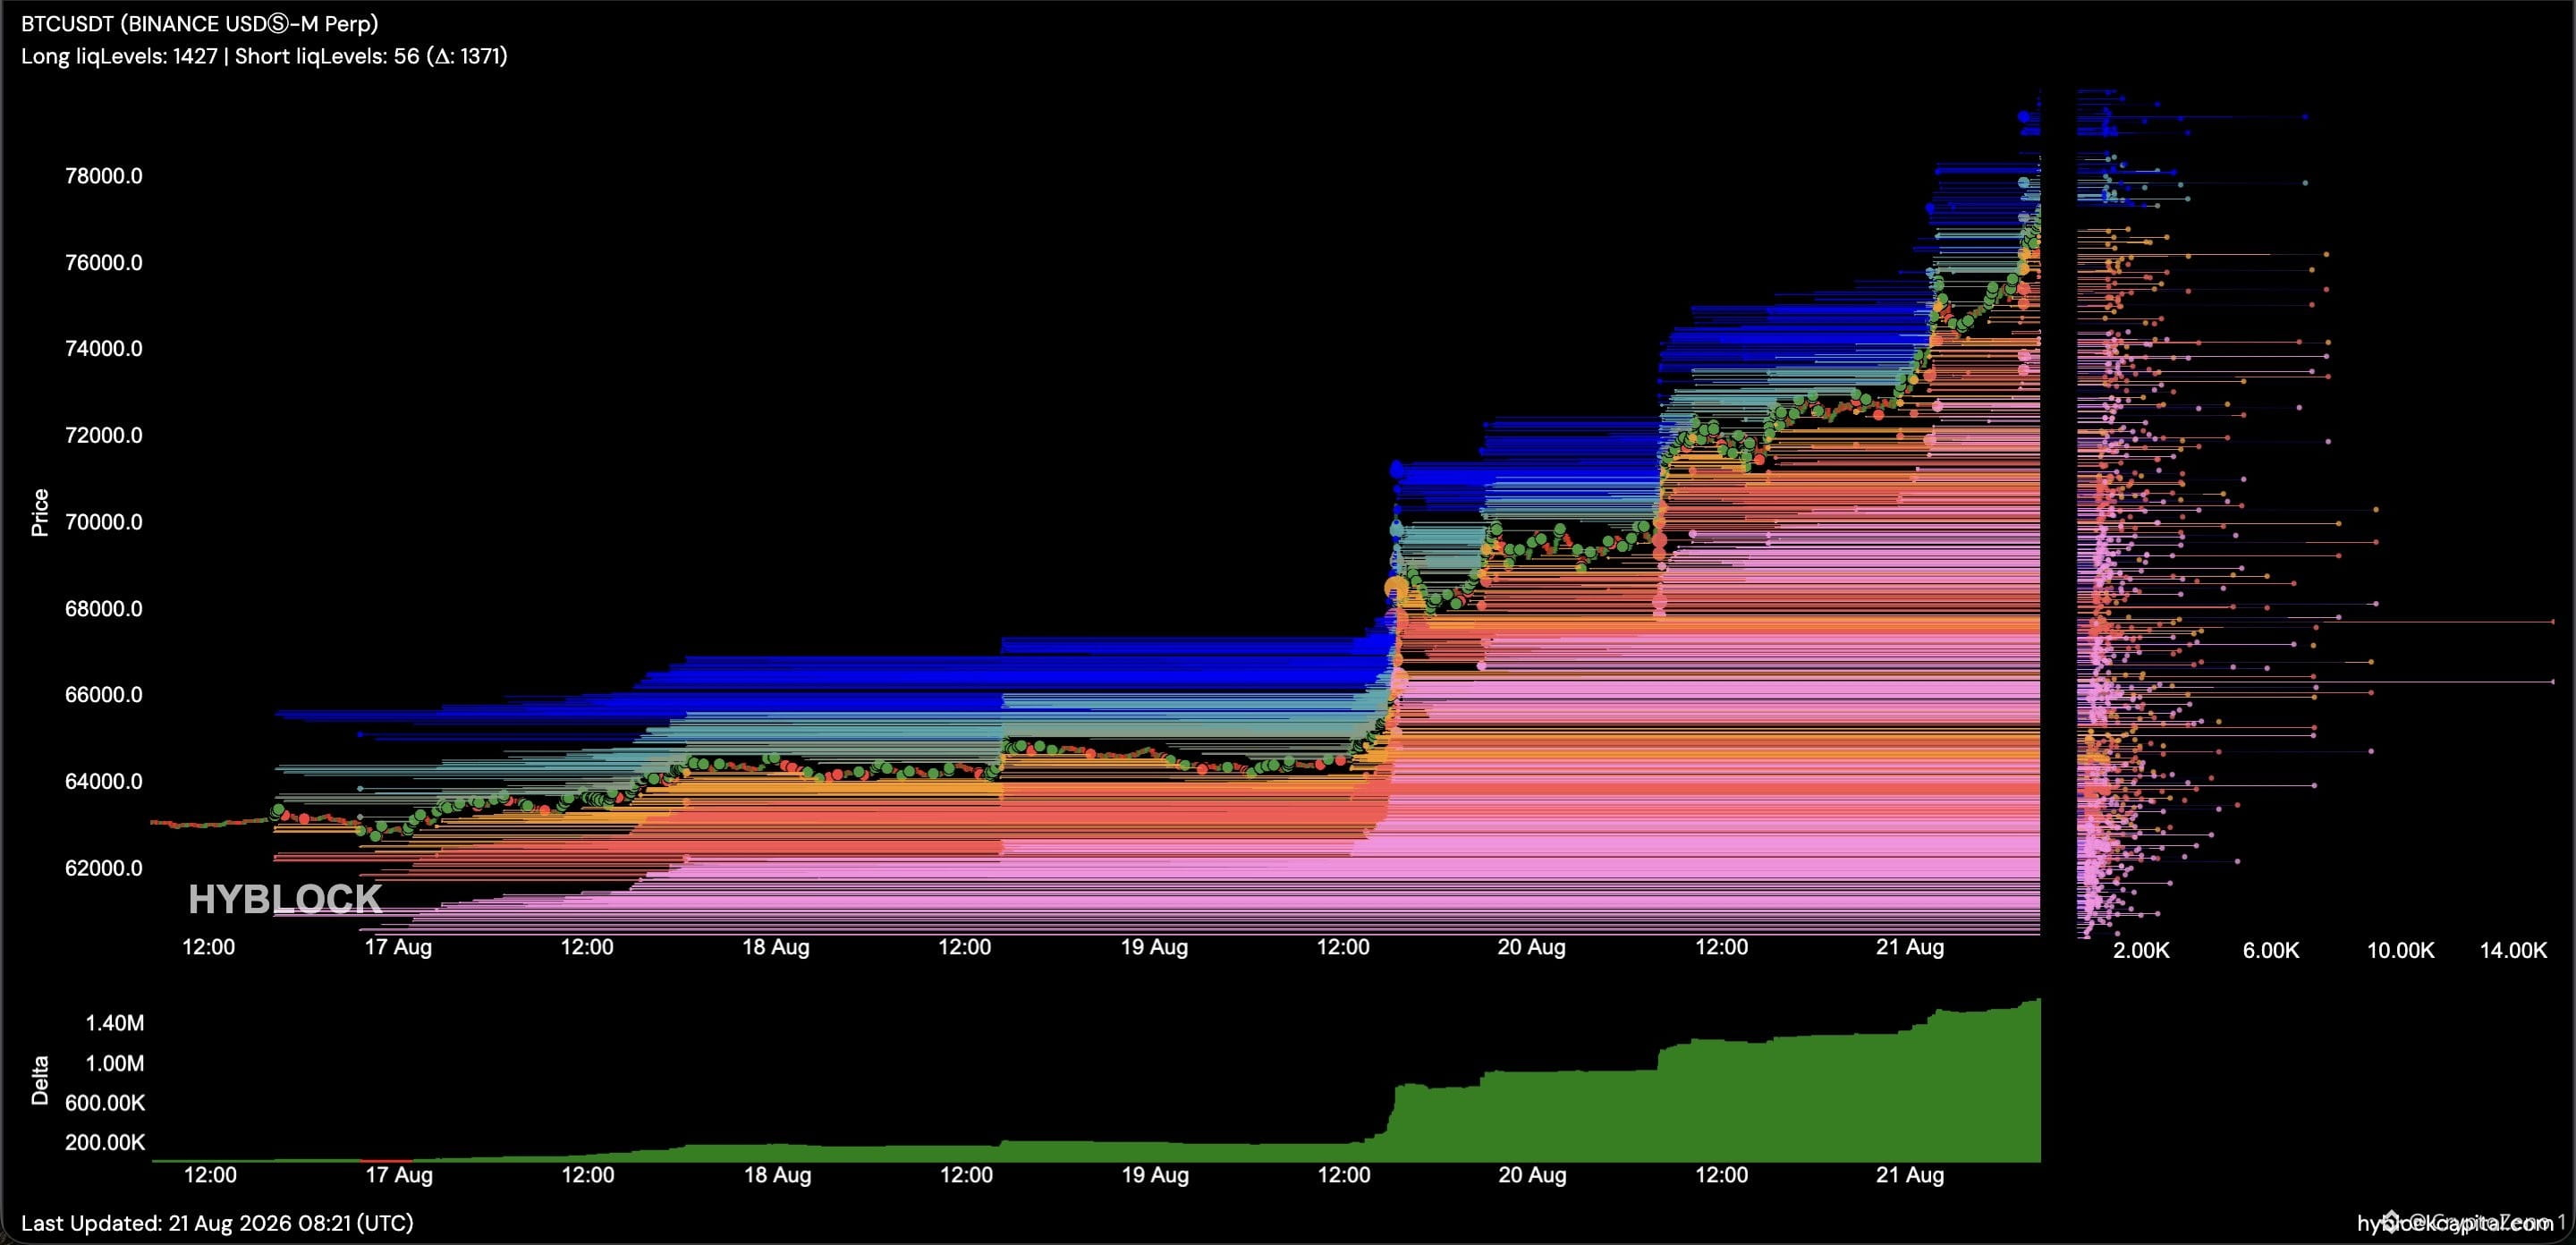
$BTC
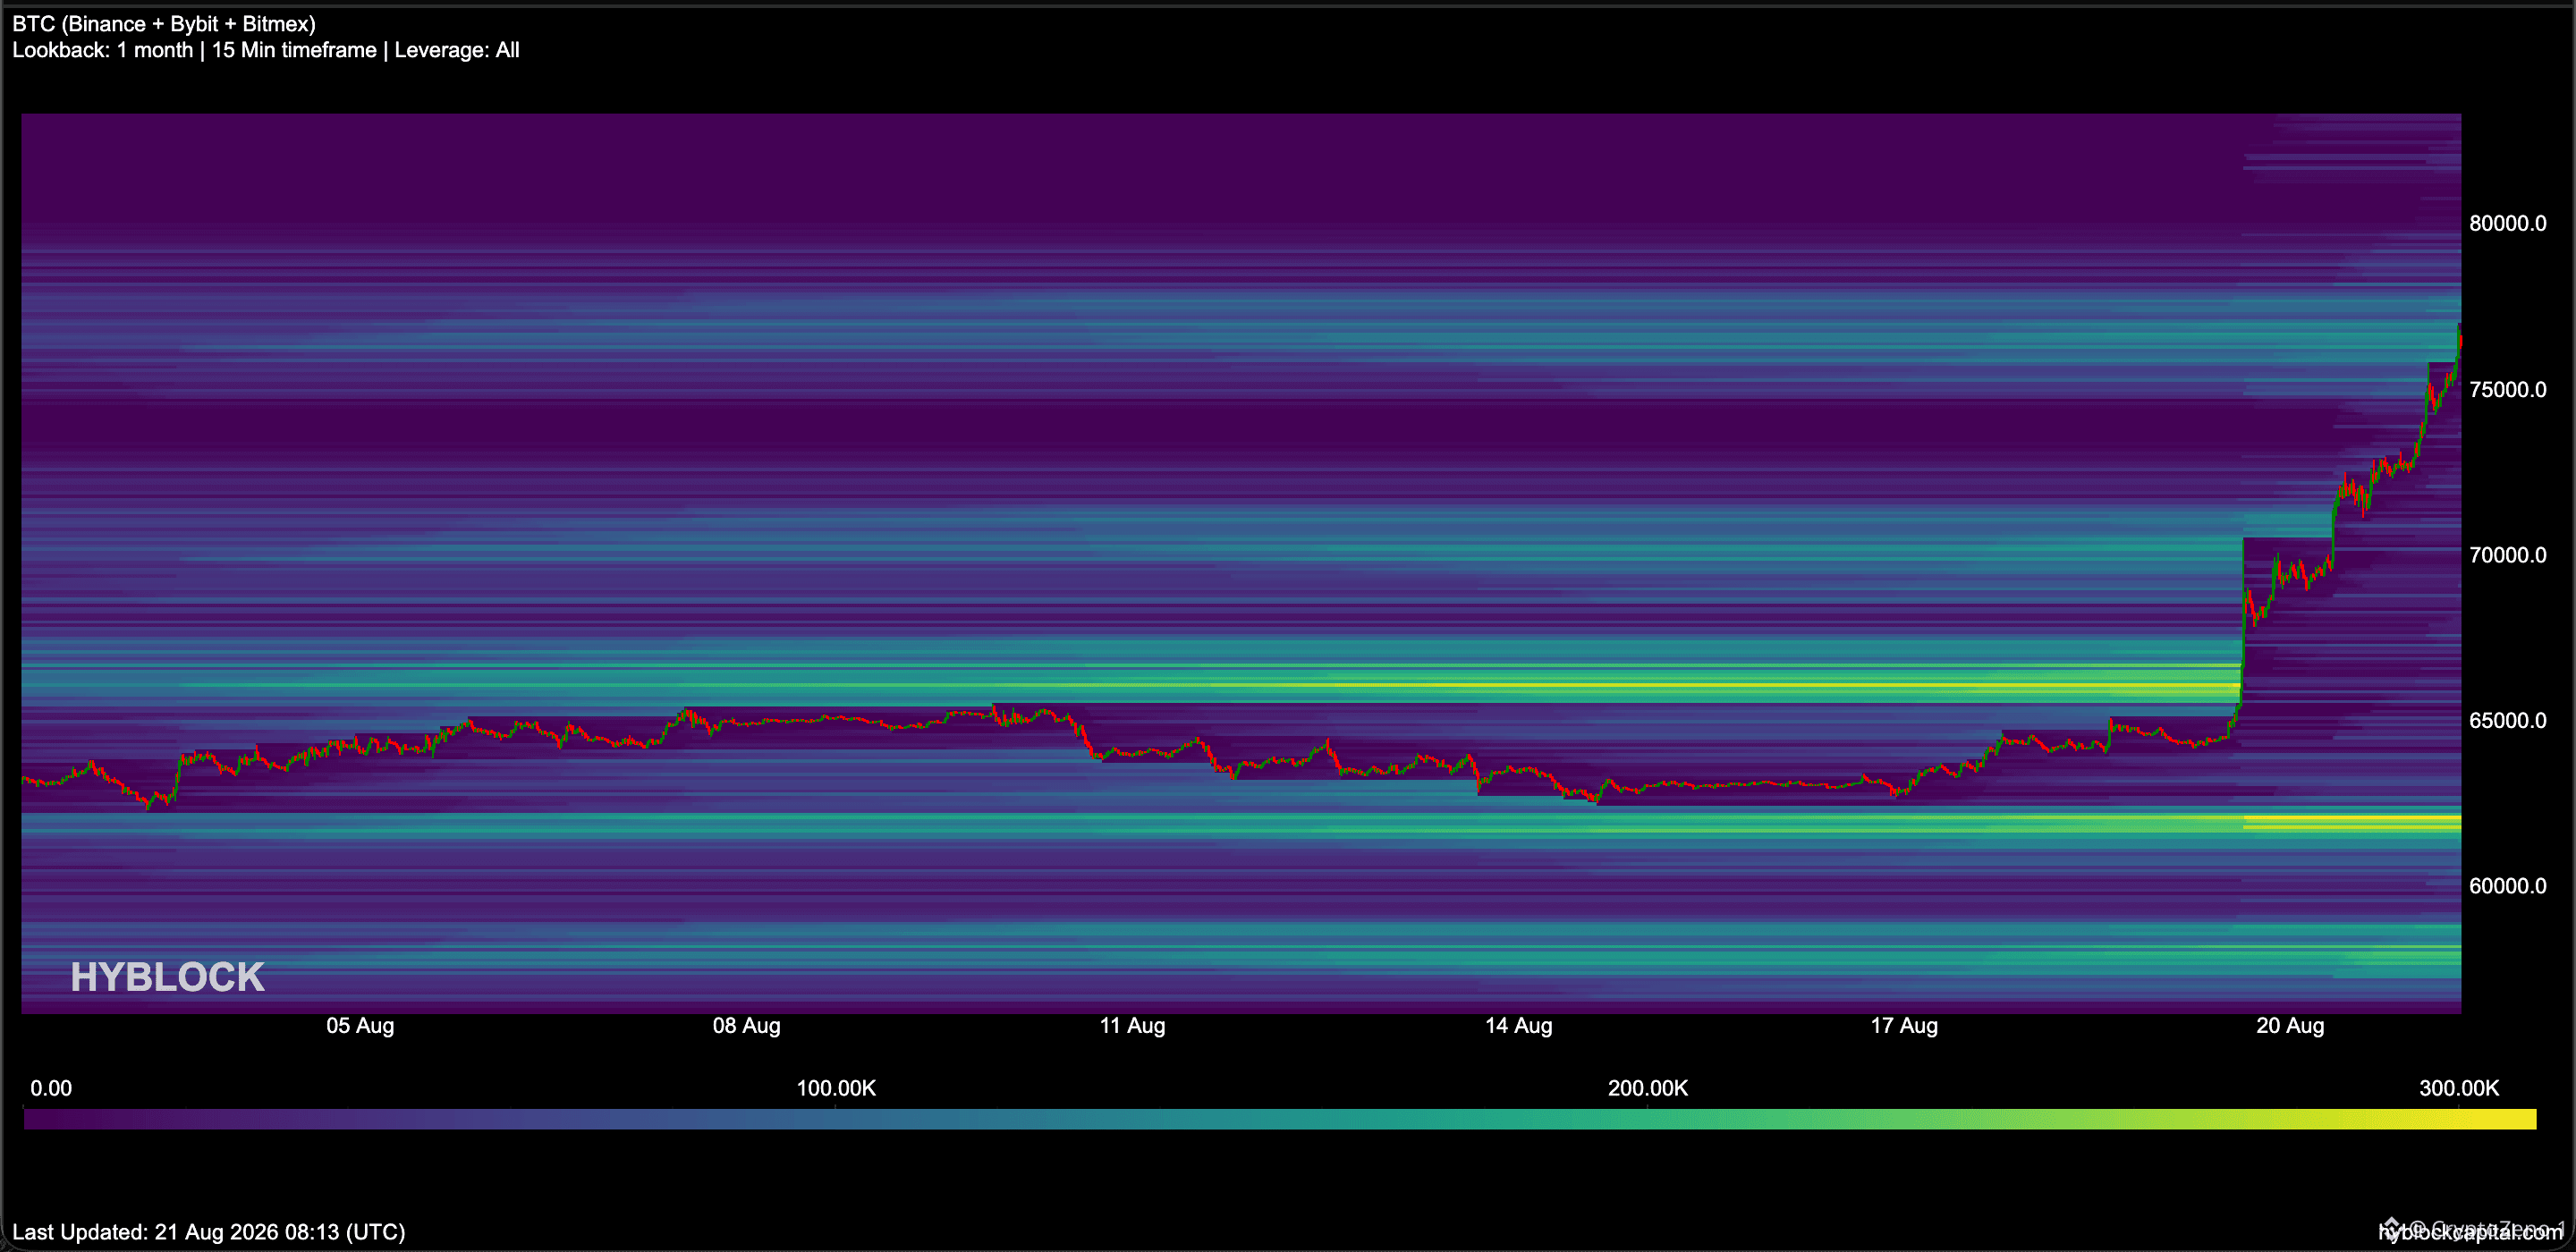
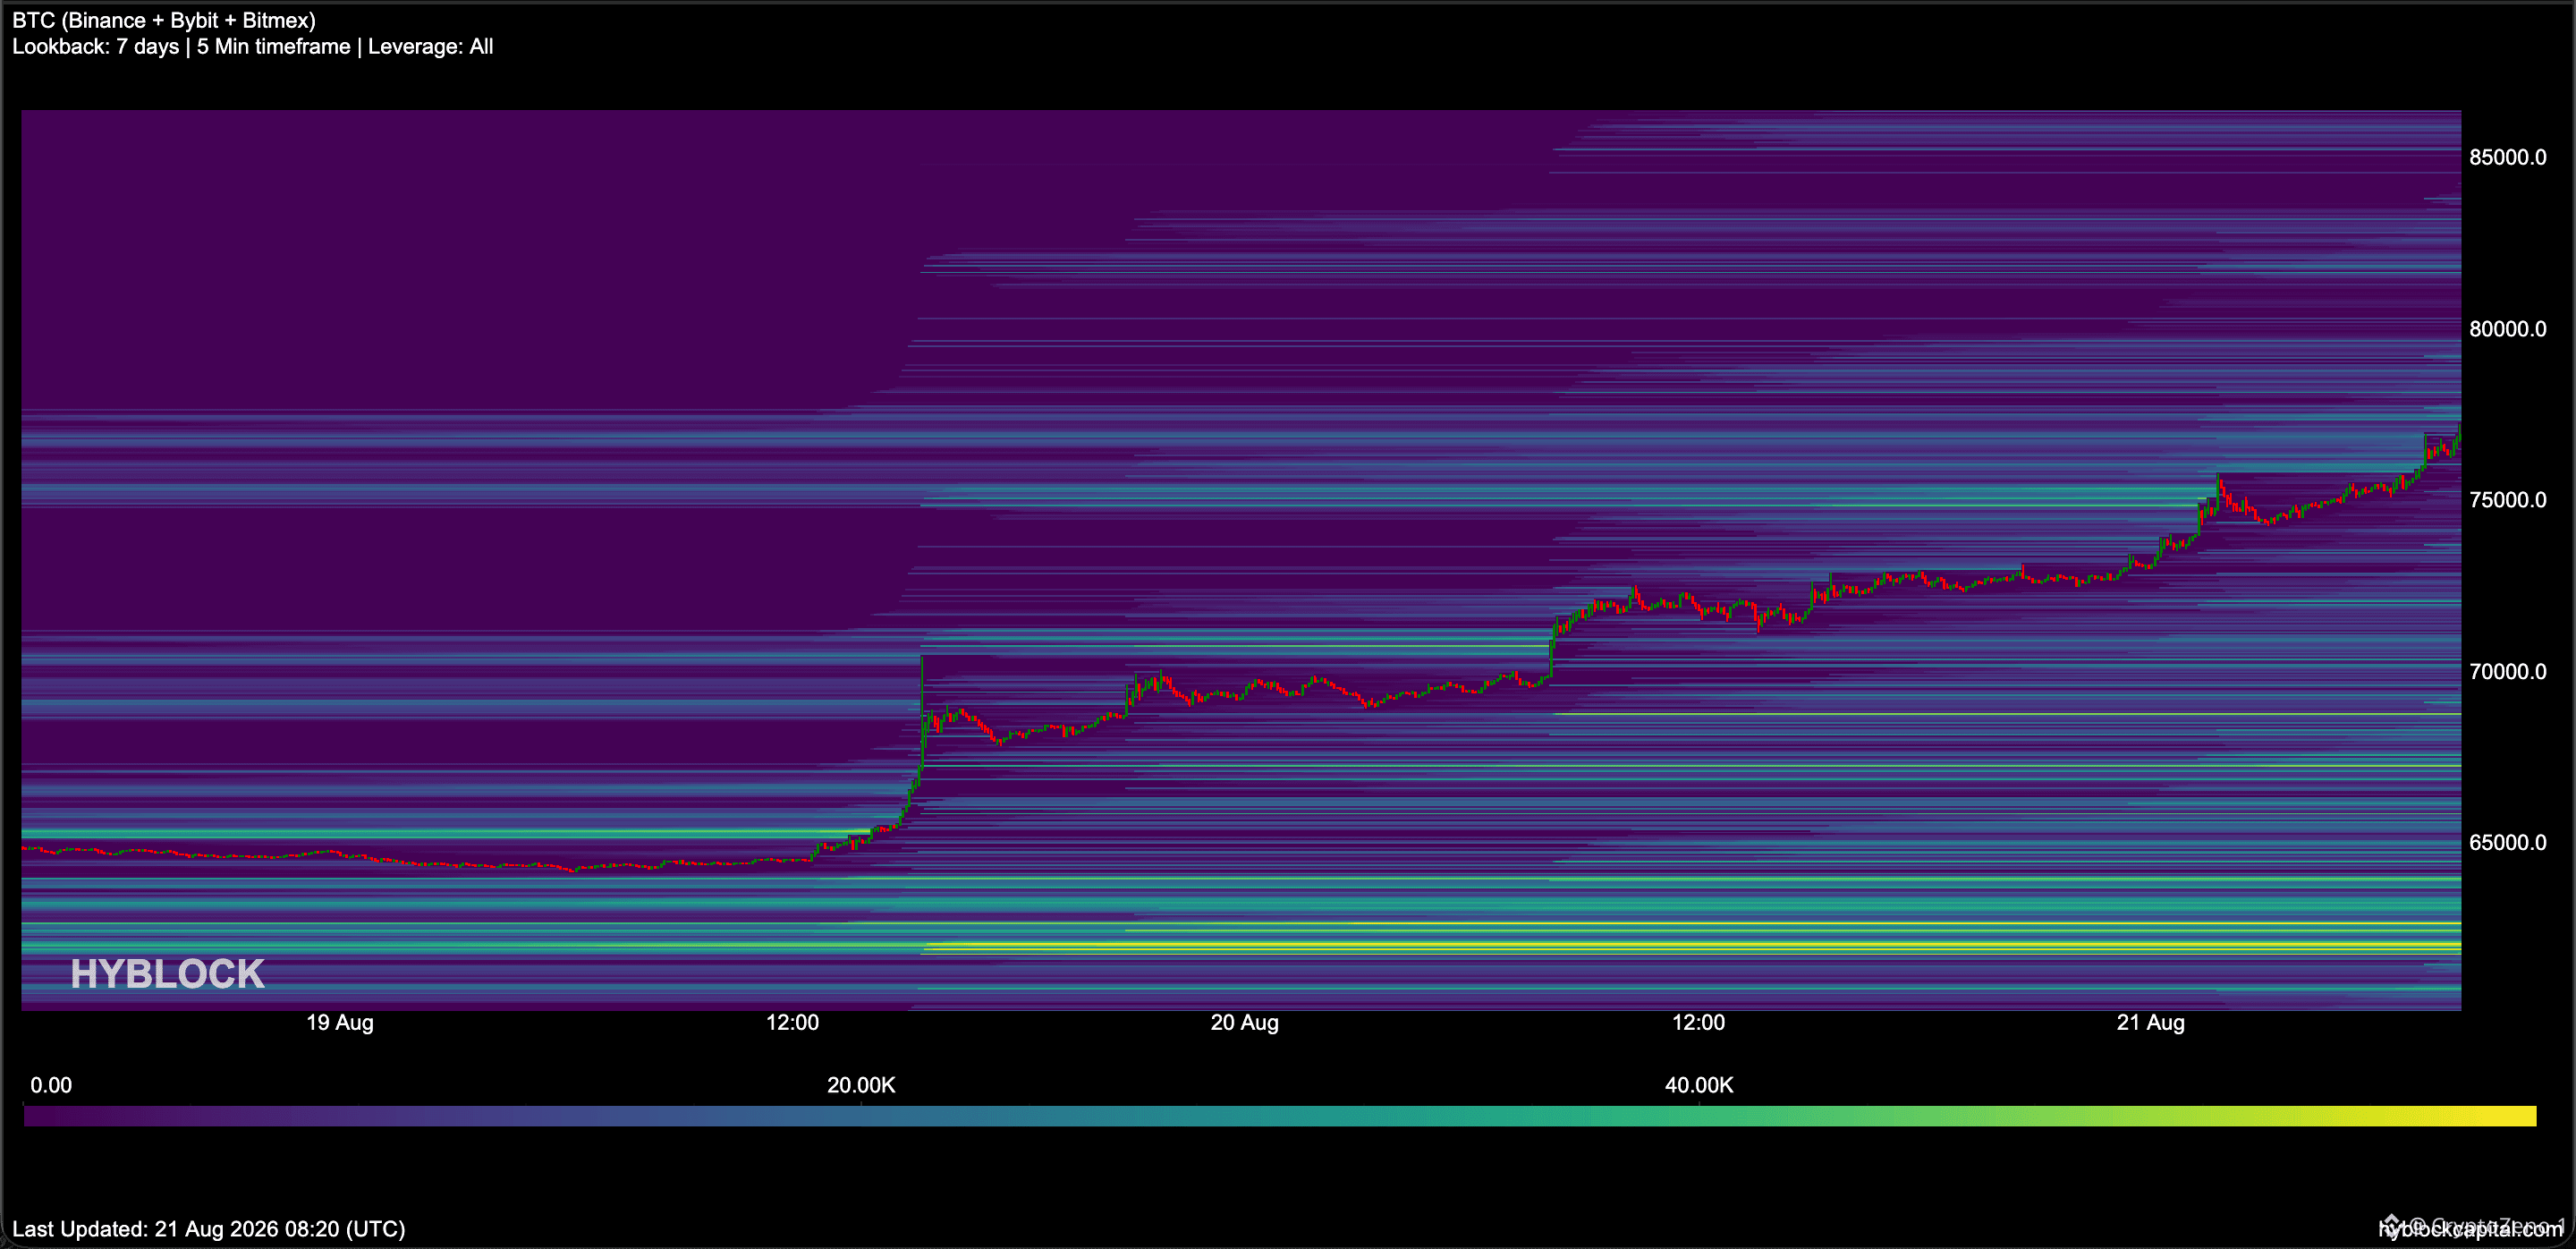
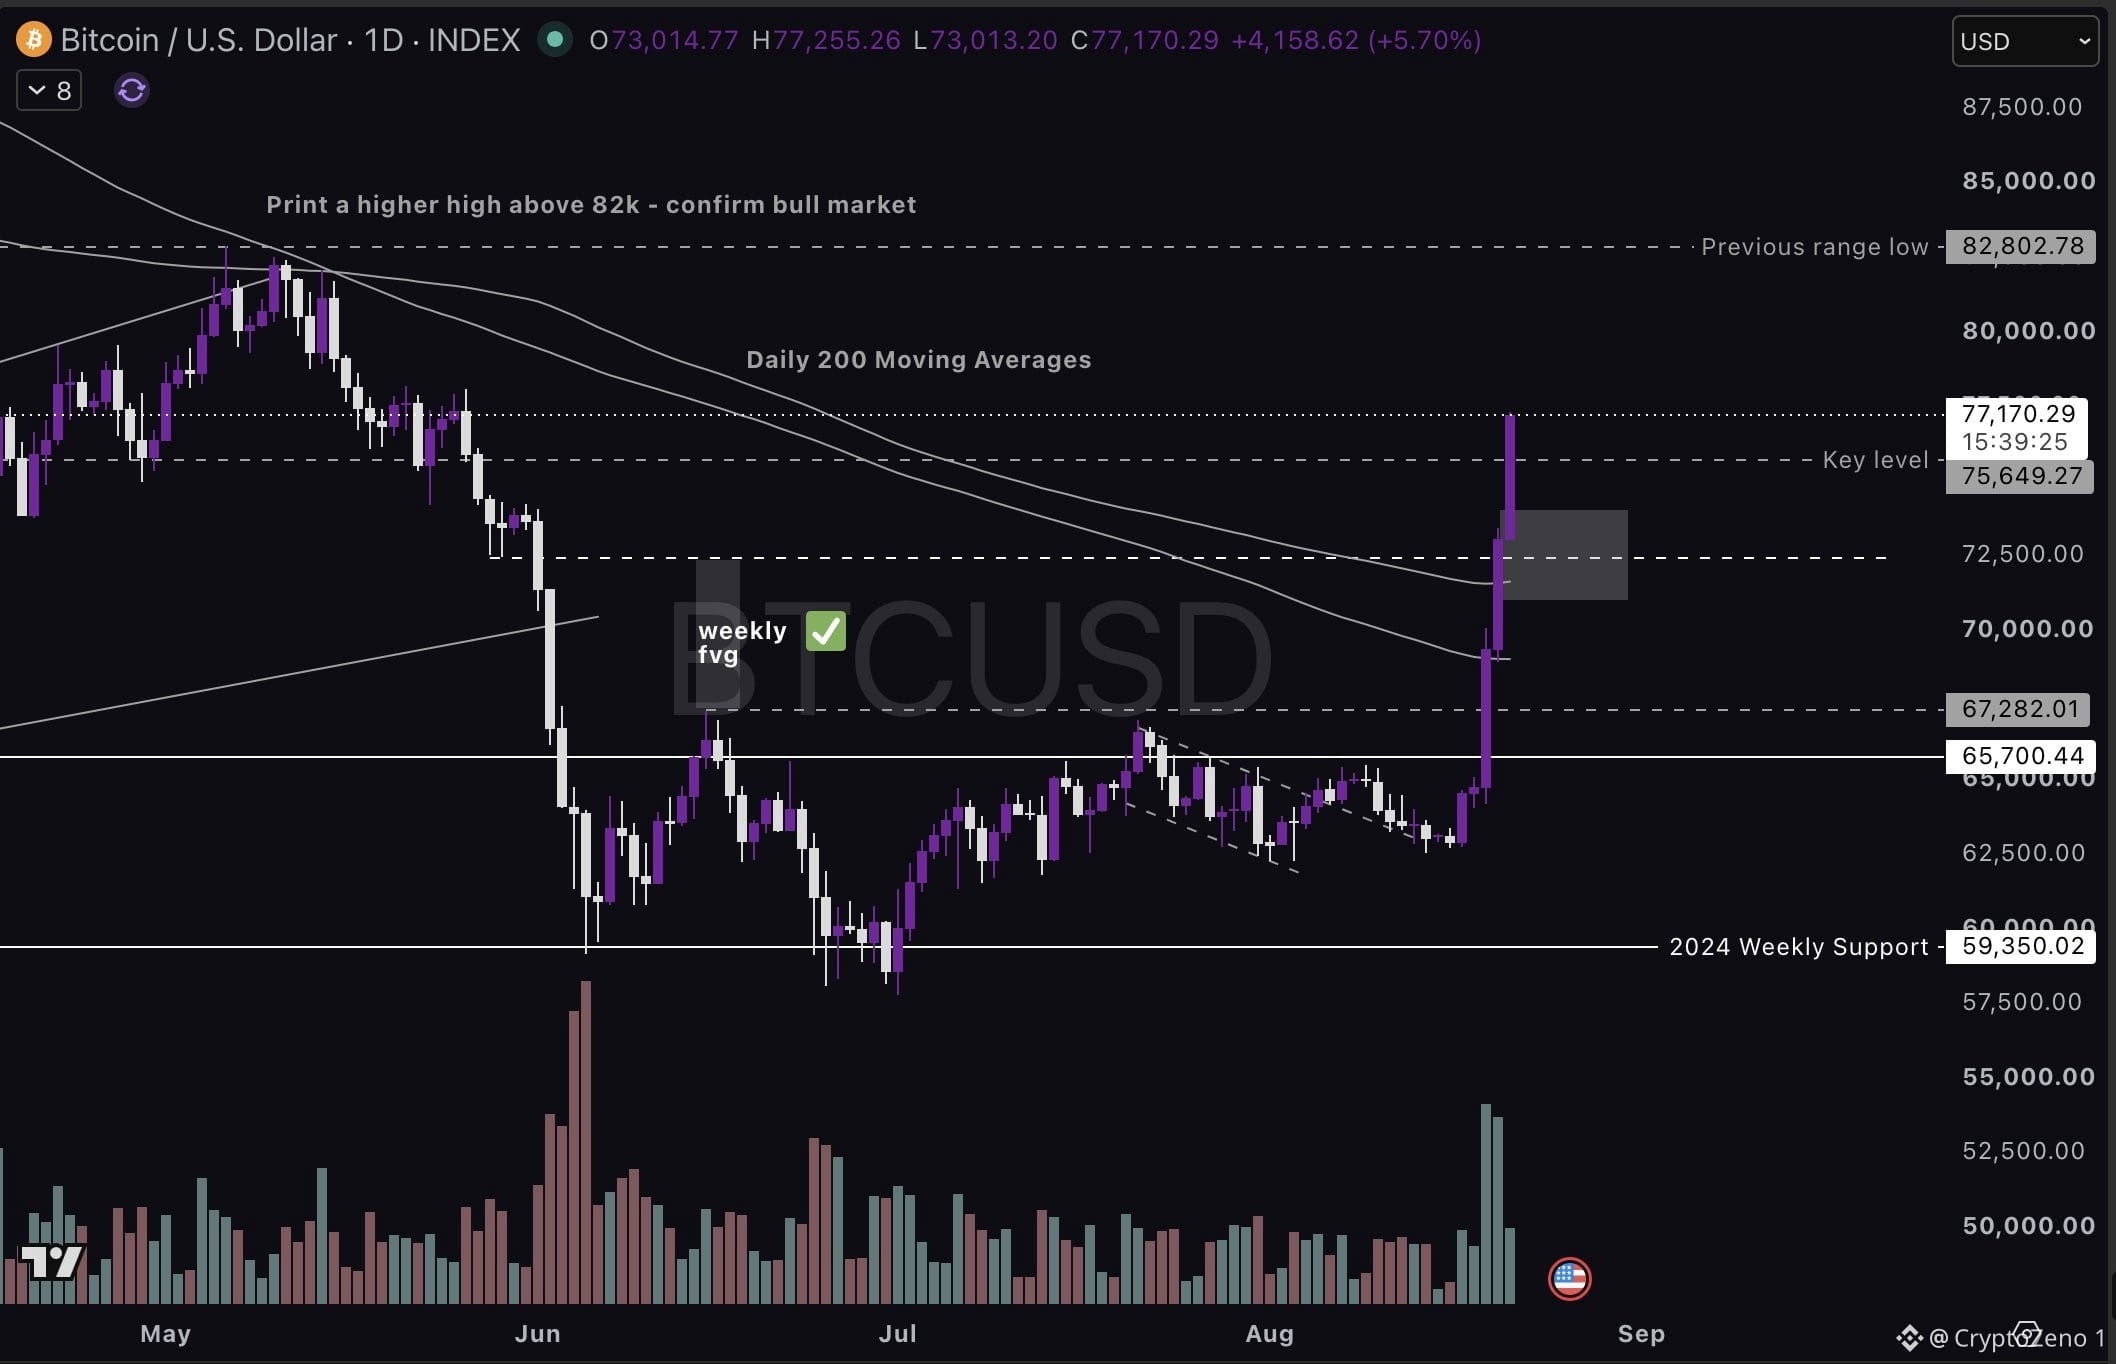
Update & Hyblock Heatmaps
These are the days we are here for!
#Bitcoin doing Bitcoin things and pumping through all key levels on a real breakout backed by volume.
The correction will come 100%, but if BTC could hold the daily 200 moving averages on htf closes, that would be another sign of real strength and a base to attack the low 80s region to set in a higher high.
Expecting a correction before low 80s. That will tell us more about the meaning of the current move. #BTC Price Analysis# #Macro Insights#
Update & Hyblock Heatmaps
These are the days we are here for!
#Bitcoin doing Bitcoin things and pumping through all key levels on a real breakout backed by volume.
The correction will come 100%, but if BTC could hold the daily 200 moving averages on htf closes, that would be another sign of real strength and a base to attack the low 80s region to set in a higher high.
Expecting a correction before low 80s. That will tell us more about the meaning of the current move. #BTC Price Analysis# #Macro Insights#
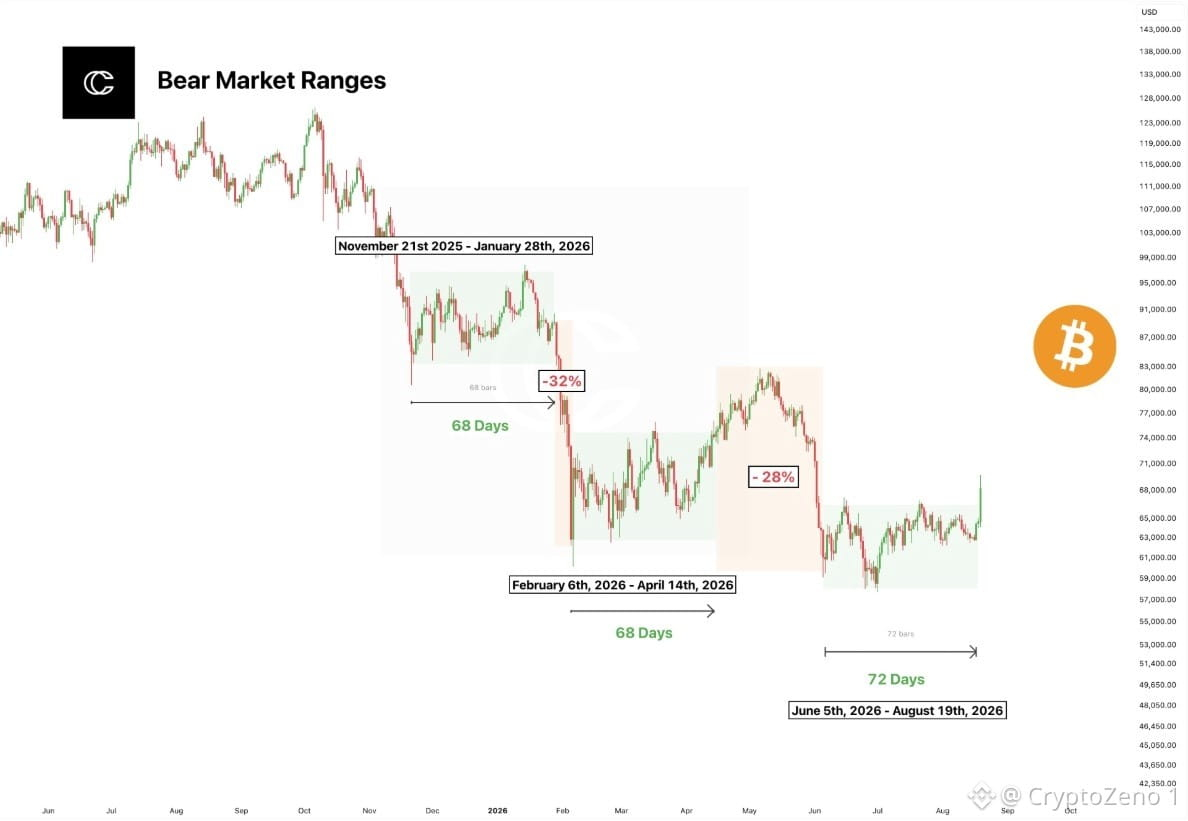
🚨 $BTC قد يعيد تكرار بنية سوق هابطة #Bitcoin قضى الآن 72 يومًا داخل النطاق الحالي من 5 يونيو إلى 19 أغسطس، وهو ما يطابق بشكل وثيق نطاقين سابقين لأسواق هابطة استمر كل منهما 68 يومًا. النطاق الأول سبق هبوطًا قاسيًا بنسبة 32%، بينما أعقب النطاق الثاني هبوط آخر بنسبة 28%. الإشارة الرئيسية ليست العدد الدقيق للأيام، بل نمط الانضغاط. كل دورة أظهرت توطدًا جانبيًا طويلًا قبل أن تتوسع التقلبات بشكل حاد. الآن يقوم BTC باختبار الحافة العلوية للنطاق الأخير، ما يجعل محاولة الاختراق هذه مهمة تقنيًا. أما استمرار الحركة فوق النطاق فقد يبطل التكرار الهبوطي ويشير إلى انتقال بنظام جديد. ومع ذلك، قد يؤدي الفشل عند مستوى المقاومة إلى تحويل التوطد الحالي إلى مرحلة توزيع أخرى. قد تحدد الجلسات القليلة القادمة ما إذا كان BTC يكسر النمط التاريخي أو يعيده. #BTC Price Analysis# #Macro Insights#
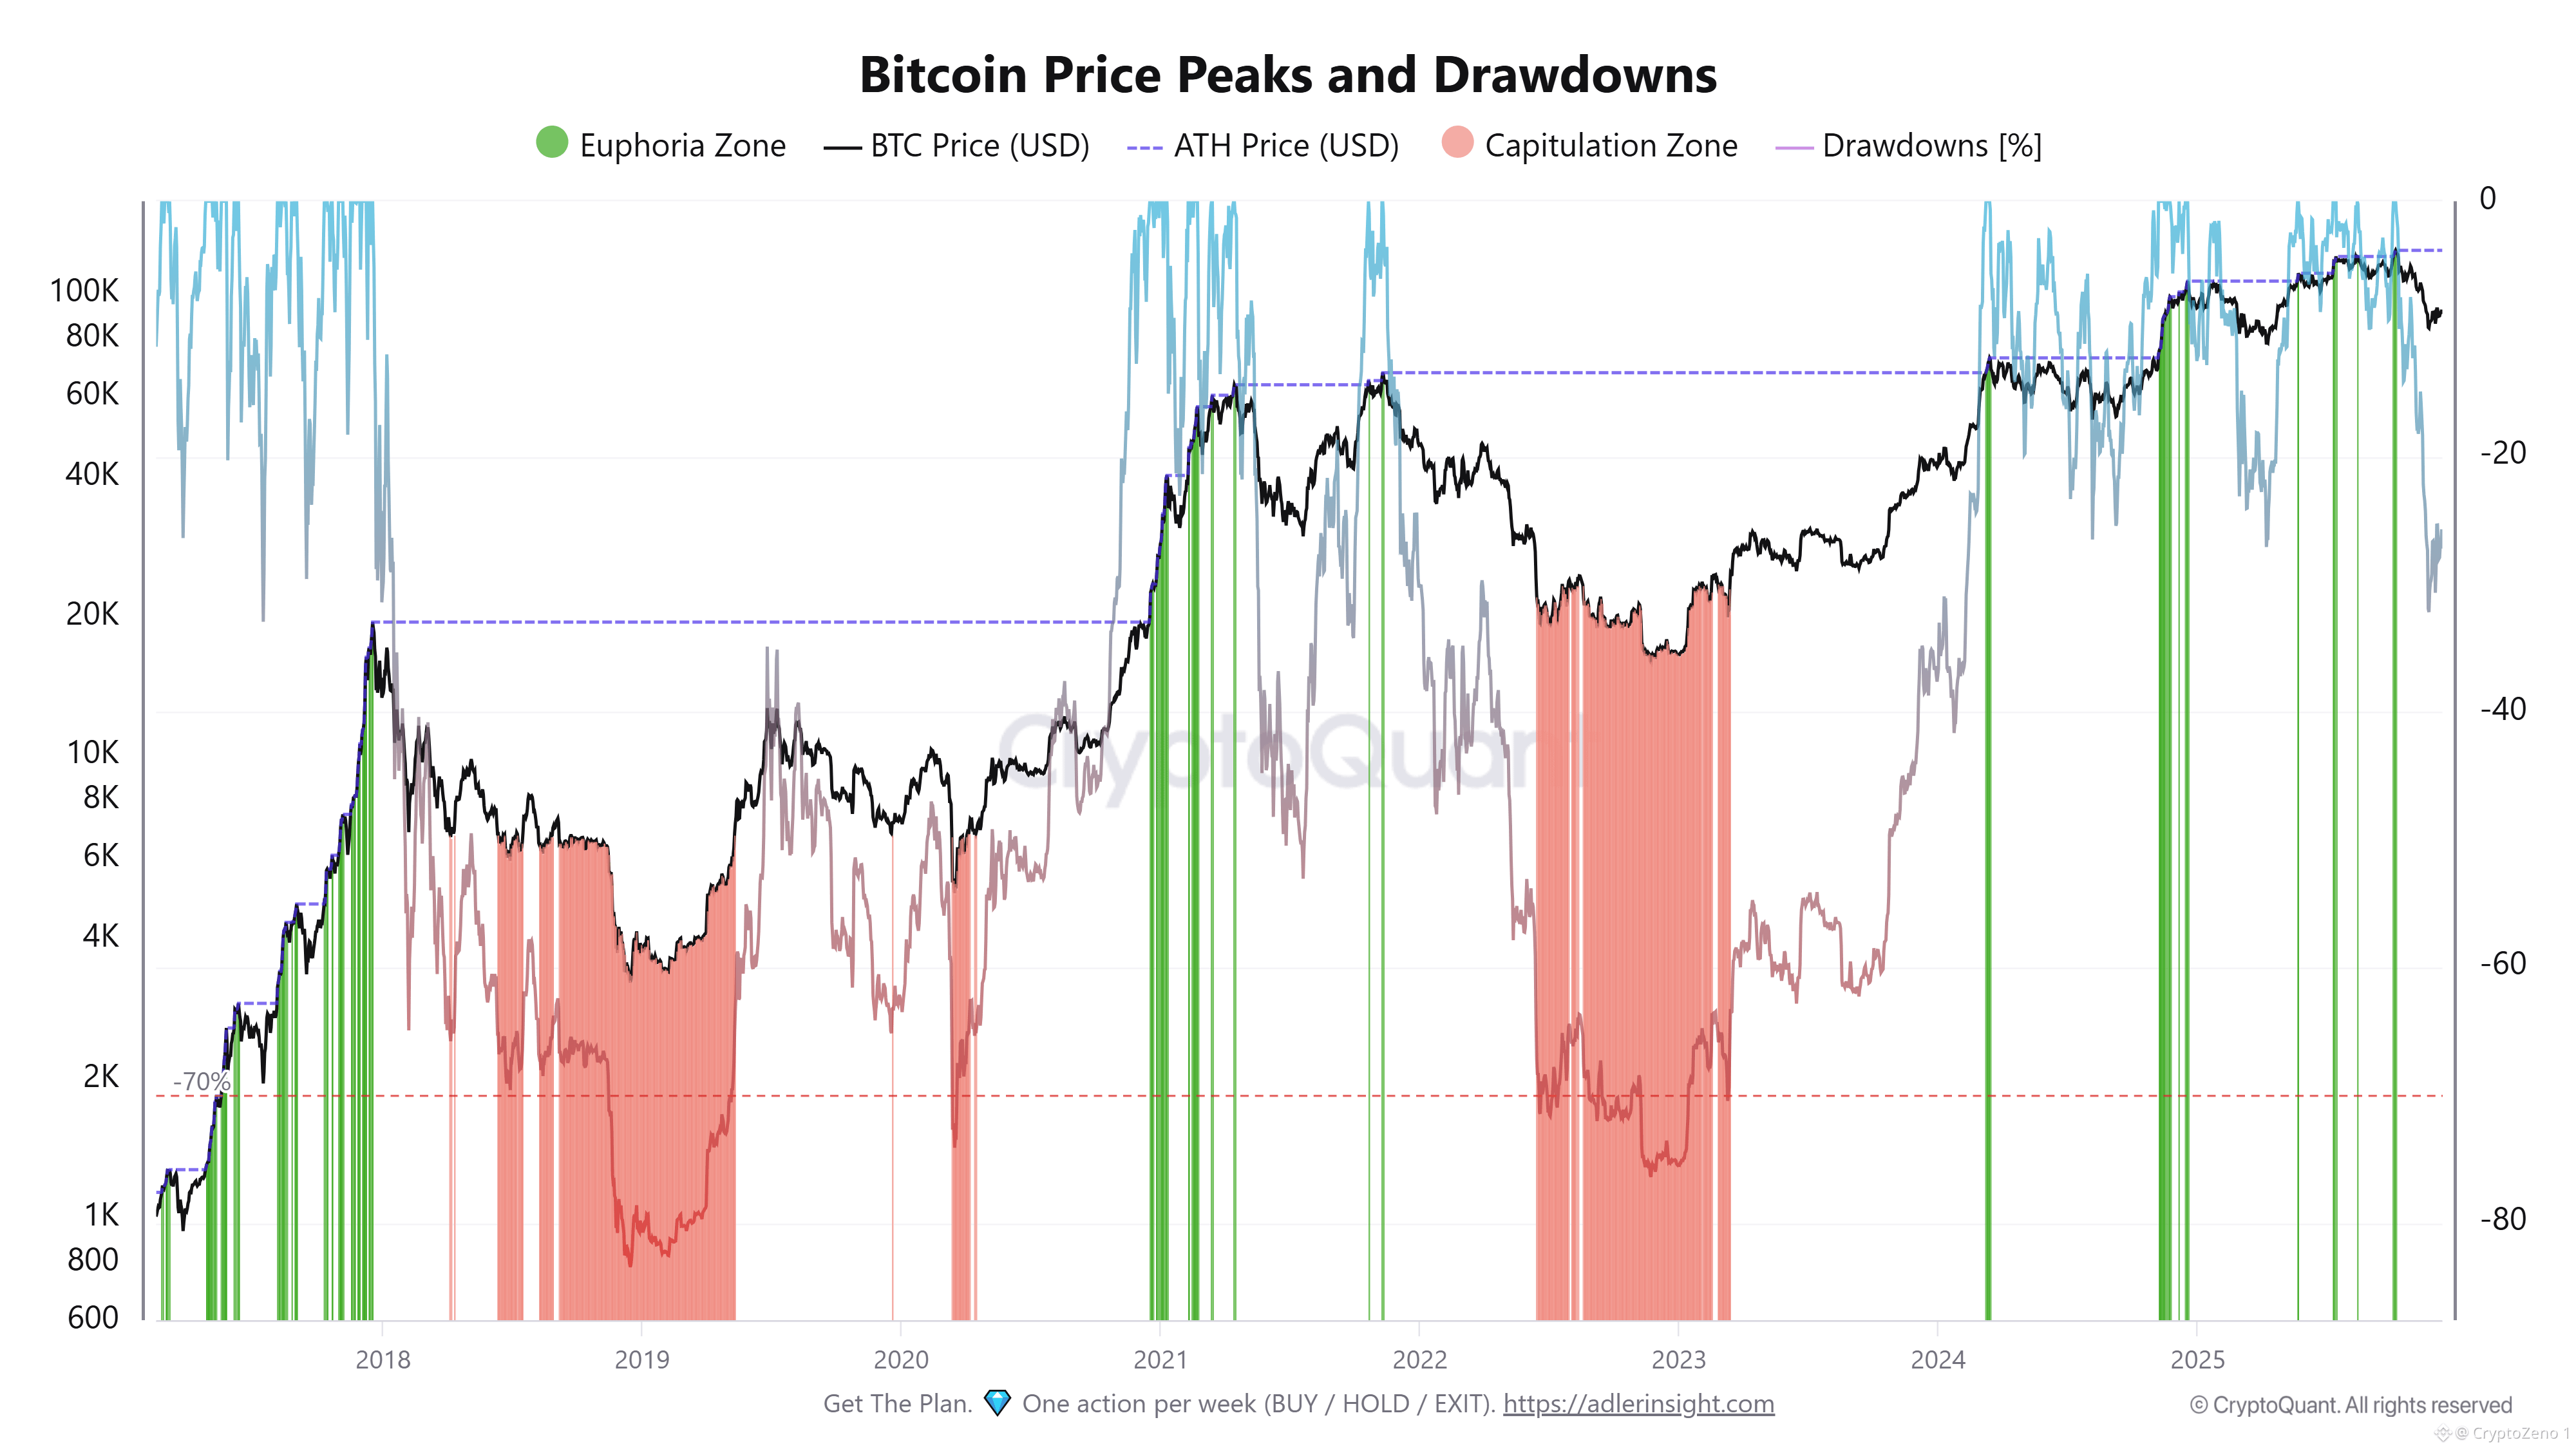
#بيتكوين تاريخ الانخفاضات (Drawdown) يرسل إشارة مختلفة عند مستويات اليوم القياسية
$BTC
تُظهر بيانات تاريخ بيتكوين أن اكتشاف السعر نادرًا ما يتحرك في خط مستقيم. فقد تسببت المكاسب الكبرى إلى منطقة النشوة مرارًا في إعادة تسعير حادة، مع حدوث تصحيحات عميقة عندما كانت الثقة في أعلى مستوياتها. يضع الرسم البياني سلوك هذه الدورة في سياقه: فقد تلت قمة 2017 انهيارٌ شديد، بينما انتهت 2021 أيضًا بانخفاض ممتد. وقد أشارت هذه التراجعات إلى تحولات كبيرة في بنية السوق والسيولة والتموضع.
ما يجعل الدورة الحالية أكثر إثارة للاهتمام هو حجم الانخفاضات مقارنةً بالقمم الجديدة. فقد دفعت بيتكوين إلى مناطق قياسية دون أن تُكرر بعد عملية الاستسلام القصوى التي شوهدت في الدورات السابقة. وهذا لا يزيل مخاطر الهبوط. لقد امتصّ السوق حتى الآن التصحيحات دون حدوث خفضٍ إجباري للرافعة المالية كما يحدث أثناء الانعكاسات الكبرى. وتصبح الفروقات بين التصحيح الطبيعي والضعف البنيوي مهمة مع بقاء السعر مرتفعًا.
سأولي اهتمامًا أكبر لما يحدث بعد كل قمة جديدة أكثر من اهتمامي بالقمة نفسها. إذا خسرت بيتكوين أرضها لكنها تعود بسرعة، فإن السوق يمتص جني الأرباح مع الحفاظ على الطلب. أما إذا أصبحت التعافيات أضعف بينما تتعمق الانخفاضات، فتتغير الإشارة. يمكن للسوق أن يبدو قويًا على مخطط الأسعار بينما يتدهور الزخم الداخلي. تاريخيًا، كانت عملية الانتقال من تراجعات سطحية إلى انخفاضات مستمرة أكثر دلالة من أي شمعة حمراء واحدة.
يضيف المشهد الكلي (الماكرو) طبقة أخرى. تعمل بيتكوين الآن ضمن سوق تتشكل ملامحه من خلال السيولة العالمية، والتدفقات المؤسسية، والظروف المالية، وشهية المخاطر. تُعد الانخفاضات التاريخية مرجعًا لا جدولًا زمنيًا. لا يمكن ببساطة إسقاط هبوط بنسبة 70% من دورة سابقة على الدورة التالية. والسؤال الأفضل هو ما إذا كان الطلب قادرًا على الاستمرار في امتصاص العرض قرب التقييمات القياسية. #تحليل_سعر_بيتكوين# #رؤى_ماكرو#
$BTC
تُظهر بيانات تاريخ بيتكوين أن اكتشاف السعر نادرًا ما يتحرك في خط مستقيم. فقد تسببت المكاسب الكبرى إلى منطقة النشوة مرارًا في إعادة تسعير حادة، مع حدوث تصحيحات عميقة عندما كانت الثقة في أعلى مستوياتها. يضع الرسم البياني سلوك هذه الدورة في سياقه: فقد تلت قمة 2017 انهيارٌ شديد، بينما انتهت 2021 أيضًا بانخفاض ممتد. وقد أشارت هذه التراجعات إلى تحولات كبيرة في بنية السوق والسيولة والتموضع.
ما يجعل الدورة الحالية أكثر إثارة للاهتمام هو حجم الانخفاضات مقارنةً بالقمم الجديدة. فقد دفعت بيتكوين إلى مناطق قياسية دون أن تُكرر بعد عملية الاستسلام القصوى التي شوهدت في الدورات السابقة. وهذا لا يزيل مخاطر الهبوط. لقد امتصّ السوق حتى الآن التصحيحات دون حدوث خفضٍ إجباري للرافعة المالية كما يحدث أثناء الانعكاسات الكبرى. وتصبح الفروقات بين التصحيح الطبيعي والضعف البنيوي مهمة مع بقاء السعر مرتفعًا.
سأولي اهتمامًا أكبر لما يحدث بعد كل قمة جديدة أكثر من اهتمامي بالقمة نفسها. إذا خسرت بيتكوين أرضها لكنها تعود بسرعة، فإن السوق يمتص جني الأرباح مع الحفاظ على الطلب. أما إذا أصبحت التعافيات أضعف بينما تتعمق الانخفاضات، فتتغير الإشارة. يمكن للسوق أن يبدو قويًا على مخطط الأسعار بينما يتدهور الزخم الداخلي. تاريخيًا، كانت عملية الانتقال من تراجعات سطحية إلى انخفاضات مستمرة أكثر دلالة من أي شمعة حمراء واحدة.
يضيف المشهد الكلي (الماكرو) طبقة أخرى. تعمل بيتكوين الآن ضمن سوق تتشكل ملامحه من خلال السيولة العالمية، والتدفقات المؤسسية، والظروف المالية، وشهية المخاطر. تُعد الانخفاضات التاريخية مرجعًا لا جدولًا زمنيًا. لا يمكن ببساطة إسقاط هبوط بنسبة 70% من دورة سابقة على الدورة التالية. والسؤال الأفضل هو ما إذا كان الطلب قادرًا على الاستمرار في امتصاص العرض قرب التقييمات القياسية. #تحليل_سعر_بيتكوين# #رؤى_ماكرو#
سجّل الدخول لاستكشاف المزيد من المُحتوى