

I am doing this analysis long time ego and I found that we need to see the higher time frame and analysis to make well predictions at lower time frame… For that I open 1D $BTC chart and did this analysis that you can see below…
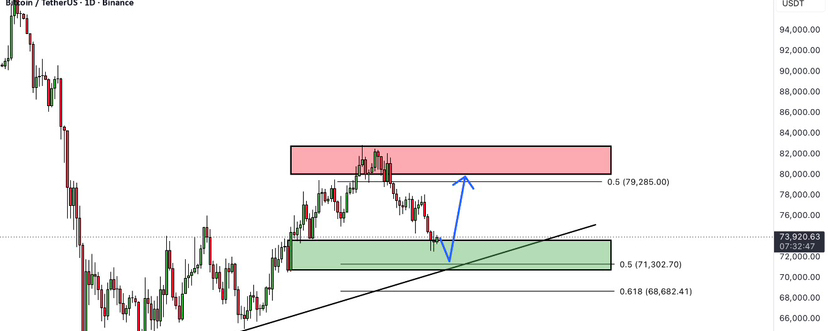
After an impressive recovery from the recent lows, Bitcoin pushed aggressively toward the $82,000 region. However, sellers stepped in at that level and rejected the move, preventing bulls from securing a clean breakout. Since then, the market has entered a healthy pullback phase rather than showing signs of major weakness.
What makes the current area so important is the strong technical confluence forming underneath price.
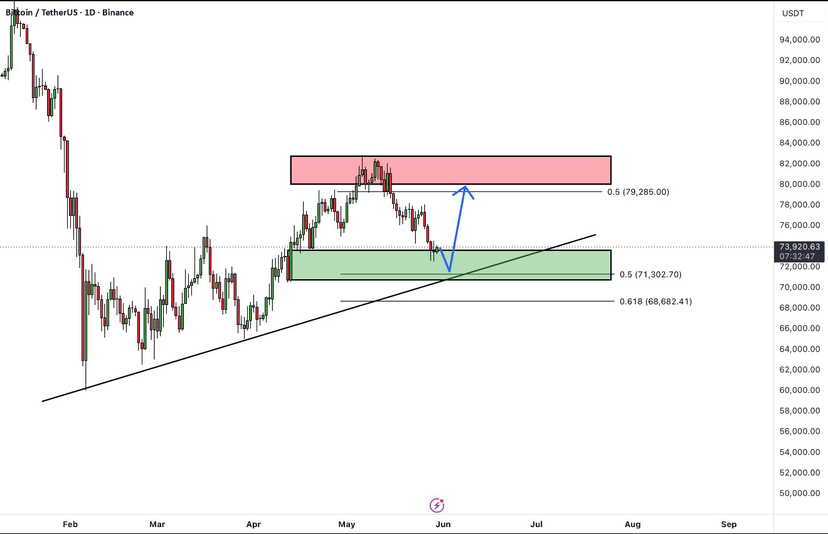
First, Bitcoin is sitting inside a well-established demand zone where buyers have previously shown strong interest. Second, the rising trendline that has supported the entire recovery structure continues to hold, keeping the broader uptrend intact. Third, the market is testing the 50% Fibonacci retracement level around $71,300, a level that often acts as a key battleground between buyers and sellers.
When multiple technical factors align in one region, that area becomes significantly more important. Right now, Bitcoin is trading inside one of those zones.
If buyers successfully defend this support region, the market could spend some time consolidating, collecting liquidity, and building strength before making another attempt toward the $80,000-$82,000 resistance area. A successful move above that resistance could shift momentum strongly back in favor of the bulls.
On the other hand, traders should remain cautious. A confirmed daily close below the ascending trendline and the current support zone would weaken the bullish structure and increase the probability of a deeper correction before the next major move higher.
For now, all eyes remain on this support area. The next reaction here could determine Bitcoin’s direction for the coming weeks.
What do you think happens next bounce from support or deeper correction? Let me know your view below. 👇