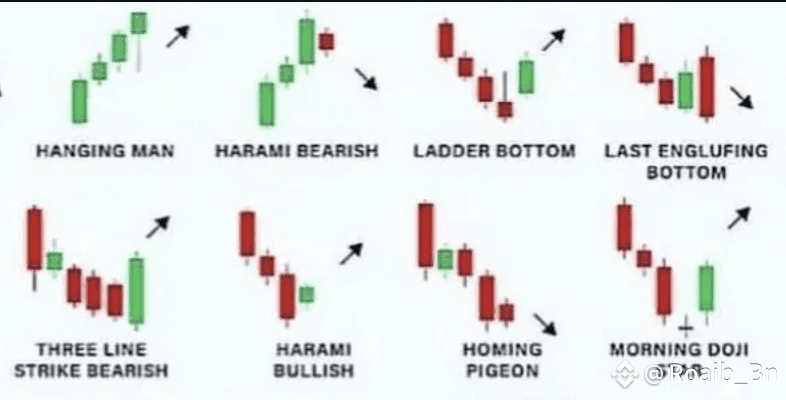
🔻 Bearish Reversal Patterns
🟢 Hanging Man
Appears after an uptrend
Small body with a long lower wick
Suggests selling pressure is increasing
🟢 Harami Bearish
Small red candle inside the previous green candle
Indicates weakening bullish momentum
---
🔼 Bullish Reversal Patterns
🔴 Ladder Bottom
Series of red candles followed by small green candles
Ends with a strong green breakout
Signals a potential bottom
🔴 Last Engulfing Bottom
A red candle engulfs a small green one at the bottom
Can signal a sharp bullish reversal
🔴 Three Line Strike Bearish (Bullish Outcome)
3 red candles followed by one big green candle
Reverses the downtrend
🔴 Harami Bullish
Small green candle inside a red candle
Suggests possible trend reversal upward
🔴 Homing Pigeon
Two red candles, second smaller inside the first
Appears at the end of a downtrend
🔴 Morning Doji Star
Red candle → Doji → Strong green candle
Powerful bottom reversal signal
---
🧠 Tip:
✅ Combine these patterns with support/resistance levels and volume
✅ Wait for confirmation before entering the trade
✅ Always use stop-loss to manage risk
Here is the candles image 👇
💹 Save this post as a quick reference. Spot patterns.
#WhiteHouseDigitalAssetReport #FOMCMeeting #EthereumTurns10 #ETHCorporateReserves #BinanceHODLerTree