
I personally developed these two indicators to measure dominance momentum and exhaustion with high precision.
If you're trying to predict the next Altseason, this post breaks down two powerful custom indicators designed to track Bitcoin Dominance momentum and exhaustion like never before.
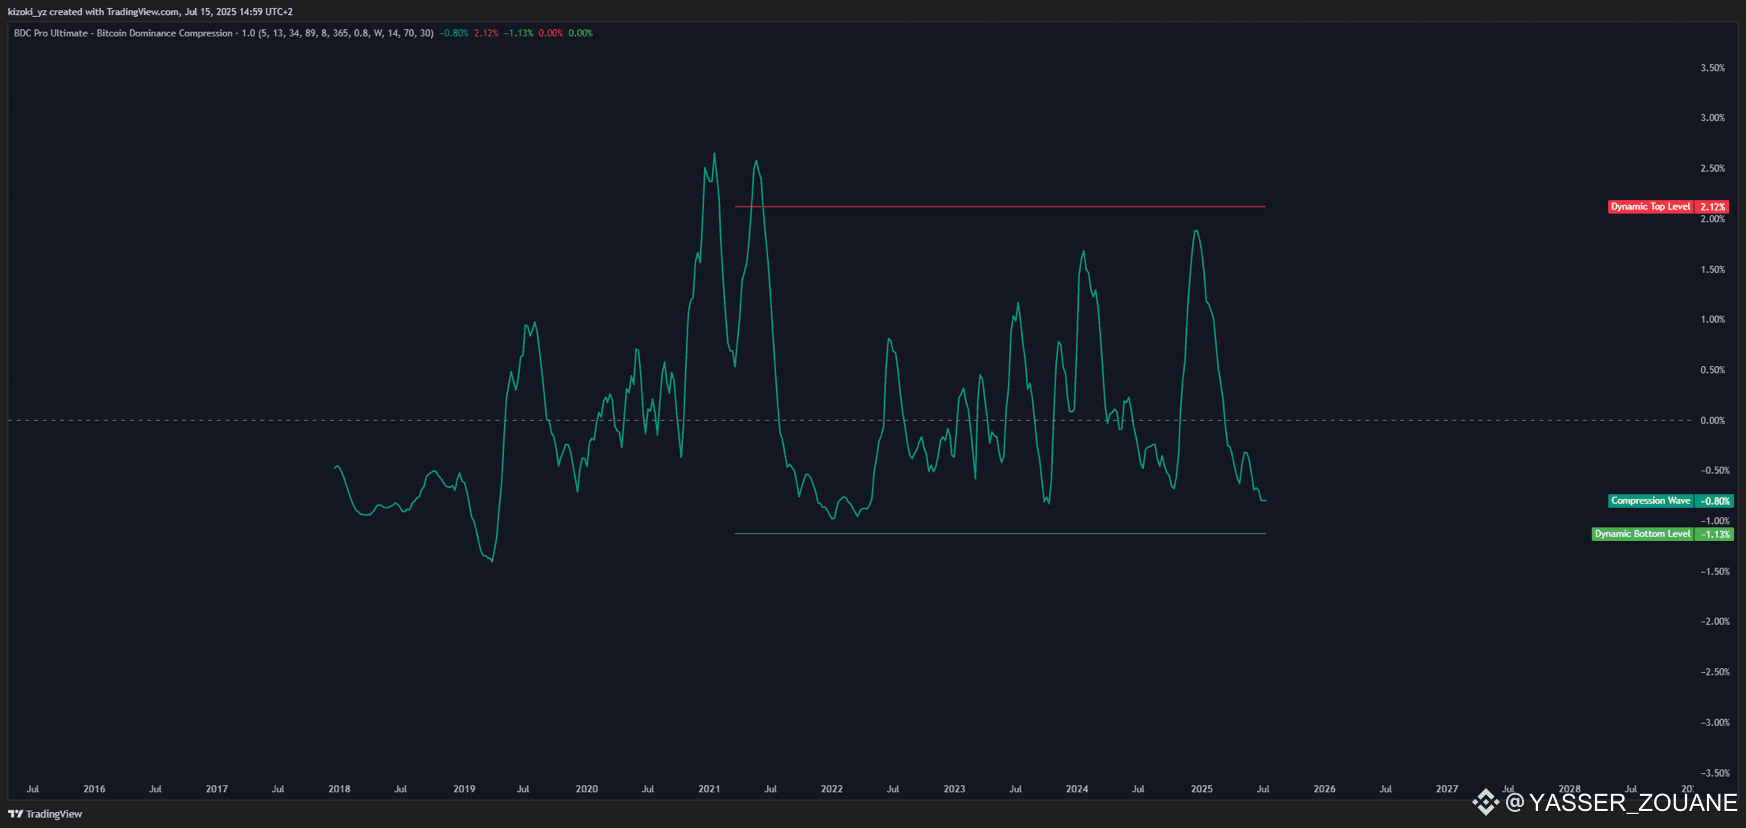
BDC Pro Ultimate – Bitcoin Dominance Compression🔹 Overview: This indicator analyzes the volatility of Bitcoin dominance and measures compression, identifying dynamic top and bottom zones.
Main Components:
Uses multiple EMAs to smooth the trend.
Calculates a “Compression Wave” using short-to-long volatility ratio.
Dynamic top/bottom levels are derived from a % of the 365-day high/low.
RSI Multi-Timeframe (MTF) confirmation for signal validation.
Alerts when:
finalWave crosses topLevel with RSI confirmation ⟶ 🔴 Potential Top
finalWave drops below bottomLevelwith confirmation ⟶ 🟢 Potential Bottom
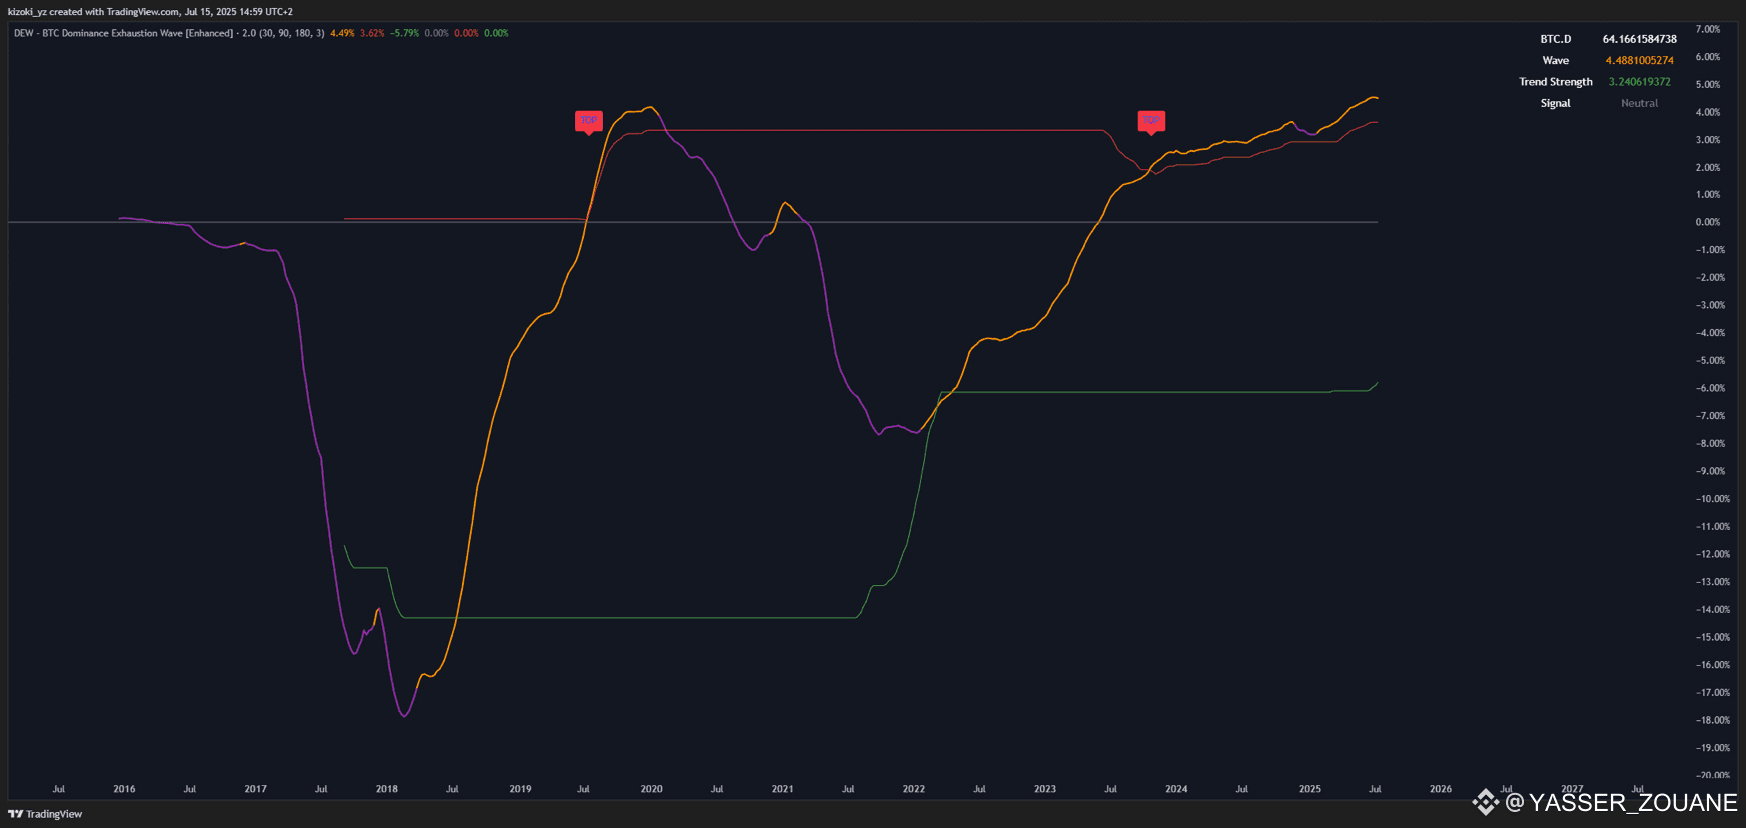
DEW – BTC Dominance Exhaustion Wave [Enhanced]🔹 Overview: This indicator tracks exhaustion in dominance via a filtered momentum wave.
Main Components:
Derives a cumulative delta (cum delta) wave of BTC dominance filtered through short & long EMAs.
Top/Bottom zones based on 180-day high/low × 0.8.
Signals TOP/BOTTOM once thresholds are breached with candle confirmation.
Calculates Trend Strength (positive ⟶ bullish, negative ⟶ bearish).
Displays a dashboard showing:
Current dominance value
Wave status
Trend Strength
Current signal (TOP / BOTTOM / Neutral)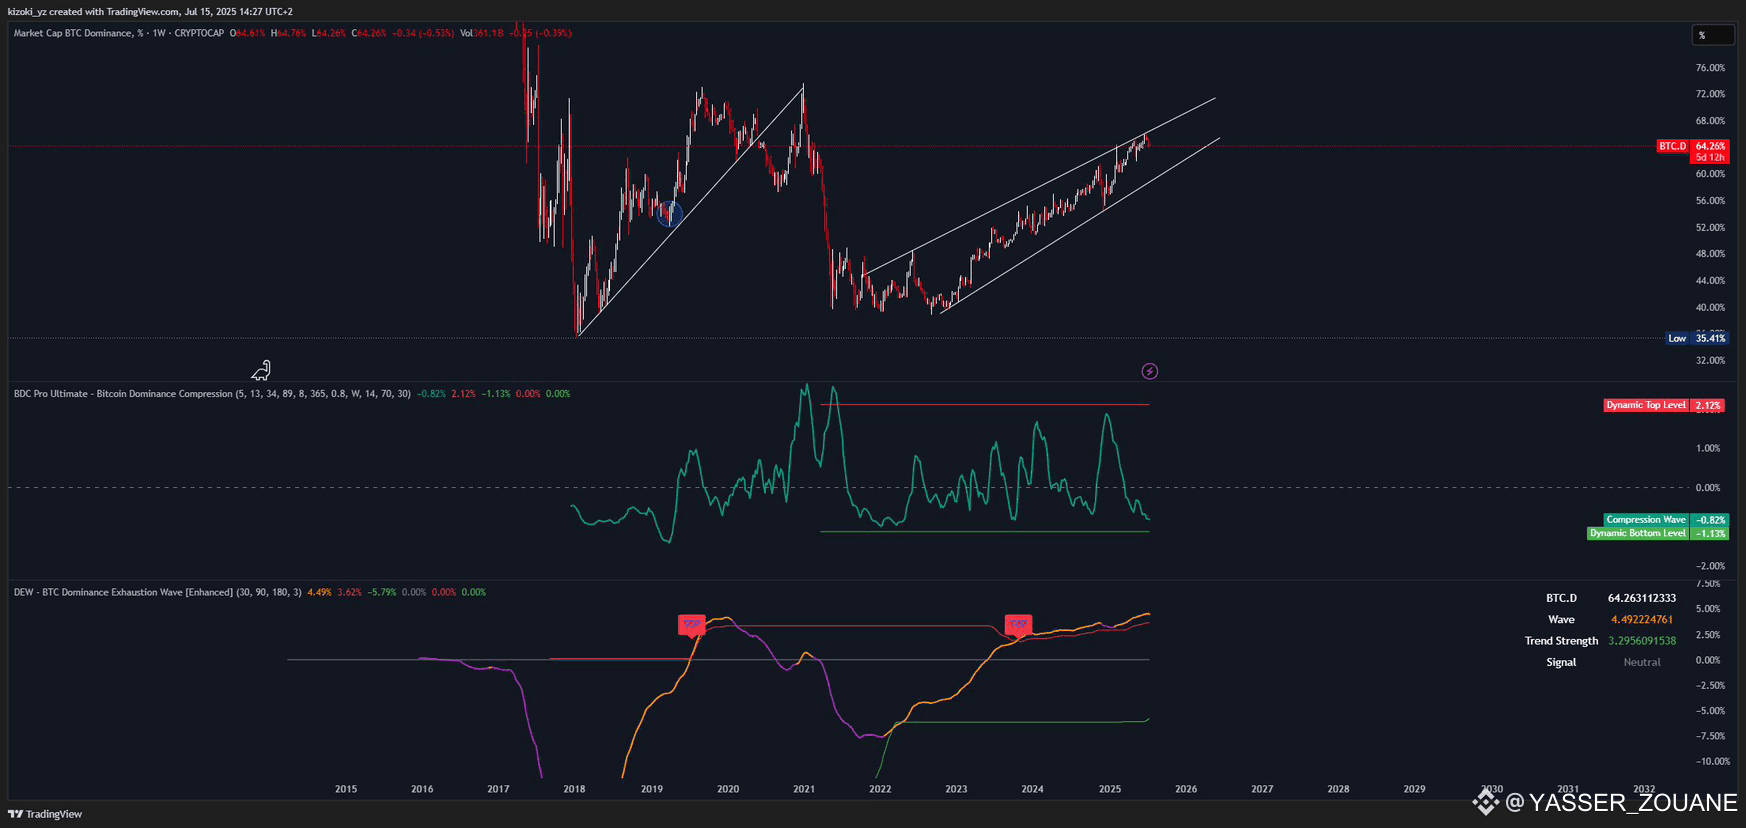
🧠 Current Analysis Based on Both Indicators + Chart
🔺 BDC Pro Ultimate: BTC Dominance is currently 64.26%, inside an ascending channel on the weekly timeframe. Compression Wave = -0.82, which is very close to the dynamic low threshold (-1.13). No direct 🔴 TOP or 🟢 BOTTOM signal at the moment, but the wave is in low-pressure zones, suggesting dominance is losing momentum. ✅ This acts as an early signal for a potential upcoming trend shift.
🔻 DEW – Dominance Exhaustion Wave: Wave = 4.49, which is very high, confirming significant dominance exhaustion. Trend Strength = 3.29, meaning the trend is still strong but possibly nearing its end. Two previous “TOP” signals were seen in 2019 and 2024, and the wave is now approaching those historical levels. ✅ Indicates we may be in a bullish exhaustion zone, which often precedes an Altseason.

🧩 Conclusion: 📌 Both indicators point to a shared scenario:
The trend is still upward in dominance.
But compression and exhaustion signals suggest we are approaching a BTC dominance peak.
This could be the prelude to Altseason if dominance begins to break downward.
🟢 Technical Recommendation:
Watch for a break below the ascending channel on the main chart.
Pay attention if Compression Wave falls below -1.13 with RSI confirmation ⟶ indicates strong weakness.
A first real breakdown below 60% BTC.D could be the official start of Altseason.
CODE SCRIPT IN TRADINGVIEW 🔻BDC Pro Ultimate:

//@version=6
indicator("BDC Pro Ultimate – Bitcoin Dominance Compression", overlay=false, max_lines_count=500)
// === User Inputs ===
lengthShortEMA = input.int(5, "Short EMA Length", minval=1)
lengthMidEMA = input.int(13, "Mid EMA Length", minval=1)
lengthLongEMA = input.int(34, "Long EMA Length", minval=1)
lengthVolEMA = input.int(89, "Vol Ratio Long EMA", minval=1)
smoothWave = input.int(8, "Wave Smoothing EMA", minval=1)
percentileLen = input.int(365, "Dynamic Level Period", minval=10)
levelFactor = input.float(0.8, "Level Factor", step=0.05)
mtfTimeframe = input.timeframe('W', "Multi-Timeframe Confirmation")
rsiLength = input.int(14, "RSI Length", minval=1)
overboughtLevel = input.int(70, "RSI Overbought Level", minval=50, maxval=100)
oversoldLevel = input.int(30, "RSI Oversold Level", minval=0, maxval=50)
// === 1. BTC.D Data ===
btcDom = request.security("CRYPTOCAP:BTC.D", "D", close)
// === 2. Daily Delta & Absolute ===
delta = btcDom - btcDom[1]
absDelta = math.abs(delta)
// === 3. Multi-Level EMA Filter ===
ema1 = ta.ema(absDelta, lengthShortEMA)
ema2 = ta.ema(ema1, lengthMidEMA)
ema3 = ta.ema(ema2, lengthLongEMA)
// === 4. Compression Ratio ===
shortVol = ema1
longVol = ta.ema(ema3, lengthVolEMA)
compressionRatio = shortVol / longVol
// === 5. Normalize to Wave ===
meanCR = ta.sma(compressionRatio, 50)
stdCR = ta.stdev(compressionRatio, 50)
rawWave = (compressionRatio - meanCR) / stdCR
finalWave = ta.ema(rawWave, smoothWave)
// === 6. Dynamic Levels ===
highLevel = ta.highest(finalWave, percentileLen)
lowLevel = ta.lowest(finalWave, percentileLen)
topLevel = highLevel * levelFactor
bottomLevel = lowLevel * levelFactor
// === 7. MTF Confirmation ===
tfWave = request.security("CRYPTOCAP:BTC.D", mtfTimeframe, finalWave)
rsiBtcDom = ta.rsi(btcDom, rsiLength)
tfRsi = request.security("CRYPTOCAP:BTC.D", mtfTimeframe, rsiBtcDom)
// === 8. Signal Conditions ===
topSignal = finalWave > topLevel and finalWave[1] <= topLevel and tfWave > topLevel and tfRsi > overboughtLevel
bottomSignal = finalWave < bottomLevel and finalWave[1] >= bottomLevel and tfWave < bottomLevel and tfRsi < oversoldLevel
// === 9. Plotting ===
plot(finalWave, title="Compression Wave", color=color.new(color.teal, 0), linewidth=2)
hline(0, title="Zero Base", color=color.gray)
plot(topLevel, title="Dynamic Top Level", color=color.red, linewidth=1)
plot(bottomLevel, title="Dynamic Bottom Level", color=color.green, linewidth=1)
// === 10. Signals & Alerts ===
plotshape(topSignal, title="🔴 TOP", location=location.top, style=shape.labeldown, text="TOP", color=color.red, size=size.normal)
plotshape(bottomSignal, title="🟢 BOT", location=location.bottom, style=shape.labelup, text="BOT", color=color.green, size=size.normal)
bgcolor(topSignal ? color.new(color.red, 90) : na)
bgcolor(bottomSignal ? color.new(color.green, 90) : na)
alertcondition(topSignal, title="BDC Pro Top Alert", message="BDC Pro Ultimate: Possible dominance top confirmed by MTF wave and RSI")
alertcondition(bottomSignal, title="BDC Pro Bottom Alert", message="BDC Pro Ultimate: Possible dominance bottom confirmed by MTF wave and RSI")
// === 11. Status Label ===
var label statusLabel = na
CODE SCRIPT IN TRADINGVIEW🔻 DEW – Dominance Exhaustion Wave:
//@version=6
indicator("DEW - BTC Dominance Exhaustion Wave [Enhanced]", overlay=false)
// User Inputs
lengthShortEMA = input.int(30, "Short EMA Length", minval=10, maxval=100)
lengthLongEMA = input.int(90, "Long EMA Length", minval=50, maxval=200)
lookbackPeriod = input.int(180, "Lookback Period", minval=50, maxval=500)
signalConfirmationBars = input.int(3, "Signal Confirmation Bars", minval=1, maxval=10)
showTable = input.bool(true, "Show Metrics Table")
// Fetch BTC Dominance data with daily timeframe
btcDom = request.security("CRYPTOCAP:BTC.D", "D", close)
// Daily difference
delta = btcDom - btcDom[1]
// Filtered cumulative wave
raw_wave = ta.cum(delta)
wave = ta.ema(raw_wave, lengthShortEMA) - ta.ema(raw_wave, lengthLongEMA)
// Dynamic saturation zones
topLevel = ta.highest(wave, lookbackPeriod) * 0.8
bottomLevel = ta.lowest(wave, lookbackPeriod) * 0.8
// Signal confirmation logic
waveHighest = ta.highest(wave, signalConfirmationBars)
waveLowest = ta.lowest(wave, signalConfirmationBars)
topSignalRaw = ta.crossover(wave, topLevel)
bottomSignalRaw = ta.crossunder(wave, bottomLevel)
topSignal = topSignalRaw and waveHighest == wave
bottomSignal = bottomSignalRaw and waveLowest == wave
// Trend strength (based on wave slope)
waveSlope = wave - wave[1]
trendStrength = ta.ema(waveSlope, 14) * 100
// Dynamic color for wave based on trend strength
waveColor = trendStrength > 0 ? color.new(color.orange, 0) : color.new(color.purple, 0)
// Plotting
plot(wave, title="Dominance Exhaustion Wave", color=waveColor, linewidth=2)
plot(topLevel, title="Top Zone", color=color.red, linewidth=1)
plot(bottomLevel, title="Bottom Zone", color=color.green, linewidth=1)
plot(0, title="Zero Line", color=color.gray, linewidth=1)
// Visual signals
plotshape(topSignal, title="🔴 BTC.D Top", location=location.top, color=color.red, style=shape.labeldown, text="TOP", size=size.small)
plotshape(bottomSignal, title="🟢 BTC.D Bottom", location=location.bottom, color=color.green, style=shape.labelup, text="BOTTOM", size=size.small)
// Table display
if showTable
var table t = table.new(position.top_right, 3, 4, border_width=1)
table.cell(t, 0, 0, "BTC.D", text_color=color.white)
table.cell(t, 1, 0, str.tostring(btcDom), text_color=color.white)
table.cell(t, 0, 1, "Wave", text_color=color.white)
table.cell(t, 1, 1, str.tostring(wave), text_color=waveColor)
table.cell(t, 0, 2, "Trend Strength", text_color=color.white)
table.cell(t, 1, 2, str.tostring(trendStrength), text_color=trendStrength > 0 ? color.green : color.red)
table.cell(t, 0, 3, "Signal", text_color=color.white)
table.cell(t, 1, 3, topSignal ? "TOP" : bottomSignal ? "BOTTOM" : "Neutral", text_color=topSignal ? color.red : bottomSignal ? color.green : color.gray)
// Alert conditions
alertcondition(topSignal, title="BTC Dominance Top Signal", message="BTC Dominance reached TOP zone!")
alertcondition(bottomSignal, title="BTC Dominance Bottom Signal", message="BTC Dominance reached BOTTOM zone!")
Enjoy 😉✨
