
#poscoandlgcnscompletereceivablestokenizationpilotoninjective
poscoandlgcnscompletereceivablestokenizationpilotoninjective
رائج
جديد

·
--
مقالة
عرض الترجمة
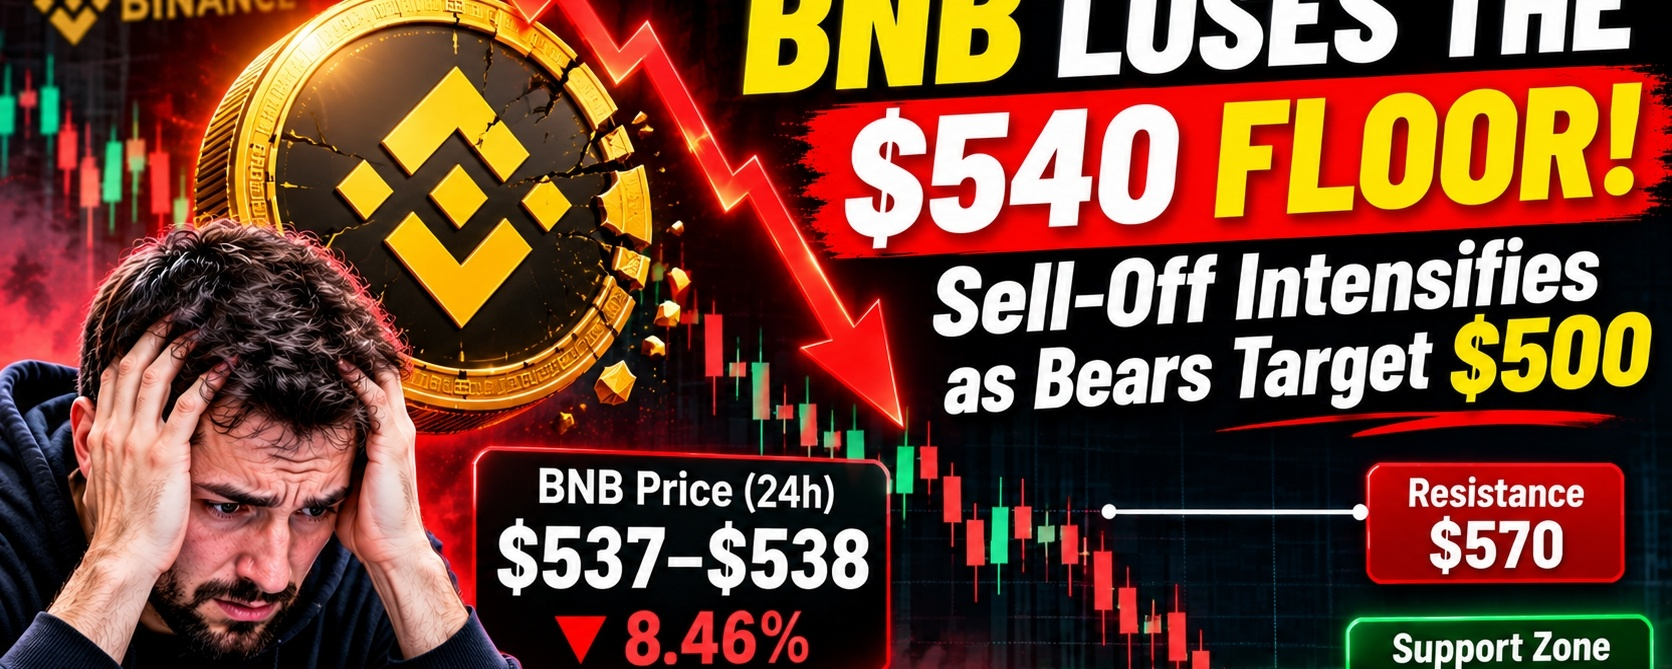
🚨 BNB Loses the $540 Floor: Sell-Off Intensifies as Bears Target the $500 Demand Zone 📉#BNBDropsBelow540USDTWith8.46%DailyDecline
## 🔥 Introduction: The Sell-Off Just Got Real
The pressure on **BNB** is increasing. The token has **lost the $540 USDT psychological floor**, sliding **8.46% over the last 24 hours** to hover near **$537 to $538**. 😟
For traders who watched BNB hold up better than many altcoins earlier, this is a notable shift. A breakdown of a round-number level like $540 often changes the mood of the market quickly. ⚠️
---
## 📊 How We Got Here: Weeks of Steady Pressure
This move did not come out of nowhere. For weeks, **bears have been chipping away at support**, pushing BNB lower step by step. 🐻
- 🔻 **Late-October high:** near **$759**
- 🔻 **Current price:** around **$537 to $538**
- 🔻 **Total drop from the high:** roughly **29%**
- 🔻 **Moving averages:** price has cut down through every major one
When a token falls through all of its major moving averages, it usually shows that trend strength has shifted firmly to the sellers. 📉 Each failed bounce along the way has added to the downward momentum.
---
## 💥 Why the $540 Break Matters
Round numbers like $540 act as **psychological floors**. Many traders place buy orders, stop-losses and alerts around them. 🎯
Once $540 cracked, two things started to happen:
1. **⚡ Leverage is getting flushed.** Over-leveraged long positions get liquidated, which adds forced selling on top of regular selling.
2. **😰 Panic is creeping into the order books.** As price drops quickly, more traders rush for the exit, which can deepen the move.
This kind of chain reaction is common in crypto: a key level breaks, liquidations trigger, and the price overshoots before it stabilizes. 🌪️
---
## 🧭 The Game Plan: Key Levels to Watch
### 📉 Support: The $500 to $503 Demand Zone
The **$500 to $503 area** is being described as the **final line in the sand**. 🛡️ This is where buyers are expected to step in, since it combines a major round number with a previous demand zone.
If buyers fail to defend it, things could get **messy fast**. A clean break below $500 could open the door to deeper losses and trigger another wave of liquidations. ⚠️
### 📈 Resistance: The $570 Reclaim
On the upside, bulls need a **clean reclaim above $570** just to **pause the bleeding**. 🐂 Note that this is not a bullish signal by itself. It would only slow the downtrend and show that buyers are returning.
---
## 🛡️ Risk Management: Don't Catch a Falling Knife
Sharp drops tempt many traders into trying to buy the bottom. The advice here is clear: **do not try to catch a falling knife with high leverage.** 🔪
A safer approach looks like this:
- ⏳ **Let the liquidation wicks settle.** Wait for the chaos to calm down.
- ✅ **Wait for a confirmed higher low on the 4H chart.** This shows sellers are losing control.
- 🪜 **Keep spot entries staggered.** Scaling in at different levels reduces the risk of a bad single entry.
Using high leverage in a volatile market can wipe out an account in minutes, even if your overall idea turns out to be right. 💸
---
## 🌍 The Bigger Market Picture
BNB's decline is happening alongside broader weakness in crypto, with Bitcoin slipping below $60,000 and US stocks under pressure. 🌐 When the whole market is risk-off, even large, established tokens like BNB find it hard to hold key levels. 📉
That means traders should watch not only BNB's chart but also **Bitcoin's direction and overall market sentiment**. 👀
---
## 🧠 What Should Traders Watch Next?
1. **🎯 The $500 to $503 zone:** the most important support to monitor.
2. **📈 The $570 level:** a reclaim would be the first sign of stabilization.
3. **📊 4H chart structure:** look for a confirmed higher low before considering entries.
4. **₿ Bitcoin's price action:** BNB usually follows the broader market.
5. **🛡️ Position sizing:** keep leverage low and risk small during high volatility.
---
## 📝 Final Thoughts
Volatility shakes out impatient hands, but it also creates some of the cleanest entry opportunities for **disciplined traders**. 💡 For BNB, the next few sessions will show whether the **$500 to $503 zone** can hold or whether bears will push deeper.
The best approach right now is patience: avoid emotional trades, respect key levels and let the market confirm its direction before acting. 🧘
> ⚠️ *Disclaimer: This article is for informational purposes only and is not financial advice. Cryptocurrency markets are highly volatile. Always do your own research before trading or investing.*
---
### 🏷️ #POSCOAndLGCNSCompleteReceivablesTokenizationPilotOnInjective #HKBillProposesHK$100KFineForUnauthorizedCryptoTitles #StrategyReports$35BNetReserves #BitMineFaces$10.1BUnrealizedETHLoss
**#BNB #CryptoNews #Binance #CryptoMarket #TradingStrategy**
---
🚨 BNB Loses the $540 Floor: Sell-Off Intensifies as Bears Target the $500 Demand Zone 📉
#BNBDropsBelow540USDTWith8.46%DailyDecline
## 🔥 Introduction: The Sell-Off Just Got Real
The pressure on **BNB** is increasing. The token has **lost the $540 USDT psychological floor**, sliding **8.46% over the last 24 hours** to hover near **$537 to $538**. 😟
For traders who watched BNB hold up better than many altcoins earlier, this is a notable shift. A breakdown of a round-number level like $540 often changes the mood of the market quickly. ⚠️
---
## 📊 How We Got Here: Weeks of Steady Pressure
This move did not come out of nowhere. For weeks, **bears have been chipping away at support**, pushing BNB lower step by step. 🐻
- 🔻 **Late-October high:** near **$759**
- 🔻 **Current price:** around **$537 to $538**
- 🔻 **Total drop from the high:** roughly **29%**
- 🔻 **Moving averages:** price has cut down through every major one
When a token falls through all of its major moving averages, it usually shows that trend strength has shifted firmly to the sellers. 📉 Each failed bounce along the way has added to the downward momentum.
---
## 💥 Why the $540 Break Matters
Round numbers like $540 act as **psychological floors**. Many traders place buy orders, stop-losses and alerts around them. 🎯
Once $540 cracked, two things started to happen:
1. **⚡ Leverage is getting flushed.** Over-leveraged long positions get liquidated, which adds forced selling on top of regular selling.
2. **😰 Panic is creeping into the order books.** As price drops quickly, more traders rush for the exit, which can deepen the move.
This kind of chain reaction is common in crypto: a key level breaks, liquidations trigger, and the price overshoots before it stabilizes. 🌪️
---
## 🧭 The Game Plan: Key Levels to Watch
### 📉 Support: The $500 to $503 Demand Zone
The **$500 to $503 area** is being described as the **final line in the sand**. 🛡️ This is where buyers are expected to step in, since it combines a major round number with a previous demand zone.
If buyers fail to defend it, things could get **messy fast**. A clean break below $500 could open the door to deeper losses and trigger another wave of liquidations. ⚠️
### 📈 Resistance: The $570 Reclaim
On the upside, bulls need a **clean reclaim above $570** just to **pause the bleeding**. 🐂 Note that this is not a bullish signal by itself. It would only slow the downtrend and show that buyers are returning.
---
## 🛡️ Risk Management: Don't Catch a Falling Knife
Sharp drops tempt many traders into trying to buy the bottom. The advice here is clear: **do not try to catch a falling knife with high leverage.** 🔪
A safer approach looks like this:
- ⏳ **Let the liquidation wicks settle.** Wait for the chaos to calm down.
- ✅ **Wait for a confirmed higher low on the 4H chart.** This shows sellers are losing control.
- 🪜 **Keep spot entries staggered.** Scaling in at different levels reduces the risk of a bad single entry.
Using high leverage in a volatile market can wipe out an account in minutes, even if your overall idea turns out to be right. 💸
---
## 🌍 The Bigger Market Picture
BNB's decline is happening alongside broader weakness in crypto, with Bitcoin slipping below $60,000 and US stocks under pressure. 🌐 When the whole market is risk-off, even large, established tokens like BNB find it hard to hold key levels. 📉
That means traders should watch not only BNB's chart but also **Bitcoin's direction and overall market sentiment**. 👀
---
## 🧠 What Should Traders Watch Next?
1. **🎯 The $500 to $503 zone:** the most important support to monitor.
2. **📈 The $570 level:** a reclaim would be the first sign of stabilization.
3. **📊 4H chart structure:** look for a confirmed higher low before considering entries.
4. **₿ Bitcoin's price action:** BNB usually follows the broader market.
5. **🛡️ Position sizing:** keep leverage low and risk small during high volatility.
---
## 📝 Final Thoughts
Volatility shakes out impatient hands, but it also creates some of the cleanest entry opportunities for **disciplined traders**. 💡 For BNB, the next few sessions will show whether the **$500 to $503 zone** can hold or whether bears will push deeper.
The best approach right now is patience: avoid emotional trades, respect key levels and let the market confirm its direction before acting. 🧘
> ⚠️ *Disclaimer: This article is for informational purposes only and is not financial advice. Cryptocurrency markets are highly volatile. Always do your own research before trading or investing.*
---
### 🏷️ #POSCOAndLGCNSCompleteReceivablesTokenizationPilotOnInjective #HKBillProposesHK$100KFineForUnauthorizedCryptoTitles #StrategyReports$35BNetReserves #BitMineFaces$10.1BUnrealizedETHLoss
**#BNB #CryptoNews #Binance #CryptoMarket #TradingStrategy**
---
## 🔥 Introduction: The Sell-Off Just Got Real
The pressure on **BNB** is increasing. The token has **lost the $540 USDT psychological floor**, sliding **8.46% over the last 24 hours** to hover near **$537 to $538**. 😟
For traders who watched BNB hold up better than many altcoins earlier, this is a notable shift. A breakdown of a round-number level like $540 often changes the mood of the market quickly. ⚠️
---
## 📊 How We Got Here: Weeks of Steady Pressure
This move did not come out of nowhere. For weeks, **bears have been chipping away at support**, pushing BNB lower step by step. 🐻
- 🔻 **Late-October high:** near **$759**
- 🔻 **Current price:** around **$537 to $538**
- 🔻 **Total drop from the high:** roughly **29%**
- 🔻 **Moving averages:** price has cut down through every major one
When a token falls through all of its major moving averages, it usually shows that trend strength has shifted firmly to the sellers. 📉 Each failed bounce along the way has added to the downward momentum.
---
## 💥 Why the $540 Break Matters
Round numbers like $540 act as **psychological floors**. Many traders place buy orders, stop-losses and alerts around them. 🎯
Once $540 cracked, two things started to happen:
1. **⚡ Leverage is getting flushed.** Over-leveraged long positions get liquidated, which adds forced selling on top of regular selling.
2. **😰 Panic is creeping into the order books.** As price drops quickly, more traders rush for the exit, which can deepen the move.
This kind of chain reaction is common in crypto: a key level breaks, liquidations trigger, and the price overshoots before it stabilizes. 🌪️
---
## 🧭 The Game Plan: Key Levels to Watch
### 📉 Support: The $500 to $503 Demand Zone
The **$500 to $503 area** is being described as the **final line in the sand**. 🛡️ This is where buyers are expected to step in, since it combines a major round number with a previous demand zone.
If buyers fail to defend it, things could get **messy fast**. A clean break below $500 could open the door to deeper losses and trigger another wave of liquidations. ⚠️
### 📈 Resistance: The $570 Reclaim
On the upside, bulls need a **clean reclaim above $570** just to **pause the bleeding**. 🐂 Note that this is not a bullish signal by itself. It would only slow the downtrend and show that buyers are returning.
---
## 🛡️ Risk Management: Don't Catch a Falling Knife
Sharp drops tempt many traders into trying to buy the bottom. The advice here is clear: **do not try to catch a falling knife with high leverage.** 🔪
A safer approach looks like this:
- ⏳ **Let the liquidation wicks settle.** Wait for the chaos to calm down.
- ✅ **Wait for a confirmed higher low on the 4H chart.** This shows sellers are losing control.
- 🪜 **Keep spot entries staggered.** Scaling in at different levels reduces the risk of a bad single entry.
Using high leverage in a volatile market can wipe out an account in minutes, even if your overall idea turns out to be right. 💸
---
## 🌍 The Bigger Market Picture
BNB's decline is happening alongside broader weakness in crypto, with Bitcoin slipping below $60,000 and US stocks under pressure. 🌐 When the whole market is risk-off, even large, established tokens like BNB find it hard to hold key levels. 📉
That means traders should watch not only BNB's chart but also **Bitcoin's direction and overall market sentiment**. 👀
---
## 🧠 What Should Traders Watch Next?
1. **🎯 The $500 to $503 zone:** the most important support to monitor.
2. **📈 The $570 level:** a reclaim would be the first sign of stabilization.
3. **📊 4H chart structure:** look for a confirmed higher low before considering entries.
4. **₿ Bitcoin's price action:** BNB usually follows the broader market.
5. **🛡️ Position sizing:** keep leverage low and risk small during high volatility.
---
## 📝 Final Thoughts
Volatility shakes out impatient hands, but it also creates some of the cleanest entry opportunities for **disciplined traders**. 💡 For BNB, the next few sessions will show whether the **$500 to $503 zone** can hold or whether bears will push deeper.
The best approach right now is patience: avoid emotional trades, respect key levels and let the market confirm its direction before acting. 🧘
> ⚠️ *Disclaimer: This article is for informational purposes only and is not financial advice. Cryptocurrency markets are highly volatile. Always do your own research before trading or investing.*
---
### 🏷️ #POSCOAndLGCNSCompleteReceivablesTokenizationPilotOnInjective #HKBillProposesHK$100KFineForUnauthorizedCryptoTitles #StrategyReports$35BNetReserves #BitMineFaces$10.1BUnrealizedETHLoss
**#BNB #CryptoNews #Binance #CryptoMarket #TradingStrategy**
---
1
·
--
مقالة
عرض الترجمة
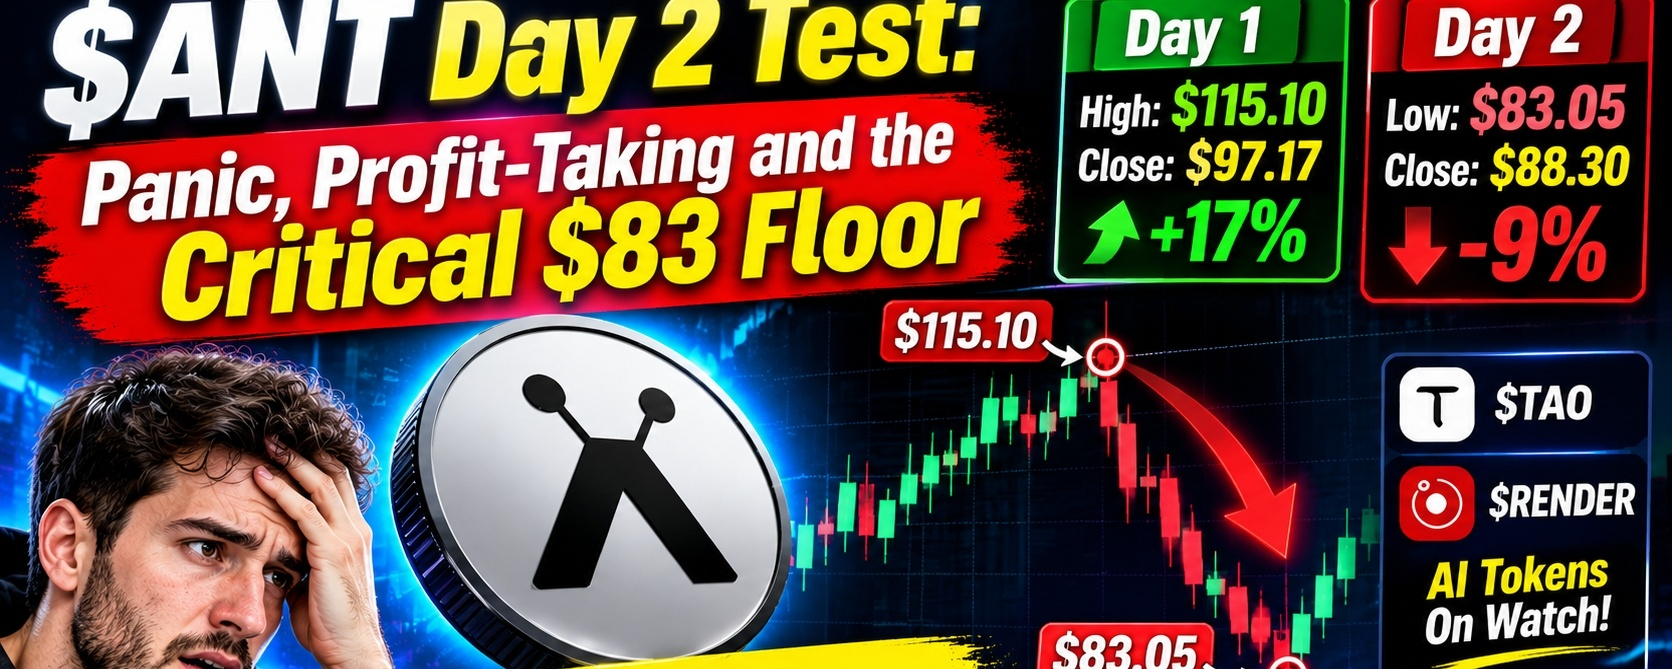
🐜 $ANT Day 2 Test: Panic, Profit-Taking and the Critical $83 Floor 📊#AnthropicPlungesTowardIPOPriceonDay2
## 🔥 Introduction: From Hero to Doubt in 48 Hours
New token listings often follow the same emotional script. Day 1 brings excitement, and Day 2 brings reality. 🎢
**$ANT** just lived through both. On its first day, the token was celebrated like a hero. By the second day, many traders were calling it a crash. But a closer look at the numbers tells a more nuanced story. 👀
---
## 🚀 Day 1: Hype, FOMO and a Wild Ride
Here is how the first trading day unfolded:
- 🟢 **Listing price:** $83
- 🟢 **Opening price:** $111.50
- 🟢 **Day 1 high:** $115.10
- 🟢 **Day 1 close:** $97.17
The token opened **well above its listing price** and pushed to a high of **$115.10**, a gain of nearly **39% over the $83 listing level**. 🔥 Even after pulling back, it closed Day 1 at **$97.17, still about 17% above its listing price**.
Day 1 was driven by **hype, FOMO and flippers**. Fast-moving new listings attract traders looking for quick profits, and the excitement can push prices far above fair value in a short time. ⚡
---
## 📉 Day 2: The Reality Check
Then Day 2 arrived, and the mood changed quickly. 😬
- 🔻 **Day 2 low:** $83.05
- 🔻 **Day 2 close:** around $88.30
- 🔻 **Daily change:** down over **9%**
The token fell hard and touched **$83.05, just five cents above its listing price**. By the close, it had recovered slightly to around **$88.30**, but the day still ended with a drop of more than 9%. Social media reacted the way it usually does after a sharp fall, with many people calling it a crash and doubting the project. 😟
---
## 🧪 Not a Failure, but a Test
The post behind this story makes a clear argument: **$ANT did not fail, it was being tested.** 🧠
According to this view, the move can be understood in three parts:
1. **💰 Early buyers took profit.** After a big Day 1 run, locking in gains is natural.
2. **🏛️ Institutions re-priced the token.** Larger players often reassess valuation once the first wave of hype settles.
3. **😰 Weak hands sold in fear.** Short-term holders with little conviction often exit on the first big dip.
This is a common pattern for new listings. The first day shows how high the price *can* go, while the second day shows where real demand *actually is*. 📚
---
## 🛡️ The $83 Floor: The Line in the Sand
The most important point in this story is the **$83 level**. 🎯
That was the listing price, and on Day 2 the token dipped to **$83.05**, almost exactly touching it, before buyers stepped in. The idea is simple:
- ✅ **If $83 holds:** buyers are defending the level, and confidence could return.
- ❌ **If $83 breaks:** fear could take control, and further downside becomes more likely.
Traders often treat a first major support level like this as a **line in the sand**. A successful defense can build confidence, while a clean break often triggers stop-losses and more selling. ⚠️ That makes the coming sessions critical for $ANT.
---
## 🤖 Other AI Tokens on the Watchlist: $TAO and $RENDER
The post also mentions two other AI-related tokens being watched alongside $ANT: **$TAO** and **$RENDER**. 👁️
Watching related tokens together is a smart habit because sector sentiment often moves as a group. If AI tokens as a whole are under pressure, a new listing can struggle to hold its ground no matter how strong the project is. 🔗
For reference, **TAOUSDT perpetual futures** were trading around **$177.07, down 6.19%**, which suggests that weakness was not limited to $ANT alone. 📉
---
## 🧠 What Should Traders Watch Next?
After a volatile start like this, many traders keep an eye on a few key things: 👀
1. **🎯 The $83 level:** the most important support to watch.
2. **📈 Volume on bounces:** strong volume on a rebound can show real buying interest.
3. **🤖 AI sector sentiment:** movements in $TAO and $RENDER can influence $ANT.
4. **🌍 Broader market mood:** crypto reacts strongly to wider market conditions.
5. **🛡️ Risk management:** new listings are highly volatile, so position sizing and stop-losses matter.
---
## 💬 The Big Question: Did You Hold or Panic Sell?
The post ends with a direct question to its readers: **"Do you still believe, or did you panic sell?"** 🤔
It's a fair question for every trader. Volatile days test your strategy and your emotions at the same time. Those who plan their entries, exits and risk in advance are far less likely to make decisions out of fear. 💪
---
## 📝 Final Thoughts
$ANT's first two days show the classic lifecycle of a new listing: an exciting spike, a sharp reality check and a key support level that now decides the next move. 🌪️ Whether $83 holds will shape the story from here.
It's worth remembering that this narrative comes from a promotional-style social post, so treat it as one opinion and not a guarantee of future performance. Stay patient, do your own research and never invest more than you can afford to lose. 💡
> ⚠️ *Disclaimer: This article is for informational purposes only and is not financial advice. Newly listed tokens are extremely volatile. Always do your own research before trading or investing.*
---
### 🏷️
**#ANT #CryptoNews #AITokens #BinanceSquare #AltcoinWatch**
#POSCOAndLGCNSCompleteReceivablesTokenizationPilotOnInjective #CryptoBilisAttackerMoves25000ETHToTornadoCash #HKBillProposesHK$100KFineForUnauthorizedCryptoTitles #StrategyReports$35BNetReserves
---
🐜 $ANT Day 2 Test: Panic, Profit-Taking and the Critical $83 Floor 📊
#AnthropicPlungesTowardIPOPriceonDay2
## 🔥 Introduction: From Hero to Doubt in 48 Hours
New token listings often follow the same emotional script. Day 1 brings excitement, and Day 2 brings reality. 🎢
**$ANT** just lived through both. On its first day, the token was celebrated like a hero. By the second day, many traders were calling it a crash. But a closer look at the numbers tells a more nuanced story. 👀
---
## 🚀 Day 1: Hype, FOMO and a Wild Ride
Here is how the first trading day unfolded:
- 🟢 **Listing price:** $83
- 🟢 **Opening price:** $111.50
- 🟢 **Day 1 high:** $115.10
- 🟢 **Day 1 close:** $97.17
The token opened **well above its listing price** and pushed to a high of **$115.10**, a gain of nearly **39% over the $83 listing level**. 🔥 Even after pulling back, it closed Day 1 at **$97.17, still about 17% above its listing price**.
Day 1 was driven by **hype, FOMO and flippers**. Fast-moving new listings attract traders looking for quick profits, and the excitement can push prices far above fair value in a short time. ⚡
---
## 📉 Day 2: The Reality Check
Then Day 2 arrived, and the mood changed quickly. 😬
- 🔻 **Day 2 low:** $83.05
- 🔻 **Day 2 close:** around $88.30
- 🔻 **Daily change:** down over **9%**
The token fell hard and touched **$83.05, just five cents above its listing price**. By the close, it had recovered slightly to around **$88.30**, but the day still ended with a drop of more than 9%. Social media reacted the way it usually does after a sharp fall, with many people calling it a crash and doubting the project. 😟
---
## 🧪 Not a Failure, but a Test
The post behind this story makes a clear argument: **$ANT did not fail, it was being tested.** 🧠
According to this view, the move can be understood in three parts:
1. **💰 Early buyers took profit.** After a big Day 1 run, locking in gains is natural.
2. **🏛️ Institutions re-priced the token.** Larger players often reassess valuation once the first wave of hype settles.
3. **😰 Weak hands sold in fear.** Short-term holders with little conviction often exit on the first big dip.
This is a common pattern for new listings. The first day shows how high the price *can* go, while the second day shows where real demand *actually is*. 📚
---
## 🛡️ The $83 Floor: The Line in the Sand
The most important point in this story is the **$83 level**. 🎯
That was the listing price, and on Day 2 the token dipped to **$83.05**, almost exactly touching it, before buyers stepped in. The idea is simple:
- ✅ **If $83 holds:** buyers are defending the level, and confidence could return.
- ❌ **If $83 breaks:** fear could take control, and further downside becomes more likely.
Traders often treat a first major support level like this as a **line in the sand**. A successful defense can build confidence, while a clean break often triggers stop-losses and more selling. ⚠️ That makes the coming sessions critical for $ANT.
---
## 🤖 Other AI Tokens on the Watchlist: $TAO and $RENDER
The post also mentions two other AI-related tokens being watched alongside $ANT: **$TAO** and **$RENDER**. 👁️
Watching related tokens together is a smart habit because sector sentiment often moves as a group. If AI tokens as a whole are under pressure, a new listing can struggle to hold its ground no matter how strong the project is. 🔗
For reference, **TAOUSDT perpetual futures** were trading around **$177.07, down 6.19%**, which suggests that weakness was not limited to $ANT alone. 📉
---
## 🧠 What Should Traders Watch Next?
After a volatile start like this, many traders keep an eye on a few key things: 👀
1. **🎯 The $83 level:** the most important support to watch.
2. **📈 Volume on bounces:** strong volume on a rebound can show real buying interest.
3. **🤖 AI sector sentiment:** movements in $TAO and $RENDER can influence $ANT.
4. **🌍 Broader market mood:** crypto reacts strongly to wider market conditions.
5. **🛡️ Risk management:** new listings are highly volatile, so position sizing and stop-losses matter.
---
## 💬 The Big Question: Did You Hold or Panic Sell?
The post ends with a direct question to its readers: **"Do you still believe, or did you panic sell?"** 🤔
It's a fair question for every trader. Volatile days test your strategy and your emotions at the same time. Those who plan their entries, exits and risk in advance are far less likely to make decisions out of fear. 💪
---
## 📝 Final Thoughts
$ANT's first two days show the classic lifecycle of a new listing: an exciting spike, a sharp reality check and a key support level that now decides the next move. 🌪️ Whether $83 holds will shape the story from here.
It's worth remembering that this narrative comes from a promotional-style social post, so treat it as one opinion and not a guarantee of future performance. Stay patient, do your own research and never invest more than you can afford to lose. 💡
> ⚠️ *Disclaimer: This article is for informational purposes only and is not financial advice. Newly listed tokens are extremely volatile. Always do your own research before trading or investing.*
---
### 🏷️
**#ANT #CryptoNews #AITokens #BinanceSquare #AltcoinWatch**
#POSCOAndLGCNSCompleteReceivablesTokenizationPilotOnInjective #CryptoBilisAttackerMoves25000ETHToTornadoCash #HKBillProposesHK$100KFineForUnauthorizedCryptoTitles #StrategyReports$35BNetReserves
---
## 🔥 Introduction: From Hero to Doubt in 48 Hours
New token listings often follow the same emotional script. Day 1 brings excitement, and Day 2 brings reality. 🎢
**$ANT** just lived through both. On its first day, the token was celebrated like a hero. By the second day, many traders were calling it a crash. But a closer look at the numbers tells a more nuanced story. 👀
---
## 🚀 Day 1: Hype, FOMO and a Wild Ride
Here is how the first trading day unfolded:
- 🟢 **Listing price:** $83
- 🟢 **Opening price:** $111.50
- 🟢 **Day 1 high:** $115.10
- 🟢 **Day 1 close:** $97.17
The token opened **well above its listing price** and pushed to a high of **$115.10**, a gain of nearly **39% over the $83 listing level**. 🔥 Even after pulling back, it closed Day 1 at **$97.17, still about 17% above its listing price**.
Day 1 was driven by **hype, FOMO and flippers**. Fast-moving new listings attract traders looking for quick profits, and the excitement can push prices far above fair value in a short time. ⚡
---
## 📉 Day 2: The Reality Check
Then Day 2 arrived, and the mood changed quickly. 😬
- 🔻 **Day 2 low:** $83.05
- 🔻 **Day 2 close:** around $88.30
- 🔻 **Daily change:** down over **9%**
The token fell hard and touched **$83.05, just five cents above its listing price**. By the close, it had recovered slightly to around **$88.30**, but the day still ended with a drop of more than 9%. Social media reacted the way it usually does after a sharp fall, with many people calling it a crash and doubting the project. 😟
---
## 🧪 Not a Failure, but a Test
The post behind this story makes a clear argument: **$ANT did not fail, it was being tested.** 🧠
According to this view, the move can be understood in three parts:
1. **💰 Early buyers took profit.** After a big Day 1 run, locking in gains is natural.
2. **🏛️ Institutions re-priced the token.** Larger players often reassess valuation once the first wave of hype settles.
3. **😰 Weak hands sold in fear.** Short-term holders with little conviction often exit on the first big dip.
This is a common pattern for new listings. The first day shows how high the price *can* go, while the second day shows where real demand *actually is*. 📚
---
## 🛡️ The $83 Floor: The Line in the Sand
The most important point in this story is the **$83 level**. 🎯
That was the listing price, and on Day 2 the token dipped to **$83.05**, almost exactly touching it, before buyers stepped in. The idea is simple:
- ✅ **If $83 holds:** buyers are defending the level, and confidence could return.
- ❌ **If $83 breaks:** fear could take control, and further downside becomes more likely.
Traders often treat a first major support level like this as a **line in the sand**. A successful defense can build confidence, while a clean break often triggers stop-losses and more selling. ⚠️ That makes the coming sessions critical for $ANT.
---
## 🤖 Other AI Tokens on the Watchlist: $TAO and $RENDER
The post also mentions two other AI-related tokens being watched alongside $ANT: **$TAO** and **$RENDER**. 👁️
Watching related tokens together is a smart habit because sector sentiment often moves as a group. If AI tokens as a whole are under pressure, a new listing can struggle to hold its ground no matter how strong the project is. 🔗
For reference, **TAOUSDT perpetual futures** were trading around **$177.07, down 6.19%**, which suggests that weakness was not limited to $ANT alone. 📉
---
## 🧠 What Should Traders Watch Next?
After a volatile start like this, many traders keep an eye on a few key things: 👀
1. **🎯 The $83 level:** the most important support to watch.
2. **📈 Volume on bounces:** strong volume on a rebound can show real buying interest.
3. **🤖 AI sector sentiment:** movements in $TAO and $RENDER can influence $ANT.
4. **🌍 Broader market mood:** crypto reacts strongly to wider market conditions.
5. **🛡️ Risk management:** new listings are highly volatile, so position sizing and stop-losses matter.
---
## 💬 The Big Question: Did You Hold or Panic Sell?
The post ends with a direct question to its readers: **"Do you still believe, or did you panic sell?"** 🤔
It's a fair question for every trader. Volatile days test your strategy and your emotions at the same time. Those who plan their entries, exits and risk in advance are far less likely to make decisions out of fear. 💪
---
## 📝 Final Thoughts
$ANT's first two days show the classic lifecycle of a new listing: an exciting spike, a sharp reality check and a key support level that now decides the next move. 🌪️ Whether $83 holds will shape the story from here.
It's worth remembering that this narrative comes from a promotional-style social post, so treat it as one opinion and not a guarantee of future performance. Stay patient, do your own research and never invest more than you can afford to lose. 💡
> ⚠️ *Disclaimer: This article is for informational purposes only and is not financial advice. Newly listed tokens are extremely volatile. Always do your own research before trading or investing.*
---
### 🏷️
**#ANT #CryptoNews #AITokens #BinanceSquare #AltcoinWatch**
#POSCOAndLGCNSCompleteReceivablesTokenizationPilotOnInjective #CryptoBilisAttackerMoves25000ETHToTornadoCash #HKBillProposesHK$100KFineForUnauthorizedCryptoTitles #StrategyReports$35BNetReserves
---
3
·
--

مقالة
🚨 انهيار الذكاء الاصطناعي: محو تريليون دولار من الأسهم الأمريكية مع سلسلة الخسائر التي تدق ناقوس الخطر 📉#GlobalStocksFaceLongestLosingStreakSince2023
## 🔥 مقدمة: يوم قاسٍ في وول ستريت
يتعرض سوق الأسهم الأمريكية لضغوط شديدة. ووفقًا لتعليقات متداولة في السوق اليوم، مُحي نحو **تريليون دولار من القيمة** من الأسهم الأمريكية في جلسة واحدة. 😨
تراجع **مؤشر S&P 500 بنحو 1.3%**، وإذا أغلق المؤشر على انخفاض اليوم، فسيكون ذلك **اليوم السابع على التوالي من الخسائر**. وبالنسبة إلى مؤشر مرجعي يعدّه المستثمرون نبض الاقتصاد العالمي، يصعب تجاهل سلسلة كهذه. ⚠️
---
🚨 انهيار الذكاء الاصطناعي: محو تريليون دولار من الأسهم الأمريكية مع سلسلة الخسائر التي تدق ناقوس الخطر 📉
#GlobalStocksFaceLongestLosingStreakSince2023
## 🔥 مقدمة: يوم قاسٍ في وول ستريت
يتعرض سوق الأسهم الأمريكية لضغوط شديدة. ووفقًا لتعليقات متداولة في السوق اليوم، مُحي نحو **تريليون دولار من القيمة** من الأسهم الأمريكية في جلسة واحدة. 😨
تراجع **مؤشر S&P 500 بنحو 1.3%**، وإذا أغلق المؤشر على انخفاض اليوم، فسيكون ذلك **اليوم السابع على التوالي من الخسائر**. وبالنسبة إلى مؤشر مرجعي يعدّه المستثمرون نبض الاقتصاد العالمي، يصعب تجاهل سلسلة كهذه. ⚠️
---
## 🔥 مقدمة: يوم قاسٍ في وول ستريت
يتعرض سوق الأسهم الأمريكية لضغوط شديدة. ووفقًا لتعليقات متداولة في السوق اليوم، مُحي نحو **تريليون دولار من القيمة** من الأسهم الأمريكية في جلسة واحدة. 😨
تراجع **مؤشر S&P 500 بنحو 1.3%**، وإذا أغلق المؤشر على انخفاض اليوم، فسيكون ذلك **اليوم السابع على التوالي من الخسائر**. وبالنسبة إلى مؤشر مرجعي يعدّه المستثمرون نبض الاقتصاد العالمي، يصعب تجاهل سلسلة كهذه. ⚠️
---
22
سجّل الدخول لاستكشاف المزيد من المُحتوى
انضم إلى مُستخدمي العملات الرقمية حول العالم على Binance Square
⚡️ احصل على أحدث المعلومات المفيدة عن العملات الرقمية.
💬 موثوقة من قبل أكبر منصّة لتداول العملات الرقمية في العالم.
👍 اكتشف الرؤى الحقيقية من صنّاع المُحتوى الموثوقين.
البريد الإلكتروني / رقم الهاتف
المواضيع الرائجة
1
#CanBTCReboundAfterFallingBelow60K?
166,152 مشاهدات
739 يقومون بالنقاش
2
#GlobalStocksFaceLongestLosingStreakSince2023
67,036 مشاهدات
637 يقومون بالنقاش
3
#AnthropicPlungesTowardIPOPriceonDay2
27,477 مشاهدات
285 يقومون بالنقاش
4
#BNBDropsBelow540USDTWith8.46%DailyDecline
2,903 مشاهدات
58 يقومون بالنقاش
5
#HKBillProposesHK$100KFineForUnauthorizedCryptoTitles
0 مشاهدات
1 يقومون بالنقاش
6
#BitMineFaces$10.1BUnrealizedETHLoss
107 مشاهدات
2 يقومون بالنقاش
7
#StrategyReports$35BNetReserves
34 مشاهدات
2 يقومون بالنقاش
8
#MorganStanleyEndsAnthropicStockSupportAfterOneDay
1,520 مشاهدات
46 يقومون بالنقاش
9
#CryptoBilisAttackerMoves25000ETHToTornadoCash
2,556 مشاهدات
42 يقومون بالنقاش
10
#POSCOAndLGCNSCompleteReceivablesTokenizationPilotOnInjective
0 مشاهدات
0 يقومون بالنقاش