#RaheelAltaf Chainlink (LINK) Market Update – Watching the Bigger Picture
Chainlink is still moving within the broader yellow B-wave correction, and the market has yet to confirm a decisive trend reversal. At this stage, the B-wave appears to be forming a triangle structure, although this remains unconfirmed without a proper 1–2 bullish setup.
A break above the first yellow trendline is still required to confirm that a local bottom may be in place. Until this happens, the trendline continues to act as resistance and keeps the short-term downtrend intact.
---
Triangle Structure Still Intact
The potential triangle would consist of waves A–B–C–D–E, but so far there is no confirmed low for wave E.
If LINK breaks below the 4 April low at $10.20, the current micro-triangle becomes invalid. The B-wave correction itself could still continue, but it would need to unfold with a different internal structure.
---
Key Support Levels to Watch
Below are the next major support zones:
$10.70
$8.94
$6.90
A clean break below $6.90 increases the probability that LINK is entering a larger wave-4 correction, which remains an alternative scenario.
---
What Traders Should Look For
The price is currently interacting with the Fibonacci support cluster between $6.90 and $10.70.
The earliest sign of a potential bottom would be a confirmed break above the yellow trendline resistance. Until then, the structure suggests the downtrend is still dominant.
---
Summary
B-wave may be forming a triangle, but not confirmed.
Break above yellow trendline = first bullish signal.
Break below $10.20 = triangle invalidation.
Support at $10.70 → $8.94 → $6.90.
A drop under $6.90 opens the door to a higher-degree wave-4 correction.
Trade saf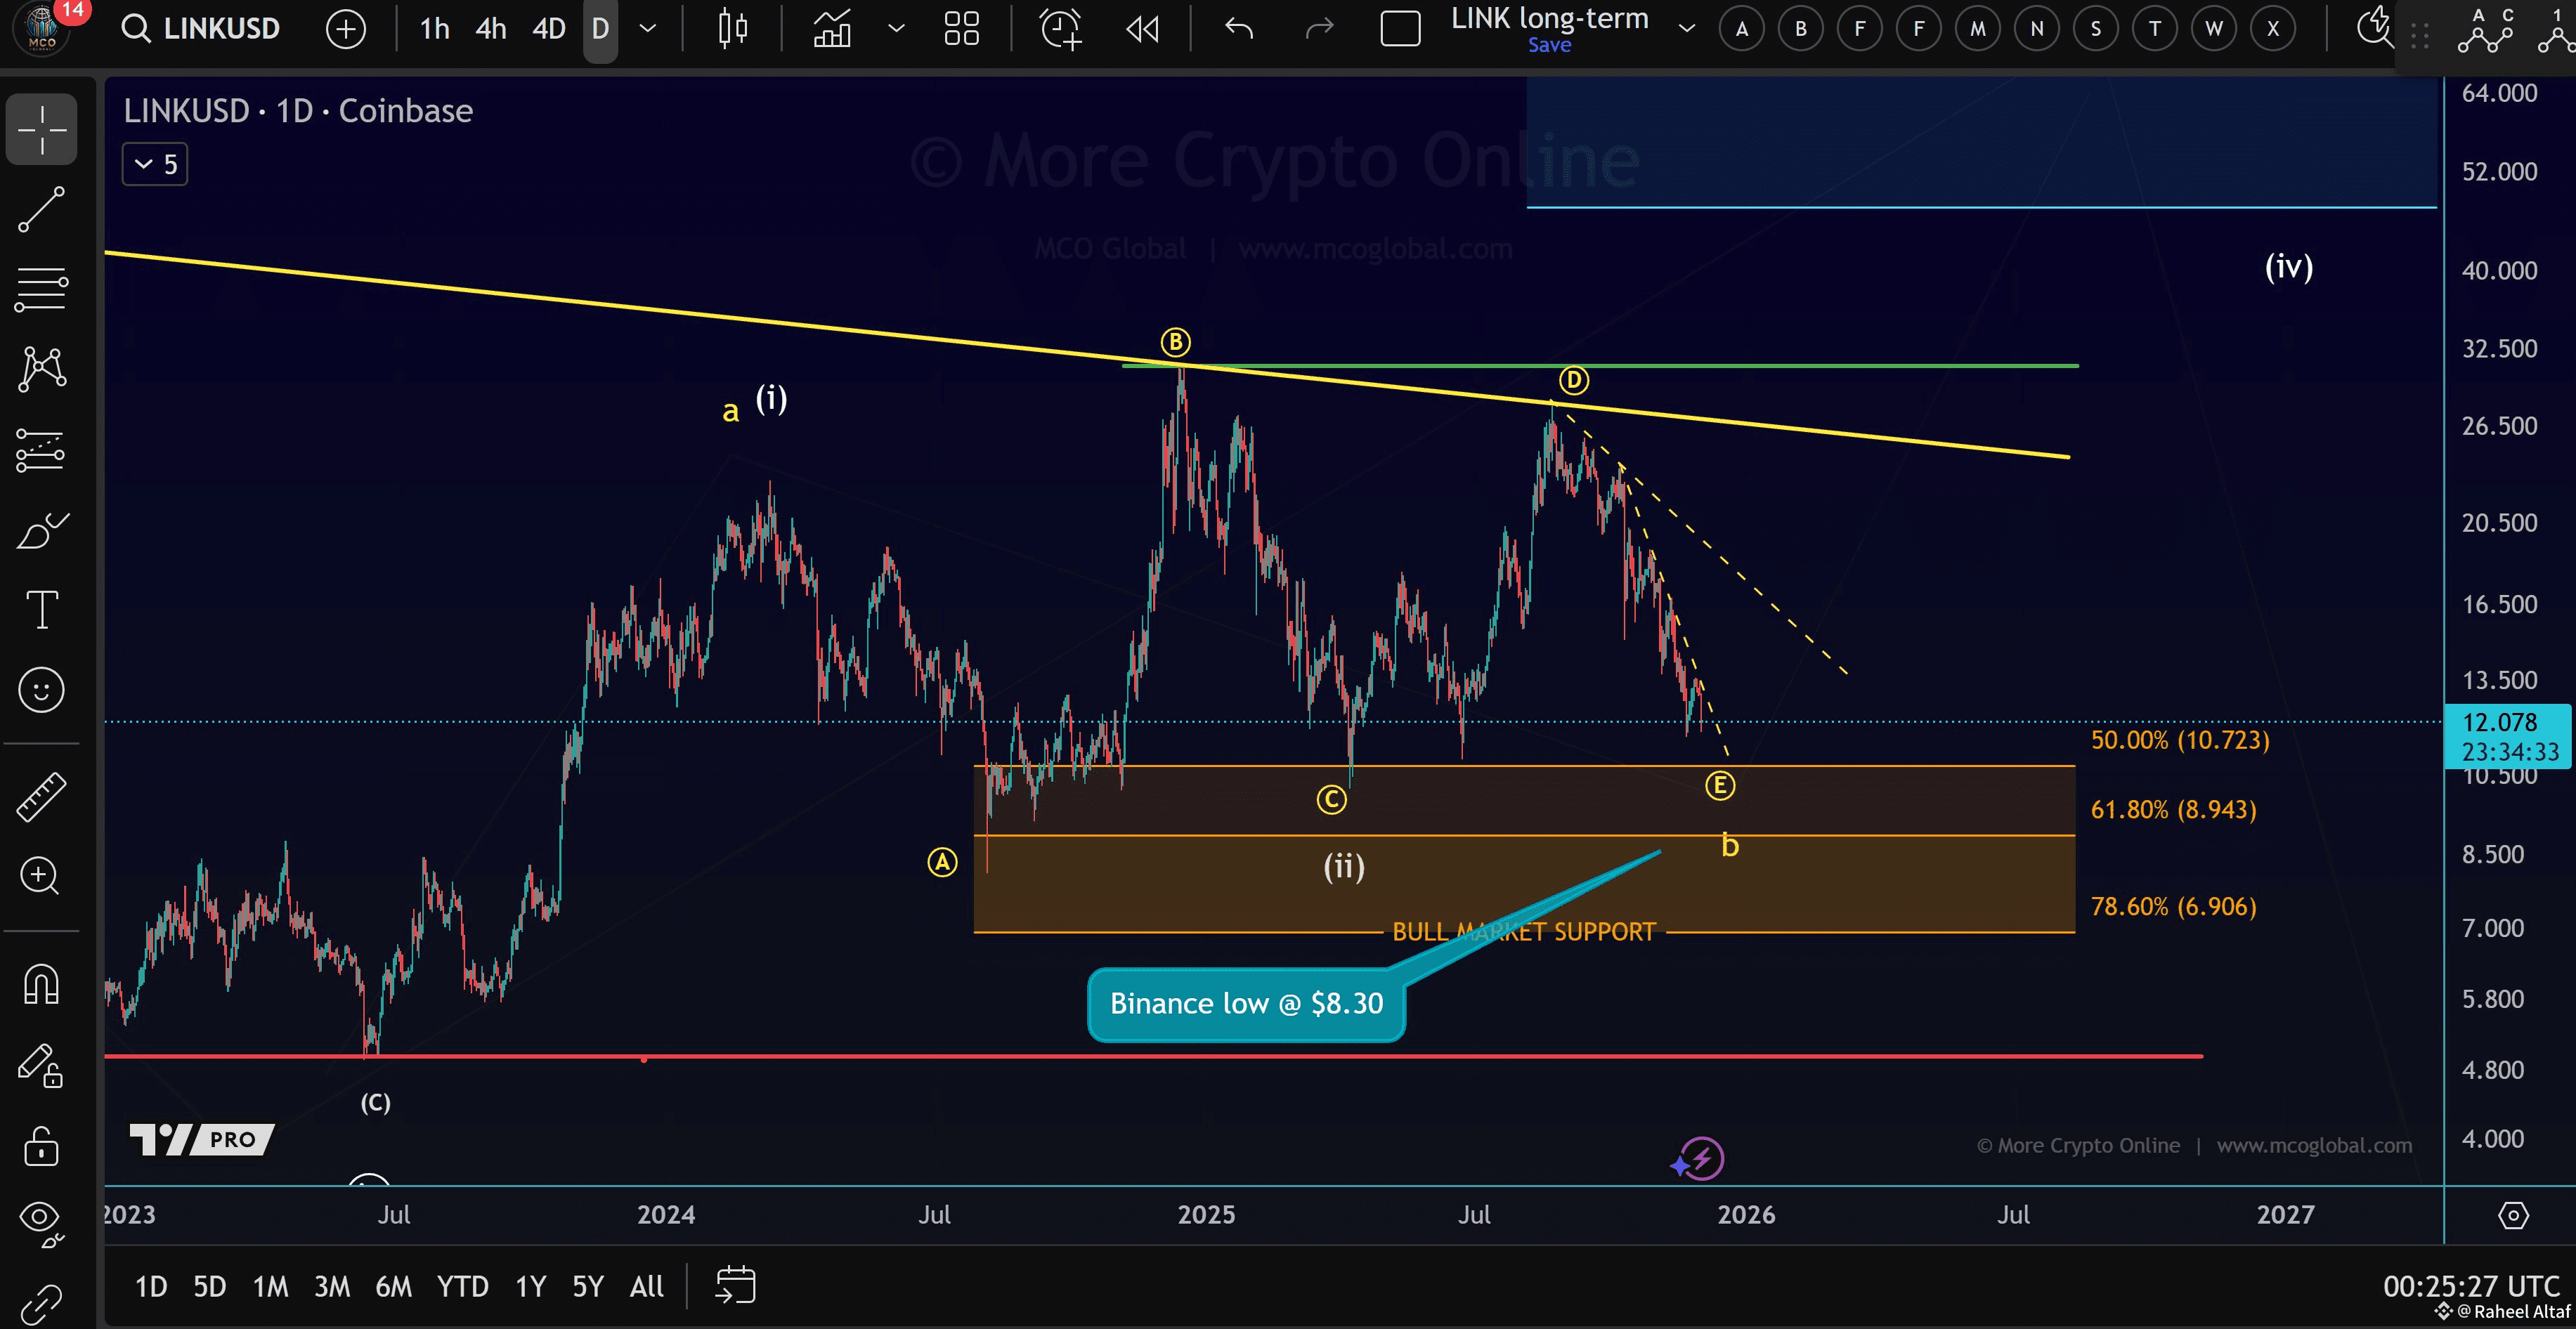 3ely and watch the reactions at the key Fibonacci zone.

