bulluniverse


Verified Creator
Frequent Trader
2.4 Years
27 Following
39.4K+ Followers
11.5K+ Liked
1.0K+ Shared
All
Quotes
Live
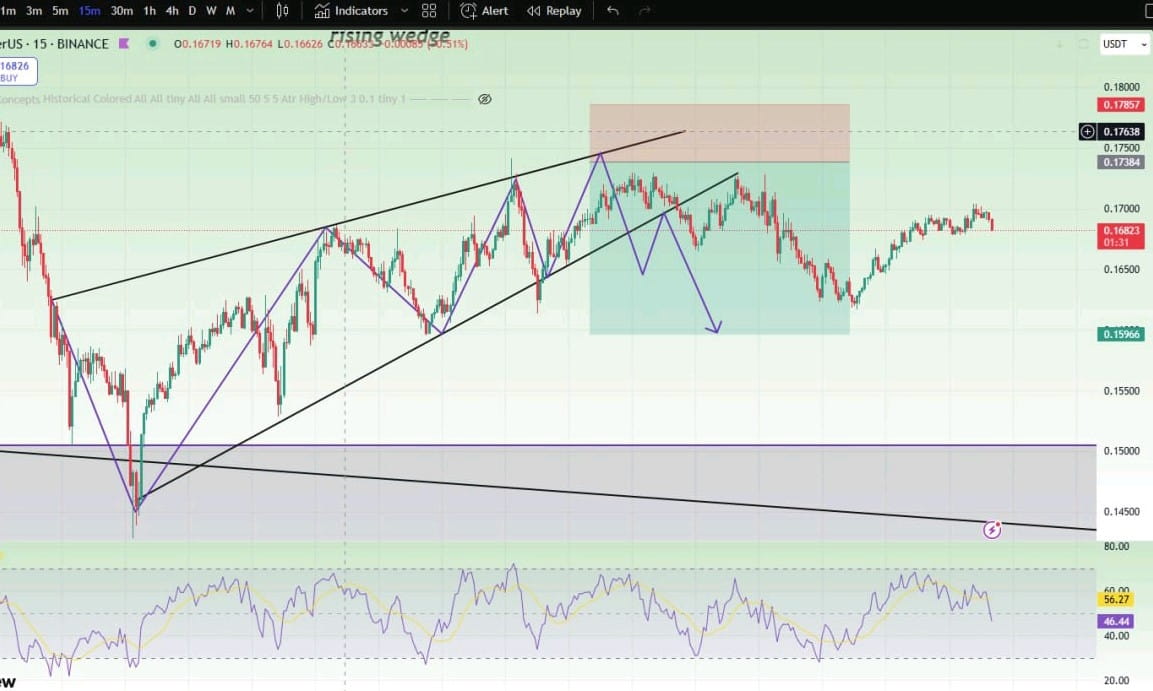
Neiro Signal Update
$NEIRO
Coin name: Neiro
SHORT
Price: .00028983
(Enter on entry price)
10x leverage isolated
The 4-hour timeframe shows a rising wedge, a bearish chart pattern. Neiro has already touched the upper trendline resistance, indicating a potential downside move due to bearish divergence.
However, there's significant upside liquidity in Neiro. It may first push higher to grab liquidity before dropping alongside ETH.
Always manage your risk and practice proper money management—avoid using high leverage in trading.
Meanwhile, BTC dominance (BTC.D) is holding trendline support, suggesting an upward move. If BTC.D rises, altcoins are likely to decline. Overall, the market appears bearish.
Target:
1) .00028374
2).00027703
3).00026424
4).00025397
For daily new signals like this, by following these simple steps:
Click my Binance LIVE for more information and signals update
#NEIRO
SOL Signal Update
$SOL coin
Coin name: SOl
SHORT
Price: 148
(Enter on entry price)
5x leverage isolated
I’m seeing an M pattern (double top) forming on the 4H timeframe, along with a bearish divergence, which indicates a potential bearish move.
However, on the 12H timeframe, there’s a lot of upside liquidity. This suggests that SOL could move up first to grab liquidity before heading down.
Risk management is key—always manage your risk properly, use sound money management strategies, and avoid high leverage in trading.
Meanwhile, BTC dominance (BTC.D) is holding trendline support, suggesting an upward move. If BTC.D rises, altcoins are likely to decline. Overall, the market appears bearish.
Target:
1) 145
2)142
3)140
4)138
For daily new signals like this, by following these simple steps:
Click my Binance LIVE for more information and signals update
#sol
Link Update
$LINK
Coin name: Link
SHORT
Price: 15.70
(Enter on entry price)
5x leverage isolated
The 4-hour chart shows a rising wedge pattern along with bearish divergence, indicating a potential downside move for LINK. After rejecting trendline resistance, LINK is likely to decline.
The liquidation heatmap suggests that LINK may drop after grabbing liquidity, reinforcing the bearish outlook. Managing risk is crucial—using low leverage is recommended.
Meanwhile, BTC dominance (BTC.D) is holding trendline support, suggesting an upward move. If BTC.D rises, altcoins are likely to decline. Overall, the market appears bearish.
Targe
🎯Target:
1) 15.30
2) 15
3)14.50
4)14
For daily new signals like this, by following these simple steps:
Click my Binance LIVE for more information and signals update
#LINK
XRP Signal Update
$XRP coin
Coin name: XRP
Long
Price: 2.4378
(Enter on entry price)
XRP is currently trading within a rising channel, which can be a bearish pattern. However, it is holding a key trendline support, suggesting a potential upward move.
There is significant upside liquidity in XRP, reinforcing the possibility of a price increase. Based on technical analysis, XRP is likely to move higher.
Meanwhile, BTC dominance (BTC.D) is forming an ascending triangle, a bullish pattern. If the trendline breaks down and Bitcoin moves higher, we could see a strong altcoin season soon.
10x leverage isolated
Sl: 2.3333
Target:
1) 2.4785
2) 2.5182
3) 2.5643
For daily new signals like this, by following these simple steps:
Click my Binance LIVE for more information and signals update
#xrp
ETH Signal Update
$ETH
SPOT Call
Price: 2060
(Enter on entry price)
On the weekly time frame, ETH is forming an ascending triangle, a neutral pattern. It has already touched the lower support trendline, suggesting an upward move. However, in the short term, ETH may show some direction changes, but in the long run, it remains bullish.
Binance liquidation heat map indicates that ETH has upside liquidity, reinforcing the potential for an upward move in the longer time frame. For a significant price movement, holding ETH for the long term could be a good strategy.
ETH dominance (ETH.D) is expected to hold a major support zone, and once ETH starts moving up, it could gain momentum. It’s advisable to use low leverage and follow proper money management in trading. Avoid high leverage to minimize risk.
Short term Target:
1) 2300
2) 2400
3)2500
Long term target 🎯
1)2700
2)3500
3)3800
4)4000
For daily new signals like this, by following these simple steps:
Click my Binance LIVE for more information and signals update
#ETH
Doge Signal Update
$DOGE Coin
SHORT
Price: .18600
(Enter on entry price)
I’ve spotted a descending triangle pattern in the shorter time frame, indicating a potential bearish move for Doge. From my entry zone, Doge is likely to drop as it faces trendline resistance. A closer look at the charts confirms this technical setup.
However, there is significant upside liquidity in Dogecoin, so proper risk management is essential. Always manage your funds wisely and avoid using high leverage.
Meanwhile, BTC dominance (BTC.D) is forming an ascending triangle, a bullish pattern. If the trendline breaks down and Bitcoin moves higher, we could see a strong altcoin season soon.
10x leverage isolated
Sl: .18700
Target:
1) .18400
2).18200
3).18100
4).17900
For daily new signals like this, by following these simple steps:
Click my Binance LIVE for more information and signals update
#DOGE
RENDER SIGNAL
$RENDER
SHORT
Price: 3.3310
(Enter on entry price)
Here I can see a rising wedge bearish chart 📉 pattern in shorter 4h time frame, now already Render touched the upper resistance trendline after it will go down support trendline if technically render breakdown this support I will open my short position after successfully retest
There are lots of down side liquidity in render now Market looks sideways so must manage your own risk and do money management in trading.
BTC.d looks bullish so alts will be bearish for short term perspective.
10x leverage isolated
Sl: 3.403
Target:
1) 3.1862
2)3.1099
3)3.0693
For daily new signals like this, by following these simple steps:
Click my Binance LIVE for more information and signals update
#render
ONDO Signal Update
$ONDO Signal
Long
Price: .8100
(Enter on entry price)
In the 1-hour timeframe, I can see an ascending triangle forming, which is a bullish pattern. ONDO is likely to drop towards the support trendline before bouncing back.
There’s significant downside liquidity, suggesting that ONDO may move lower to grab that liquidity before making a strong upward move.
Additionally, the Money Flow Index (MFI) is showing bullish signals, aligning with the ascending triangle pattern. With altcoins poised for movement, a breakout could be on the horizon.
5x leverage isolated
Target:
1) .8200
2).8300
3).8400
4).8500
For daily new signals like this, by following these simple steps:
Click my Binance LIVE for more information and signals update
#ONDO
XRP UPDATE
$XRP
Coin name: XRP
SHORT
Target:
1) 2.2938
2)2.2739
3)2.2390
Here I can see a symmetrical triangle neutral chart pattern in 30 minutes time frame. When xrp break down/Out after I will make my entry. So wait for breakout or breakdown
Here I can see down side liquidity and upside both side have good liquidity so after a confirmation you can take entry.
XRP
LONG
Additionally, the Money Flow Index (MFI) is showing bullish signals, aligning with the ascending triangle pattern. With altcoins poised for movement, a breakout could be on the horizon.
Targets:
1)2.3528
2)2.3826
3)2.4182
For daily new signals like this, by following these simple steps:
Click my Binance LIVE for more information and signals update
#XRP
BTC Signal Update
$BTC
Short
Target:
1) 81000
2)80000
3)78000
4)76000
I'm observing a symmetrical triangle pattern on the 4-hour timeframe, indicating a neutral setup. I'll wait for a confirmed breakout or breakdown before opening a position.
There’s significant upside liquidity, suggesting a potential BTC pump from a technical standpoint. However, I'll enter only after confirmation.
Additionally, BTC dominance (BTC.d) is forming an ascending triangle, which is a bullish pattern. This could support a further BTC rally.
BTC
Long
Targets 🎯:
1) 84000
2)85500
3)87000
4)90000
For daily new signals like this, by following these simple steps:
Click my Binance LIVE for more information and signals update
#BTC
BCH Signal
$BCH
Coin name: BCH
Long
Price: 330
(Enter on entry price)
Here I can see BCH already breakout inverse head and shoulders Bullish chart patterns now BCH will pump after the retest.
BTC looks Bullish so alts will move fast . There are lots of upside liquidity in BCH coin so BCH will go upside tp grab liquidity.
BTC.d is bullish so alts will go upside with BTC . BTC.d forming a ascending triangle bullish chart pattern so now btc.d will go down side after it will bounce back from trendline support zone
10x leverage isolated
Sl: 325
Target:
1) 340
2) 344
3)350
For daily new signals like this, by following these simple steps:
Click my Binance LIVE for more information and signals update
#BCH
congratulations 🎉👏🎉 $TRX
already successfully Start flying 🪽 follow me for more updates
already successfully Start flying 🪽 follow me for more updates
bulluniverse
--
TRX Update
$TRX
Coin name: TRX
Long
Price: .2200
(Enter on entry price)
TRX has already broken out of a falling wedge bullish pattern on the 1-hour timeframe. After this breakout, I’m waiting for a successful retest of the breakout zone before entering a long position.
However, according to the 24-hour liquidation heatmap, there is a lot of upside liquidity. So, TRX might grab that liquidity first and then move back down. That’s why I’m waiting for confirmation before taking any trade
On the BTC chart, a falling wedge bullish pattern is forming. At present, BTC is testing the upper resistance of the wedge. After touching this resistance, BTC may drop, and I expect a bounce from around $74,000. That’s when I plan to open a trade.
5x leverage isolated
Sl: .2100
Target:
1) .2250
2).2310
3).2350
For daily new signals like this, by following these simple steps:
Click my Binance LIVE for more information and signals update
#TRX
congratulations 🎉🎉$ADA
already successfully achieved my targets 🎯💯
follow retweet and visit my profiles for more updates
already successfully achieved my targets 🎯💯
follow retweet and visit my profiles for more updates
bulluniverse
--
ADA Signal Update
$ADA
Coin name: ADA
Long
10x leverage isolated
I am noticing a clear Inverse Head and Shoulders bullish pattern forming on the ADA/USDT chart. Once we get a confirmed breakout candle that closes above the neckline (resistance line), I plan to open a long position after a successful retest of the breakout zone.
Also, there is significant liquidity stacked on the upside for ADA, which increases the possibility of an upward breakout.
At the same time, Bitcoin dominance (BTC.D) is currently pumping, which usually indicates that BTC may see a slight upward move, and as a result, altcoins like ADA can also follow and start moving up.
Target:
1) .7300
2).7350
3).7410
For daily new signals like this, by following these simple steps:
Click my Binance LIVE for more information and signals update
#ADA
congratulations 🎉🎉🎉$SOL
Successfully achieved my all targets 🎯 from check my profile for more coins updates
#sol
Successfully achieved my all targets 🎯 from check my profile for more coins updates
#sol
bulluniverse
--
SOL Update
$SOL
Coin name: SOL
Long
There's a symmetrical triangle forming on the 4H timeframe. Once a breakout occurs, SOL is likely to move quickly—waiting for confirmation is key.
There's significant liquidity on the upside, making it likely that SOL will push higher to grab it.
Meanwhile, BTC dominance is looking bullish, meaning altcoins may move slightly alongside Bitcoin.
Target:
1) 129
2)131
3)133
4)135
Coin name: SOL
Short
Target:
1) 120
2)117
3)115
4)112
For daily new signals like this, by following these simple steps:
Click my Binance LIVE for more information and signals update
#sol
Coin name: SOL
Long
There's a symmetrical triangle forming on the 4H timeframe. Once a breakout occurs, SOL is likely to move quickly—waiting for confirmation is key.
There's significant liquidity on the upside, making it likely that SOL will push higher to grab it.
Meanwhile, BTC dominance is looking bullish, meaning altcoins may move slightly alongside Bitcoin.
Target:
1) 129
2)131
3)133
4)135
Coin name: SOL
Short
Target:
1) 120
2)117
3)115
4)112
For daily new signals like this, by following these simple steps:
Click my Binance LIVE for more information and signals update
#sol
DOGS Update
$DOGS
Price: .0001416
(Enter on entry price)
I can see that dog-themed meme coins have already pumped, and now they are facing a resistance zone. On the 4-hour timeframe, there’s a potential W pattern forming. Please remember to manage your own risk while trading — proper money and risk management is a must.
Also, according to the Binance liquidation heatmap, there is a lot of liquidity on the downside, which indicates that meme coins like DOGS may move lower. But a quick warning: ⚠️ I personally don’t prefer meme coins because they lack strong fundamentals. Still, from a technical perspective, a downward move looks likely.
Meanwhile, BTC dominance (BTC.D) is showing bearish signs, so after a correction, altcoins could start moving up.
For daily new signals like this, by following these simple steps:
Click my Binance LIVE for more information and signals update
#Dogs
ETH Update
$ETH
Coin name: Eth
Long
Price: 1900
(Enter on entry price)
Looking at ETH on the 4H timeframe, it’s clearly respecting a trendline. If ETH successfully breaks out of this trendline, we can expect an upside move. Right now, the market is trying to push upward, but some bearish pressure is still present.
Also, if you check the ETH Binance liquidation heatmap on Coinglass, there’s a lot of liquidity sitting above, which suggests that price might move up to grab that liquidity.
Overall, the market sentiment looks bullish, so both ETH and altcoins may move higher. But remember — patience is key, and always practice proper money and risk management in trading.
10x leverage isolated
Target:
1) 2000
2) 2050
3)2100
For daily new signals like this, by following these simple steps:
Click my Binance LIVE for more information and signals update
#ETH
BNB Update
$BNB
Long
Price: 570
(Enter on entry price)
BNB has already broken out above its trendline resistance, which indicates that it could experience another pump—likely after a retest. It’s advisable to wait for the retest before entering any trades, rather than jumping in too early.
Additionally, there’s considerable downside liquidity in BNB. This means that the price might sweep through these levels, further supporting the idea of waiting for a retest before opening a position. If you’re considering shorting, please note that this is purely my personal opinion, and I recommend doing your own research.
Overall, the market appears set for a retest, so hold off on your trade until that confirmation to avoid being trapped in an unfavorable position.
10x leverage isolated
Sl: 550
Target:
600
610
630
For daily new signals like this, by following these simple steps:
Click my Binance LIVE for more information and signals update
#bnb
Telegram CEO
📈📈News effects:
✅JUST IN: Telegram CEO Pavel Durov has been permitted to leave France for the first time since August 2024.
✉️✉️According to AFP, the founder is returning to Dubai for several weeks following approval from local authorities.
$TON
✅JUST IN: Telegram CEO Pavel Durov has been permitted to leave France for the first time since August 2024.
✉️✉️According to AFP, the founder is returning to Dubai for several weeks following approval from local authorities.
$TON
congratulations 🎉🎉 $DOGE
successfully achieved my all targets 🎯 follow retweet my posts for more updates .
#DOGE
successfully achieved my all targets 🎯 follow retweet my posts for more updates .
#DOGE
bulluniverse
--
DOGE COIN
$DOGE
Coin name: Doge
SHORT
Price: .173800
(Enter on entry price)
Currently, I can see a rising wedge bearish pattern forming on the 1-hour timeframe for DOGE. Once the price reaches the upper resistance trendline of this pattern, a downward move is expected.
Also, looking at the 2-day Coinglass liquidation heatmap, there is significant liquidity around the lower trendline area. This suggests that DOGE may move down to grab that liquidity. So, technically, a downside move is likely.
On the BTC chart, a falling wedge bullish pattern is forming. At present, BTC is testing the upper resistance of the wedge. After touching this resistance, BTC may drop, and I expect a bounce from around $74,000. That’s when I plan to open a trade.
5x leverage isolated
Sl: .17957
Target:
1) .17000
2).16950
3).16780
For daily new signals like this, by following these simple steps:
Click my Binance LIVE for more information and signals update
#DOGE
Login to explore more contents