In daily trading charts, candlestick charts (K-line) are one of the important tools for technical analysis. If used correctly, candlestick charts can give a signal that precedes market action. They are leading indicators of market activity. Because K-line charts are intuitive, three-dimensional, and carry a large amount of information, they can fully display the strength of price trends and changes in the balance of power between buyers and sellers, and can accurately predict the future market trend.
Therefore, many traders will make bullish or bearish decisions based on candlestick chart patterns, which will greatly increase their success rate.
Below, the editor will introduce several K-line patterns with a very high success rate. When to buy and when to stop loss are given to everyone simply and directly.
01Bullshit Grab the Belt
Buying reference point: The day after the bullish belt line appears, if the exchange rate does not hit a new low, it constitutes a buying point.
Stop loss reference point: the lowest point of the belt line.
02Low-position propeller

Buying reference point: The day after the low propeller line appears, if the exchange rate rises and crosses the propeller entity, it constitutes a buying point.
Stop loss reference point: the lowest point of the propeller line.
03Morning Star

The pattern formed by these three K-lines is called the Morning Star, or the Morning Star.
Buying reference point: The day after the star line appears, if the exchange rate continues to rise and crosses the previous positive line entity, it constitutes a buying point.
Stop loss reference point: lowest point of star line.
04The dawn of hope
Buying reference point: The day after the Dawn Breaking Pattern appears, if it can be confirmed that the exchange rate does not fall below the lowest point of the pattern, a buying point will appear.
Stop loss reference point: lowest point of the pattern.
05Flat bottom

This pattern is called a flat bottom, and it is a good opportunity to increase positions slightly in the short term.
Buying reference point: The day after the flat bottom pattern appears, if the exchange rate continues to rise and crosses the entity of the previous K-line, a buying point will appear.
Stop loss reference point: lowest point of the pattern.
06The rising sun

Buying reference point: The day after the rising sun pattern appears, if the stock price continues to rise and crosses the previous K-line entity, a buying point appears.
Stop loss reference point: the lowest point of the negative line.
07Friends strike back

Buying reference position: After the friend counterattack pattern appears, if the exchange rate rises on the next day and crosses the previous K-line entity, the buying point will appear.
Stop loss reference point: lowest point of the pattern.
08 Yin pregnancy cross

Buying reference point: After the Yinxian pregnant cross line appears, if the exchange rate continues to rise and crosses the cross line entity the next day, a buying point will appear.
Stop loss reference point: lowest point of the pattern.
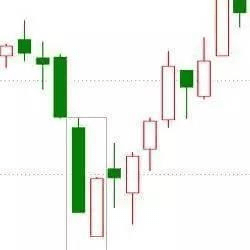
09Multi-party artillery
Pattern introduction: rising pattern. In an upward or downward trend, a medium or large Yang line appears, followed by a Yin line with a body inside the Yang line. After the Yin line, another Yang line appears, which completely covers the Yin line and has a larger trading volume.
The combination formed by these three K-lines is called a multi-party cannon, which is two yangs and one yin.
Buying reference point: After the multi-party cannon pattern appears, if the exchange rate continues to rise the next day and crosses the third positive line entity, the buying point will appear.
Stop loss reference point: the lowest point of the third K-line.
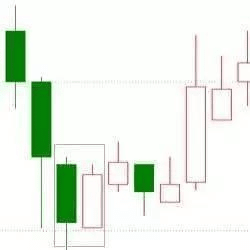
10 Rising Three Methods

This combination of patterns is called the Rising Three Methods.
Buying reference point: After the rising three-method pattern appears, if it can be confirmed that the exchange rate on the next day will not fall below the lowest price of the previous K-line, a buying point will appear.
Stop loss reference level: the lowest point of the pattern.
11 Red Three Soldiers

The combination of these three K-lines is vividly called the Three Red Soldiers.
Buying reference point: The day after the three red soldiers pattern appears, if the exchange rate continues to rise and crosses the entity of the third small positive line, a buying point will appear.
Stop loss reference point: the lowest point of the first positive line.
12 Rising Breakup

These two candlesticks have the same opening price but move in opposite directions, so they are called rising breakups.
Buying reference point: The day after the rising breakup pattern is formed, if it can be determined that the exchange rate does not fall below the opening price of the previous day's K-line, a buying point will appear.
Stop loss reference point: the lowest price of the negative line.
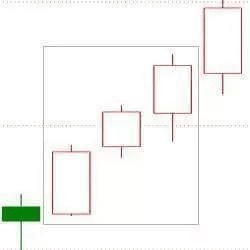
13 Three empty Yin lines

Buying reference position: Buying reference position: The day after the three-empty negative line pattern appears, if the exchange rate rises and crosses the opening price of the previous K root, a buying point appears.
Stop loss reference point: the lowest point of the third negative line.
14 Falling end line

Buying reference point: The day after the falling end line pattern appears, if the exchange rate continues to rise and crosses the previous K-line entity, a buying point will appear.
Stop loss reference point: the lowest point of the long lower shadow black candlestick.
15 Three Yang Kaitai
This K-line pattern is called San Yang Kai Tai.
Buying reference point: The day after the Three Yang Kai Tai pattern appears, if the exchange rate continues to rise and crosses the previous K-line entity, a buying point will appear.
Stop loss reference point: the lowest point of the first positive line.