I haven’t written an analysis article for a long time. Today, I will analyze with you my judgment on the current market trend from multiple periods and angles. I hope it can help you clarify your investment ideas. If you have different understandings of my analysis, you can also leave a comment in the comment section and we can discuss it rationally and objectively.
First, Bitcoin reached a record high of 73,777 in mid-March and then began to pull back. With the crazy surge, we are not surprised by such small pullbacks. After all, we are all waiting for the halving in April. From the price trend of Bitcoin in previous halvings, there has been a big explosion after the halving. However, a month has passed, and contrary to most people’s expectations, Bitcoin has not ushered in an explosion, but has continued to fall and fluctuate, and there is no sign of stabilizing and rising so far. Then the most critical question is, is the bull market still there? Will there be altcoins that will increase by 100 times or 1,000 times?
Based on my personal experience in digital currency trading for many years, I cannot say that the bull market is over. However, it is highly unlikely that there will be a 100x or 1,000x coin.
Because a very important basis is the excessive issuance of currency. When I first came into contact with the digital currency market in 2016, the market was all spot trading, and the number of tradable currencies was no more than 10 (excluding the air coins of small platforms). Everyone worked together to make the flames burn higher, and all funds were very concentrated in one plate. The daily increase often doubled. Now there are more than 5,000 currencies that can be traded in the market, and new coins are issued every week. The market funds are infinitely dispersed, and the existing funds are constantly harvested by the project party. Under such conditions, how can a thousand-fold coin be born? Some friends may be very arrogant and say that the coin has increased by so many times, but those are all private placements spread on the Internet. How many retail investors can really make money? Only what you can actually see, and most people can trade and make money are what retail investors should believe in, and those screenshots spread on the Internet can only be pyramid schemes at best!
Now let me analyze in detail the subsequent trend of Bitcoin from a technical perspective!
First of all, from the daily chart, Bitcoin has been fluctuating downward after reaching a new high, with the low point going down a little bit, but the decline is not much. This trend tends to be a negative decline and oscillation pattern.
Although the MACD indicator has formed a golden cross, if we look closely, we can see that the MACD volume column is very short, which also shows that the market trading volume is not large. It is a golden cross without volume, and any rise without volume is an inducement to buy. Moreover, when Bitcoin quickly rose to 63,440 yesterday, if we compare the K-line chart, you will find that it has hit this position 4 times and started to retreat. The so-called three points form a straight line, so there is an obvious short-term pressure level formed here!
We are looking at the weekly level,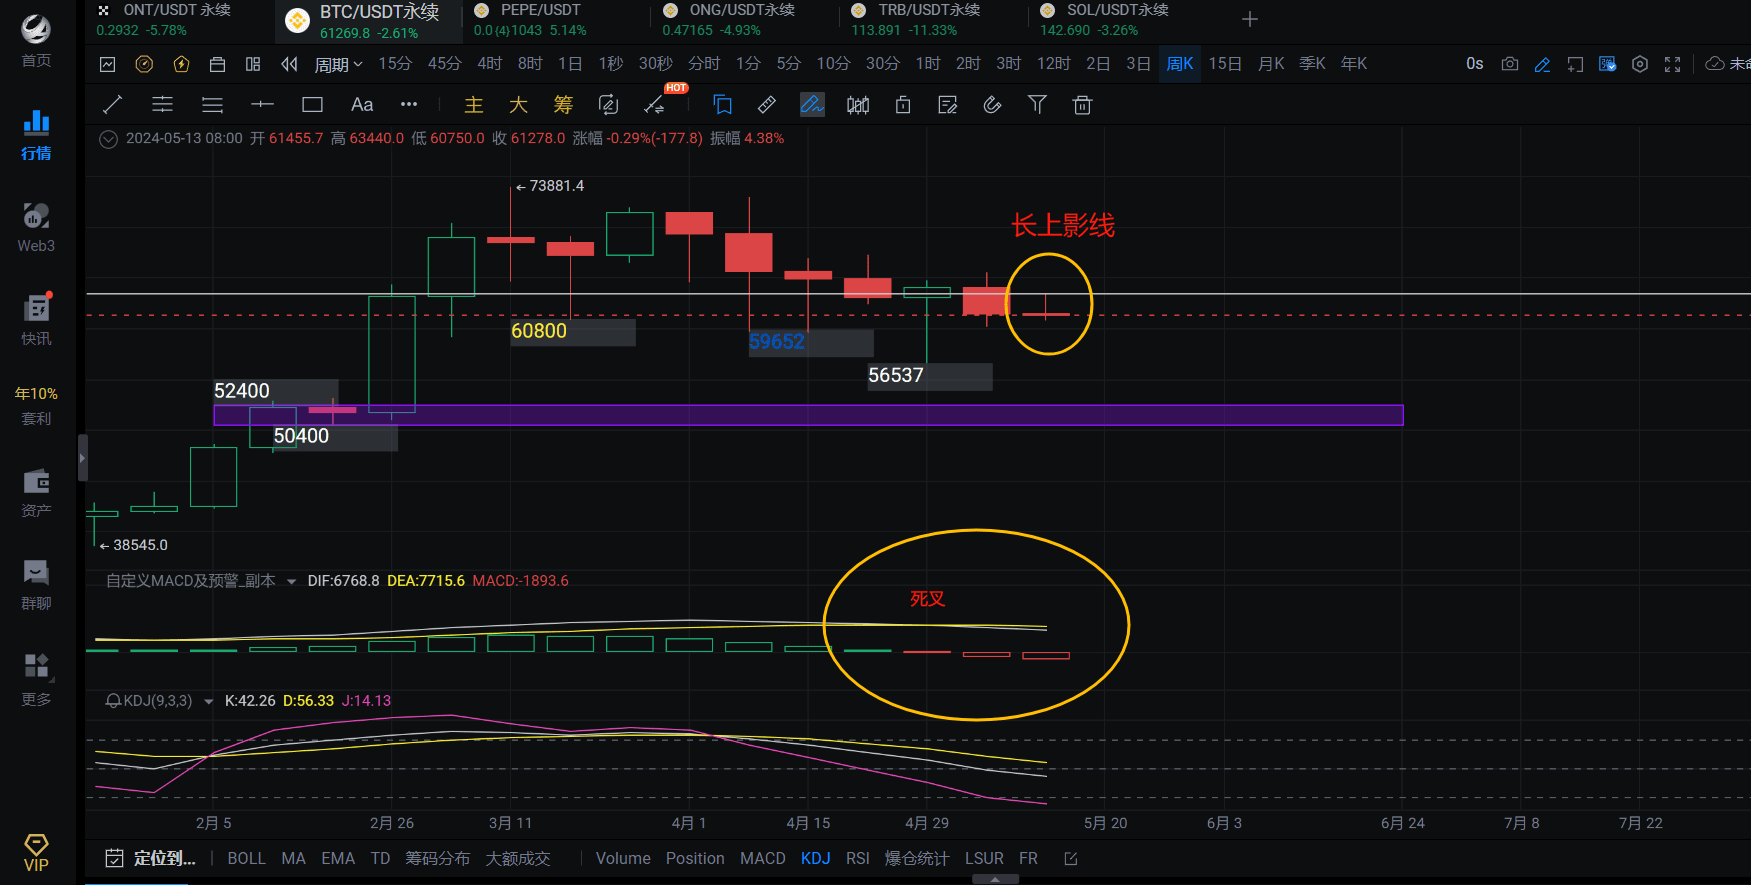
The weekly K-line has already developed an obvious upper shadow line, which is a performance of a pullback after touching the pressure level, and MACD has long formed a death cross. From the weekly trend, we can analyze that the downward trend has not stopped, and the small-level trend obeys the large-level trend. Here we can get the current daily golden cross, and in the absence of volume, it will slowly turn into a dead cross pattern. The daily dead cross and the weekly dead cross, combined with the cycle resonance theory, can be judged that the next trend will still be a downward trend, and the probability is very high!
Since we can confirm that it is a downward trend, where is the target of the decline? Let's continue to look at the chart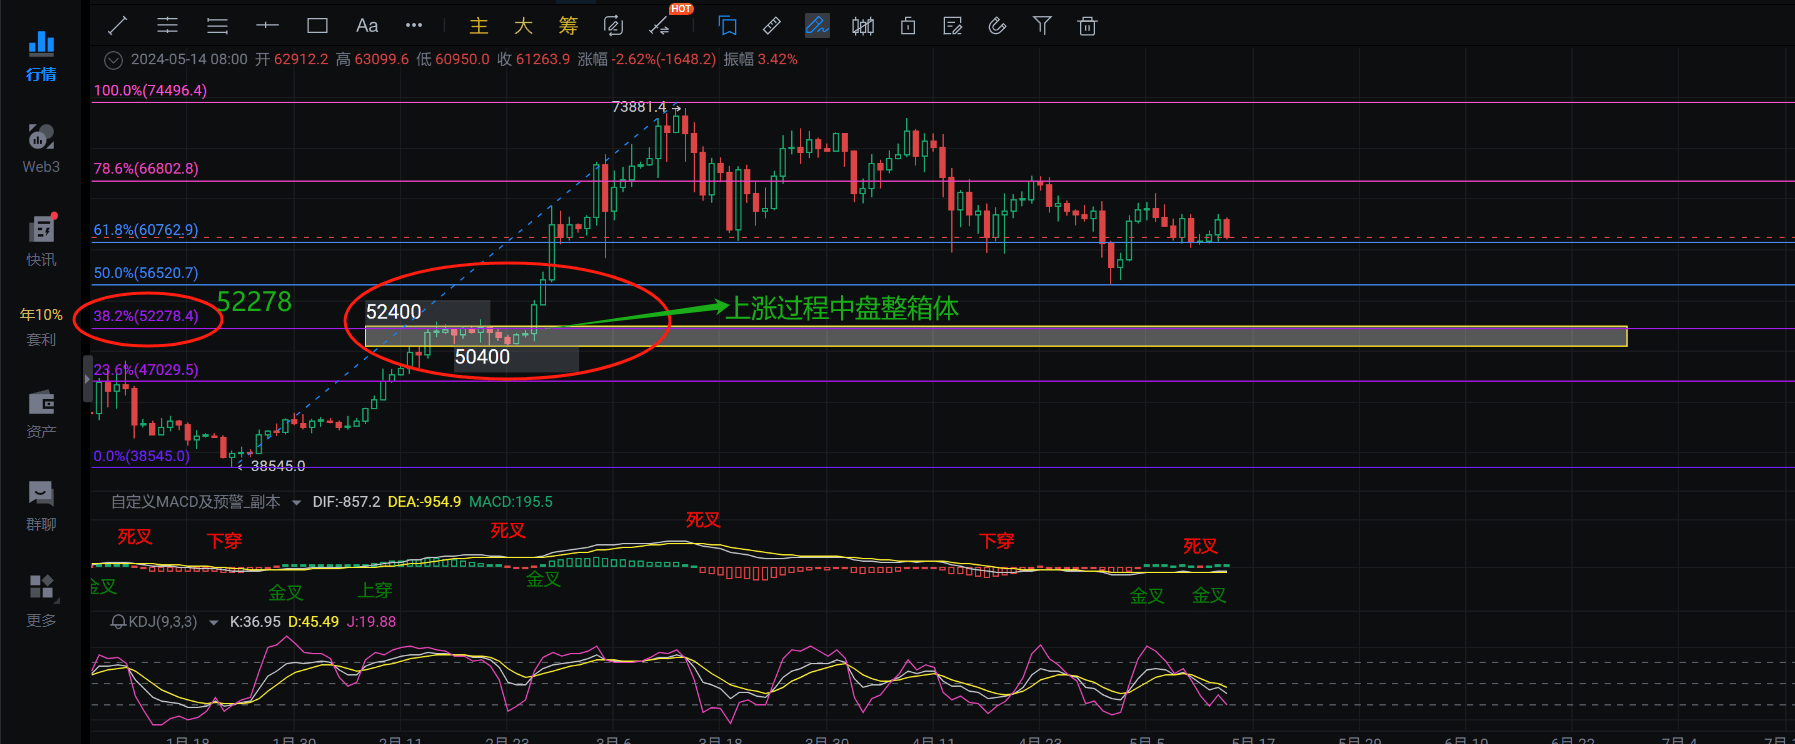
Back to the original argument, Bitcoin is in a downward oscillating pattern. The downward trend is not as sharp as the sharp decline. The speed of decline is relatively slow, and the downward space will not be too large. In the process of Bitcoin's rise, there is a consolidation box position. The top of the box is 52400 and the bottom is 50400. If we pull the Fibonacci, you will find that this position corresponds to the Fibonacci 0.382 position, and the corresponding price is 52278. When you adjust the cycle to the weekly level, the corresponding price of the 30MA moving average is 51500. It is just such a coincidence.
Therefore, we still combine the resonance principle and analyze multiple technical points to get a common position in the range of 51000 (up and down 1000)
Bitcoin continues to fall and its downward space is not large, but it is very damaging to the altcoins. The market investment sentiment has been very bad recently, so everyone should try to reduce their positions to control risks!
If you think my analysis can help you, you can follow me and give me a thumbs up. I will share more of my analysis of the market and some technical analysis in the future.

