📊 What is the RSI?
The Relative Strength Index (RSI) is a momentum oscillator, developed by J. Welles Wilder Jr. in 1978, that measures the speed and magnitude of recent price changes to evaluate overbought or oversold conditions in the price of a stock or other asset.
In simple terms, it helps traders identify when an asset might be:
· Overbought: The price has risen too far, too fast, and could be due for a pullback (a downward price correction).
· Oversold: The price has fallen too far, too fast, and could be due for a bounce (an upward price correction).
The RSI is displayed as a line graph that moves between 0 and 100. The most common time frame used for calculation is 14 periods (e.g., 14 days for daily charts, 14 hours for hourly charts).
---
🧮 How is the RSI Calculated?
The RSI calculation involves a two-step process. While trading platforms do this automatically, understanding the formula provides deeper insight.
RSI = 100 - [100 / (1 + RS)]
Where:
· RS (Relative Strength) = Average Gain of Up Periods / Average Loss of Down Periods over the chosen period (e.g., 14 days).
Let's break down the calculation using the standard 14-period setting:
1. Calculate the Average Gain and Average Loss:
· Over the last 14 periods, you calculate the average percentage gain on "up" days and the average percentage loss on "down" days.
· Wilder used a smoothing technique in his calculation, which gives more weight to recent data, making it more responsive to new price movements.
2. Calculate the Relative Strength (RS):
· Divide the Average Gain by the Average Loss.
3. Plug RS into the RSI Formula:
· The formula normalizes the RS value to oscillate between 0 and 100.
Example: If the average gain over 14 days is 1% and the average loss is 0.8%, then:
· RS = 1.0 / 0.8 = 1.25
· RSI = 100 - [100 / (1 + 1.25)] = 100 - [100 / 2.25] = 100 - 44.44 = 55.56
---
📈 How to Interpret the RSI: Key Levels and Signals
The primary signals from the RSI come from its position relative to key levels.
1. Overbought and Oversold Levels
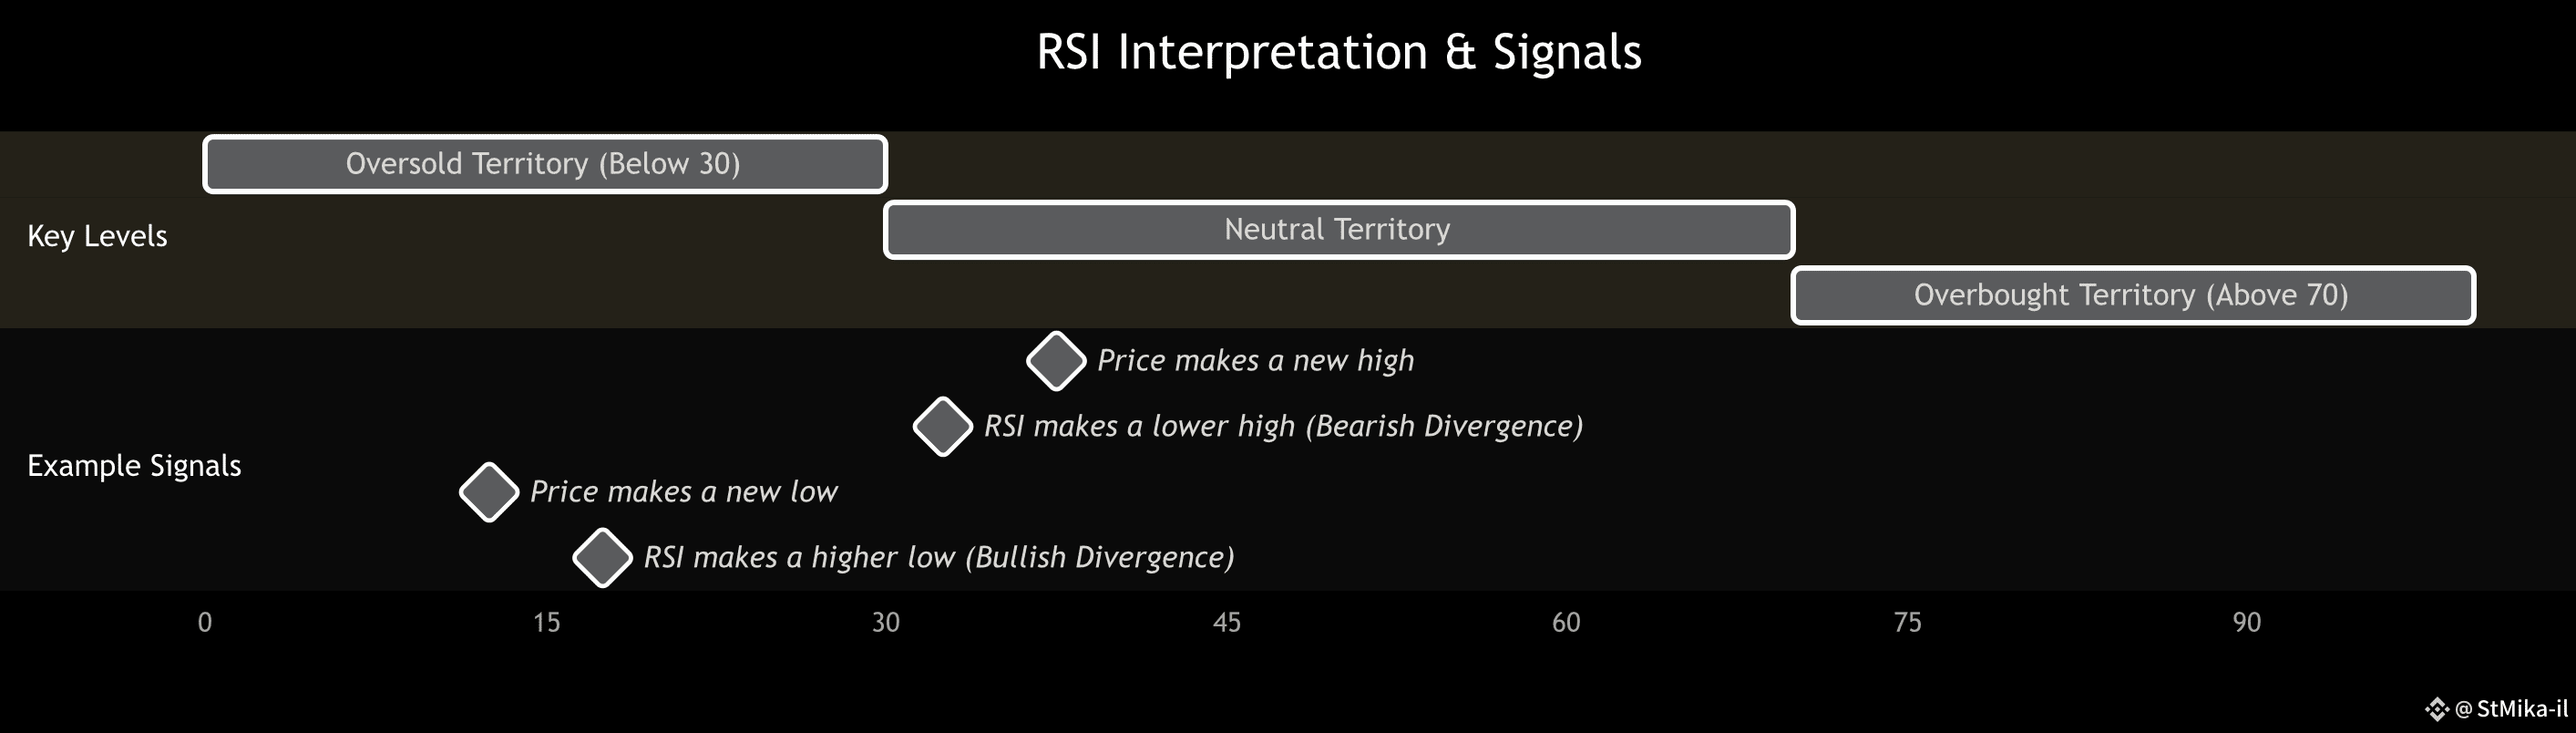
The most common interpretation uses the 70 and 30 levels.
· RSI above 70: Suggests the asset is overbought. It may be overvalued, and the risk of a price correction or pullback is higher. This is often seen as a potential sell signal.
· RSI below 30: Suggests the asset is oversold. It may be undervalued, and the potential for a price bounce or rally is higher. This is often seen as a potential buy signal.
⚠️ Important Caution: During a very strong trend (a powerful bull market or a steep bear market), the RSI can remain in overbought (above 70) or oversold (below 30) territory for extended periods. A reading above 70 doesn't automatically mean you should sell; it could indicate a strong uptrend. Similarly, an RSI below 30 in a strong downtrend doesn't guarantee an immediate bounce. Always use RSI in conjunction with trend analysis.
2. Divergences (A Powerful Signal)
This is often considered a more reliable signal than simply crossing the 30 or 70 lines.
· Bearish Divergence (Warning of a Potential Downturn):
· Price Action: The asset's price makes a new higher high.
· RSI Action: The RSI makes a lower high.
· Interpretation: This indicates that the momentum behind the price rise is weakening, even though the price is still going up. It's a warning sign that the uptrend may be losing steam and could reverse.
· Bullish Divergence (Warning of a Potential Upturn):
· Price Action: The asset's price makes a new lower low.
· RSI Action: The RSI makes a higher low.
· Interpretation: This indicates that the momentum behind the selling is weakening, even though the price is still falling. It's a sign that the downtrend may be exhausting itself and a reversal to the upside is possible.
The chart below illustrates how these key signals appear in a live market.
```mermaid
gantt
title RSI Interpretation & Signals
dateFormat X
axisFormat %s
section Key Levels
Oversold Territory (Below 30) : 0, 30
Neutral Territory : 30, 70
Overbought Territory (Above 70) : 70, 100
section Example Signals
Price makes a new high : milestone, 75, 0
RSI makes a lower high (Bearish Divergence) : milestone, 65, 0
Price makes a new low : milestone, 25, 0
RSI makes a higher low (Bullish Divergence) : milestone, 35, 0
```
3. Centerline Crossover
· RSI crosses above 50: This is seen as a shift to bullish momentum. The average gains are starting to exceed the average losses.
· RSI crosses below 50: This is seen as a shift to bearish momentum. The average losses are starting to exceed the average gains.
---
⚙️ Advanced RSI Concepts
· Failure Swings: Wilder also described "failure swings" as strong confirmation of a reversal. For example, a bearish failure swing occurs when the RSI enters overbought territory (above 70), pulls back, rallies again, but fails to cross back above 70 before turning down. This confirms the overbought signal.
· Adjusting the Time Period: The standard setting is 14 periods. Shorter periods (e.g., 6 or 9) make the RSI more sensitive, generating more signals (but also more false signals). Longer periods (e.g., 21 or 25) make the RSI smoother and less sensitive, generating fewer signals. Shorter settings are better for short-term trading, while longer settings are better for identifying longer-term trends.
· Different Overbought/Oversold Levels: In strong trending markets, some traders adjust the overbought/oversold levels to 80/20 to avoid getting whipped around by minor corrections.
---
⚠️ Limitations of the RSI
1. False Signals: Especially in strongly trending markets, the RSI can give premature signals by staying in overbought or oversold conditions for a long time.
2. It's a Lagging Indicator: Like all technical indicators, the RSI is based on past price data and is therefore lagging. It tells you what has happened, not what will happen.
3. Not a Standalone Tool: The RSI should never be used in isolation. Its power comes from being combined with other forms of analysis, such as:
· Trend Analysis: Is the overall market in an uptrend or downtrend?
· Support and Resistance Levels: Is the price approaching a key level?
· Other Indicators: Use it alongside volume indicators, moving averages, or MACD to confirm signals.
· Fundamental Analysis: What is the underlying value of the asset?
💡 Summary Table
Concept Description What it Suggests
Overbought ( >70 ) Price has risen too quickly. Potential for a pullback (caution for buyers).
Oversold ( <30 ) Price has fallen too quickly. Potential for a bounce (opportunity for buyers).
Bearish Divergence Price makes higher high, RSI makes lower high. Underlying momentum is weakening; potential trend reversal down.
Bullish Divergence Price makes lower low, RSI makes higher low. Selling pressure is weakening; potential trend reversal up.
Centerline Crossover RSI crosses above or below 50. Shift in bullish/bearish momentum.
In conclusion, the RSI is an incredibly versatile and popular tool for gauging market momentum and potential reversal points. However, its effectiveness is greatly enhanced when it is used as part of a comprehensive trading strategy that considers price action, volume, and the overall market trend.